Bài giảng điện tử môn Tiếng Anh 7 Unit 1: My Time Lesson 8 - CLIL | Friends Plus
Bài giảng điện tử môn Tiếng Anh 7 Unit 1: My Time Lesson 8 - CLIL | Friends Plus được VietJack sưu tầm và soạn thảo để gửi tới các bạn học sinh cùng tham khảo, ôn tập đầy đủ kiến thức, chuẩn bị cho các buổi học thật tốt. Mời bạn đọc đón xem!
Chủ đề: Giáo án Tiếng Anh 7 201 tài liệu
Môn: Tiếng Anh 7 1.5 K tài liệu
Sách: Friends Plus
Tác giả:


Preview text:
ODD-ONE-OUT: 1.mall cinema café school 2.watch TV make cakes do housework draw a picture 3.by car on foot by bus by bicycle 4.riding driving gardening flying 5.pork fruit juice coffee beer UNIT 1:
LESSON 8: CLIL – MATH: DATA AND CHARTS
• Describing their time. SET CONTEXT:
How many students watch these popular TV programs?
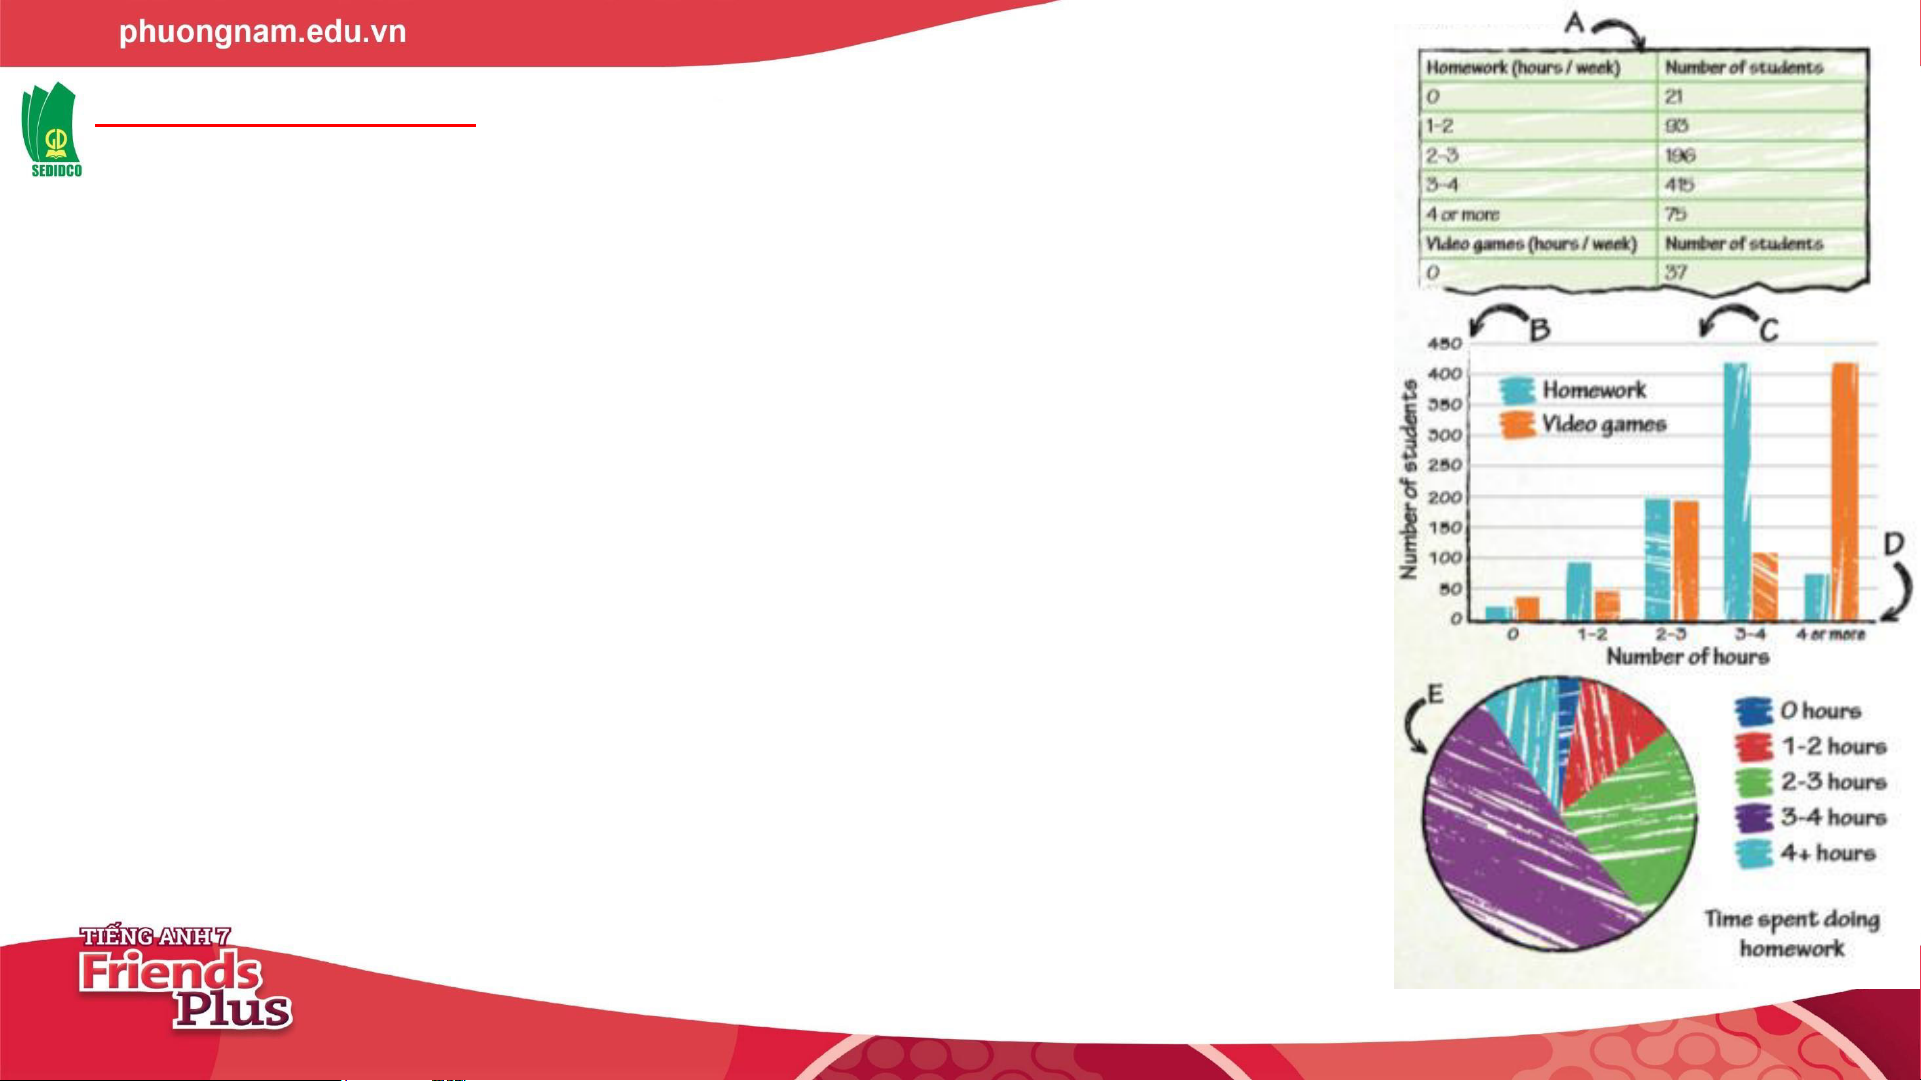
✓Activity 1: Check the meaning of the words in the box and
match them with A-E in the charts. bar chart pie chart data chart y-axis x-axis ➔ A data chart B y-axis C bar chart D x-axis E pie chart NEW WORDS:
1. bar chart (n) /ˈbɑː ˌtʃɑːt/
biểu đồ hình khối
a type of graph using rectangles
2. data chart (n) /ˈdeɪtə ˌtʃɑːt / biểu đồ dữ liệu
a graph to show the relation between two sets of
information or changeable amounts
3. pie chart (n) /ˈpaɪ ˌtʃɑːt/
biểu đồ hình tròn
a circle with parts to show how we divide a total amount 4. x-axis (n)
/ˈeksˌæksɪs/ trục x, trục hoành
the line of figures from left to right on a graph 5. y-axis (n)
/ˈwaɪˌæksɪs/ trục y, trục tung
the line of figures from top to bottom on a graph
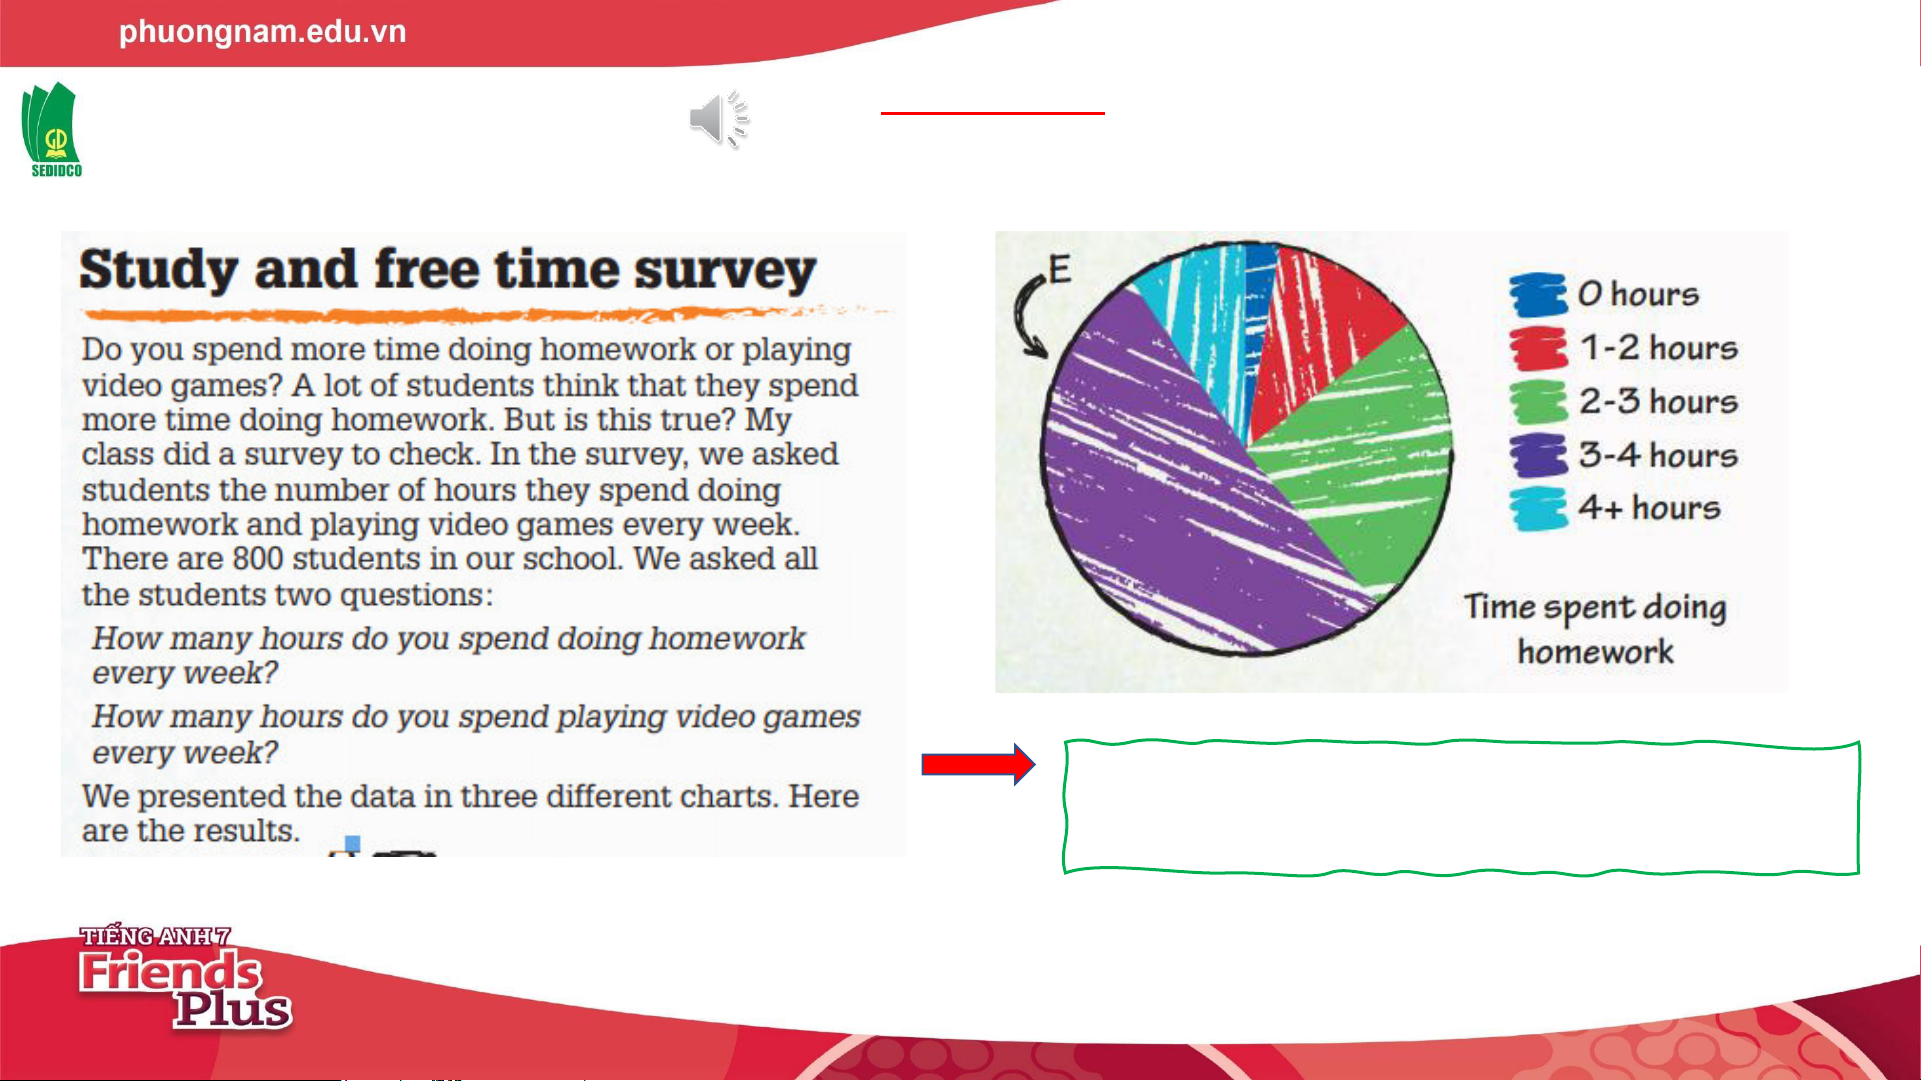
✓Activity 2: Read and listen to the text. What
information does the pie chart NOT give?
It doesn’t give information about the
numbers of students in each group.
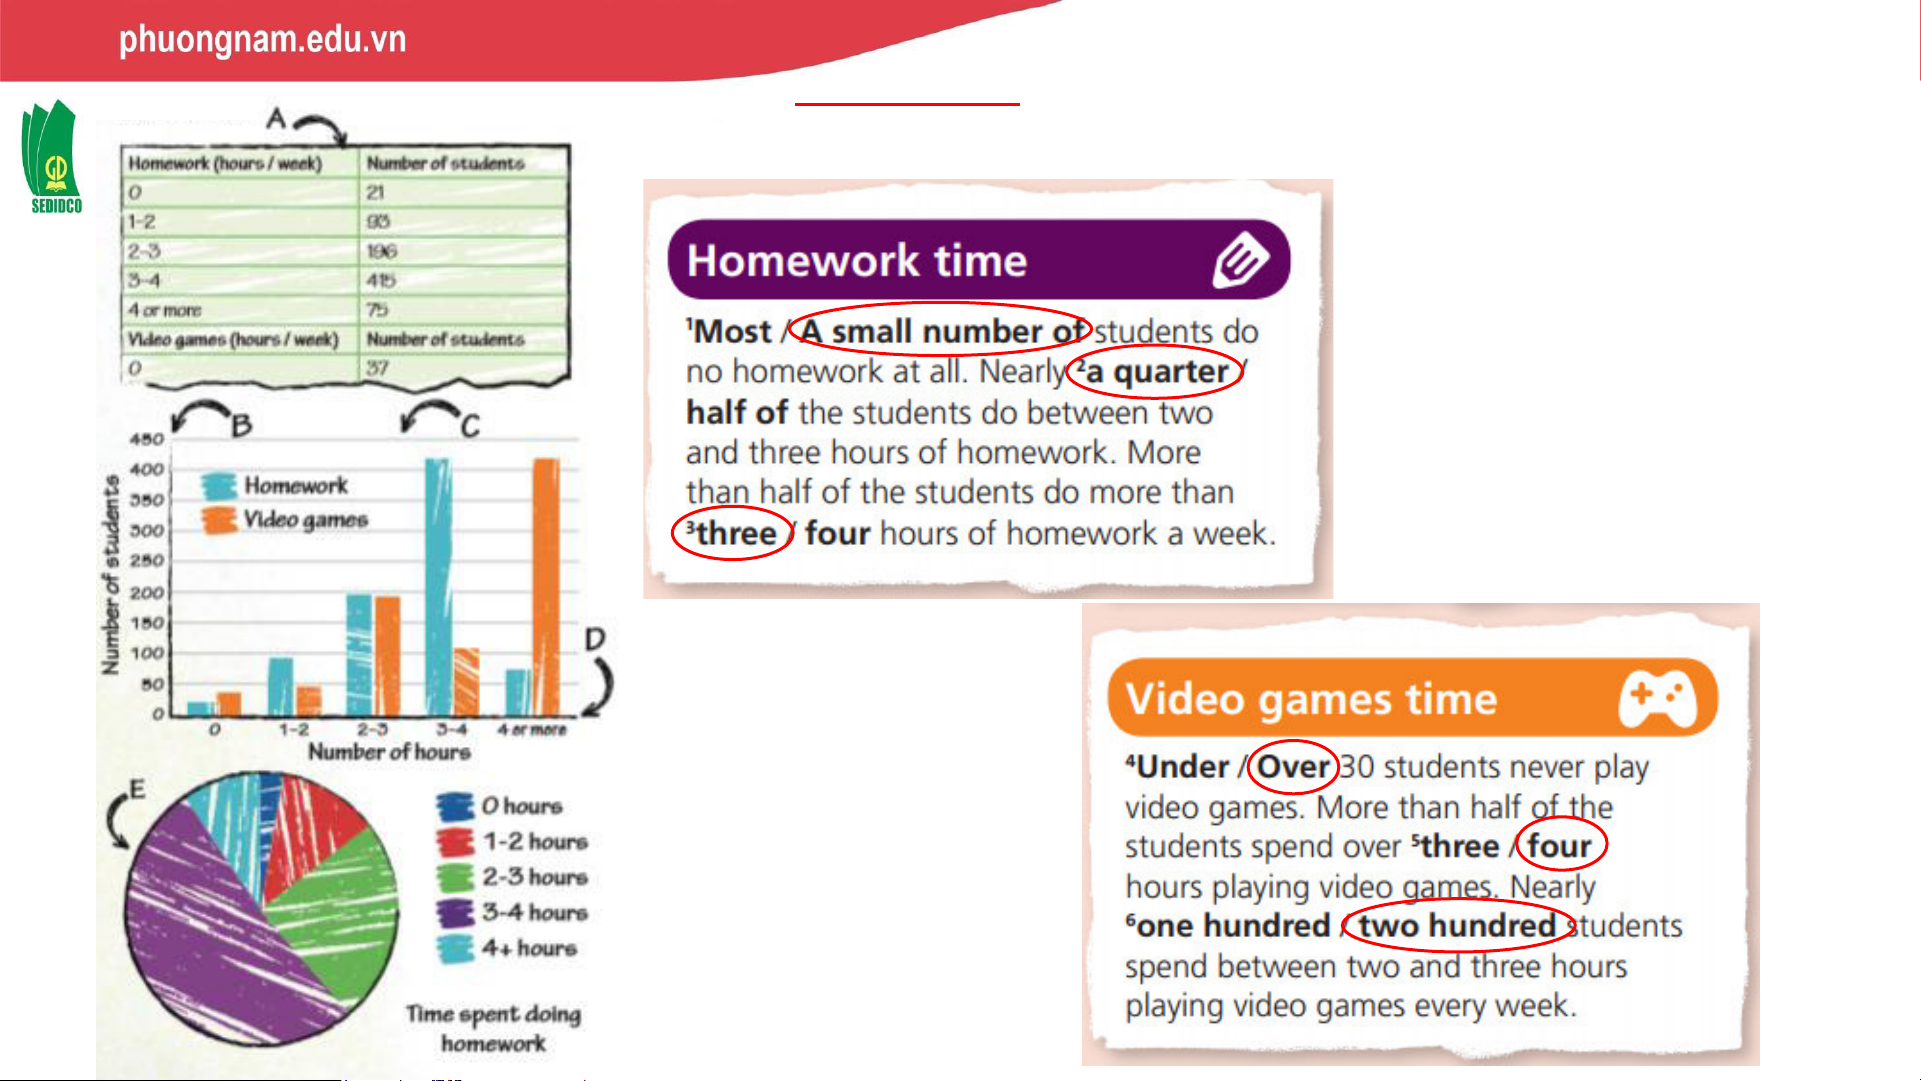
✓Activity 3: Study the charts. Then choose the correct words in the reports.
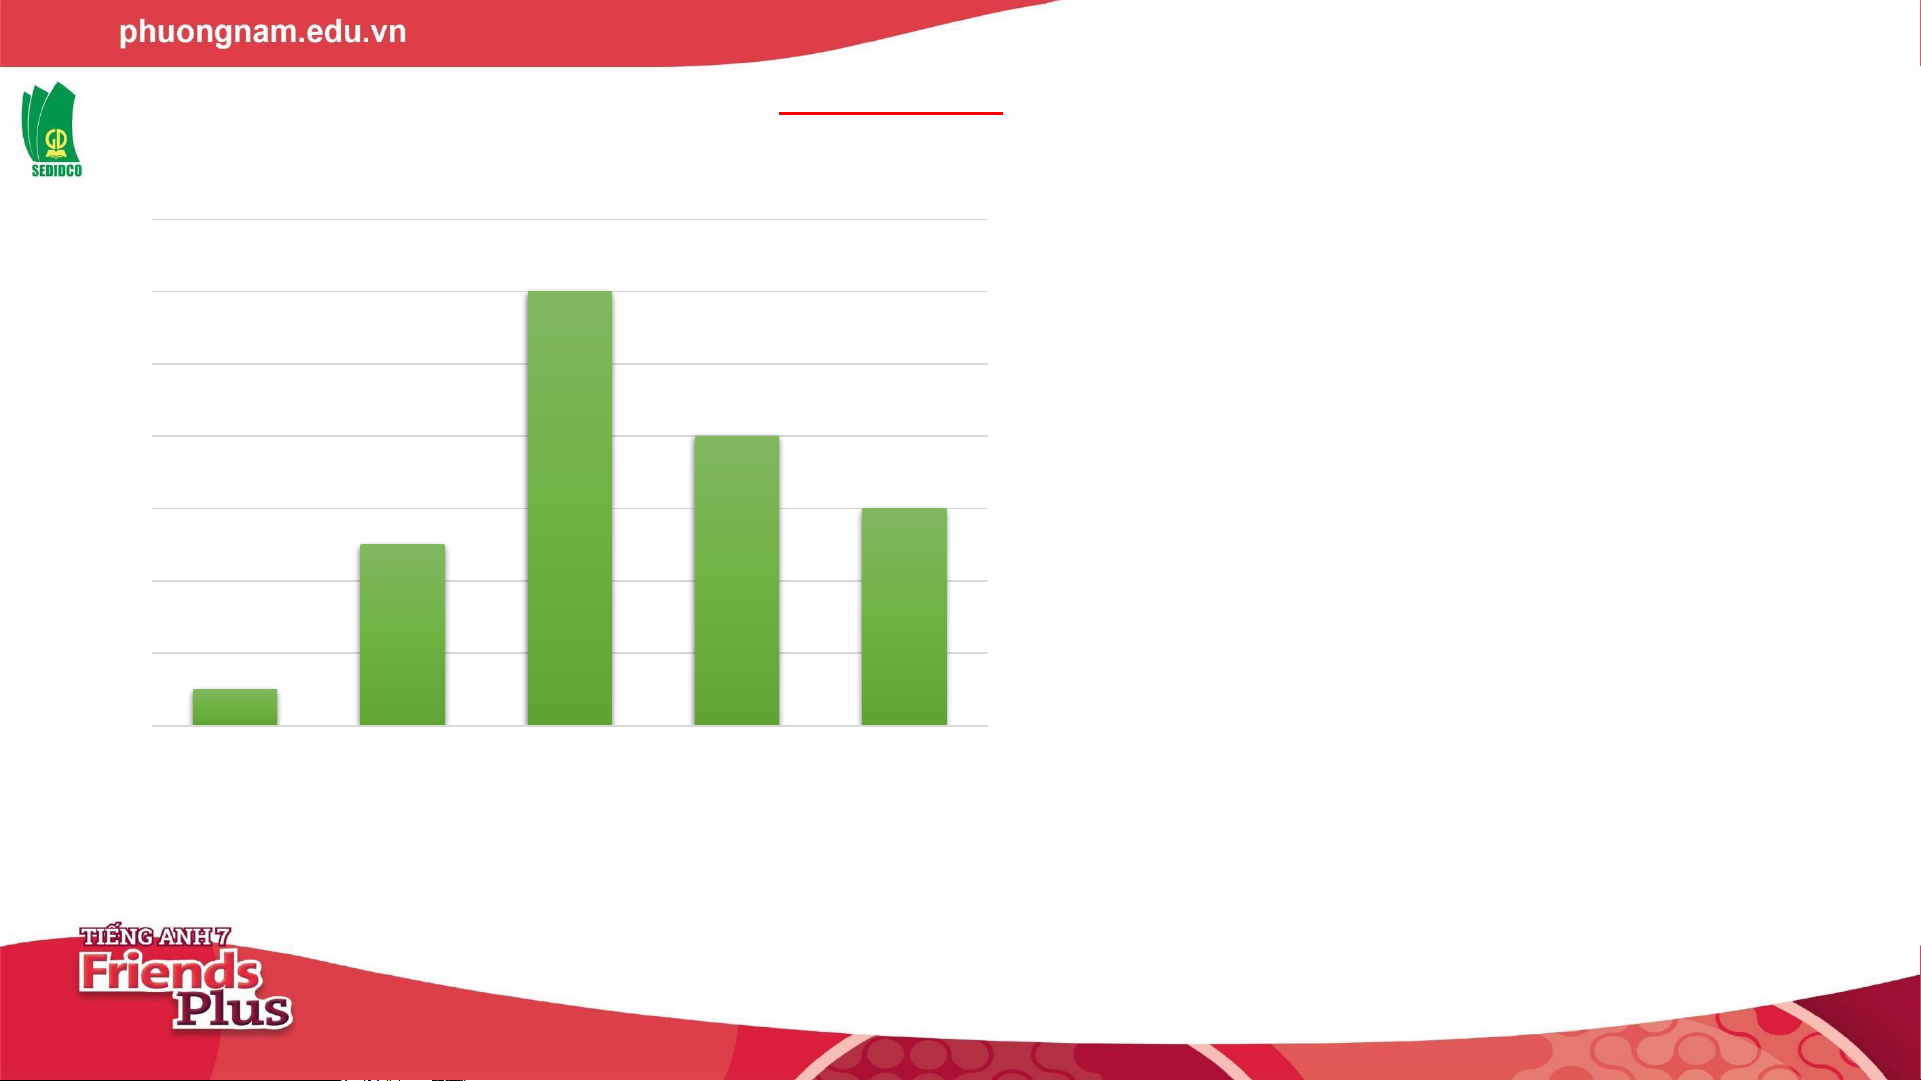
✓Activity 4: USE IT! Draw a bar chart for the data in the chart below. 14 12 ts 10 en d tu 8 f s o 6 er 4 Numb 2 0 0 1–4 4–8 8–12 12 and over
Watching TV (hours/week)
✓Activity 5: Use it! Further practice from Activity 4. 14
* Focus on the data in exercise 12
4 and write the report . ts 10 en d EX: tu 8 of s -
How many students were in the survey 6 er 4 altogether? Numb 2 -
About a quarter of the students watch 0
between 8 and 12 hours per week. A 0 1–4 4–8 8–12 12 and over
Watching TV (hours/week)
small number watch more than 12 hours.
- Learn by heart all the new words.
- Prepare the next lesson “Puzzles and games”.
Document Outline
- Default Section
- Slide 1
- Slide 2
- Slide 3
- Slide 4
- Slide 5
- Slide 6
- Slide 7
- Slide 8
- Slide 9
- Slide 10
- Slide 11
- Slide 12
- Slide 13
- Slide 14
Tài liệu liên quan:
-

Bài giảng điện tử môn Tiếng Anh 7 Progress Review 4 Part 2 | Friends Plus
353 177 -

Bài giảng điện tử môn Tiếng Anh 7 Progress Review 4 Part 1 | Friends Plus
329 165 -

Bài giảng điện tử môn Tiếng Anh 7 Progress Review 3 Part 2 | Friends Plus
302 151 -

Bài giảng điện tử môn Tiếng Anh 7 Progress Review 3 Part 1 | Friends Plus
356 178 -

Bài giảng điện tử môn Tiếng Anh 7 Progress Review 2 Part 2 | Friends Plus
315 158