Bài tập về nhà kiểm tra cuối kỳ quản lý chất lượng | Đại học Thái Nguyên
Exercise 1: Pareto Chart. Pareto is a statistical tool used to display the frequency of different events in descending order. This chart helps identify and prioritize issues based on their importance. Tài liệu giúp bạn tham khảo, ôn tập và đạt kết quả cao. Mời đọc đón xem!
Môn: Quản lý chất lượng 3 tài liệu
Trường: Đại học Thái Nguyên 386 tài liệu
Tác giả:

Preview text:
lOMoAR cPSD| 45349271 ASSIGNMENT
Exercise 1: Pareto Chart
Pareto is a statistical tool used to display the frequency of different events in descending
order. This chart helps identify and prioritize issues based on their importance. For example,
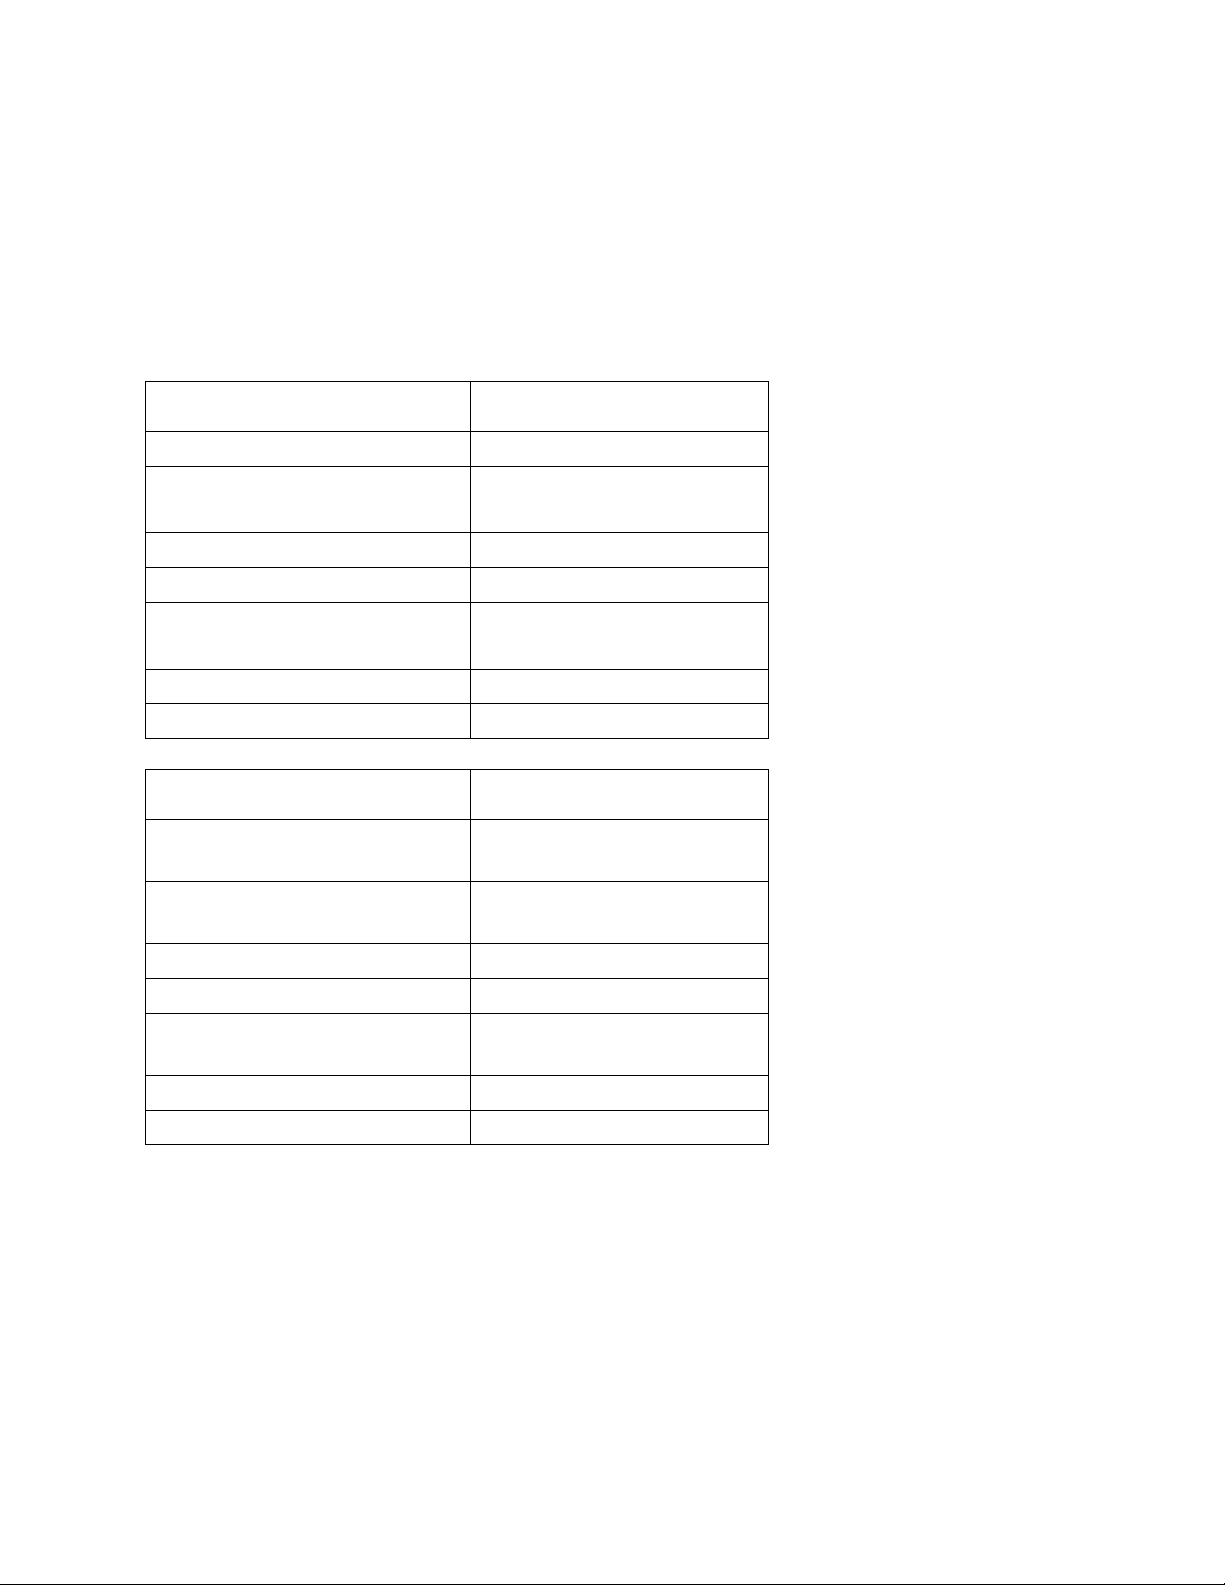
identify key issues that affect a restaurant's service quality. Below is a hypothetical table of figures: Reason for the problem Number of reflections
Long wait when ordering 30
Service attitude is not 20 good Food not hot 15 Errors in orders 12 Uncomfortable about 10 space Table is not clean 8 Food is not good 5
Step 1: Select and sort problems by number of light analyzes. Reason for the problem Number of reflections Long wait when 30 ordering Service attitude is not 20 good Food not hot 15 Errors in orders 12 Uncomfortable about 10 space Table is not clean 8 Food is not good 5
Step 2: Calculate the total cumulative number of times for each problem.
Total number of reflections = 30+20+15+12+10+8+5 = 100
Step 3: Calculate the contribution percentage
To calculate the Contribution Percent of each event in the restaurant, use the following formula:
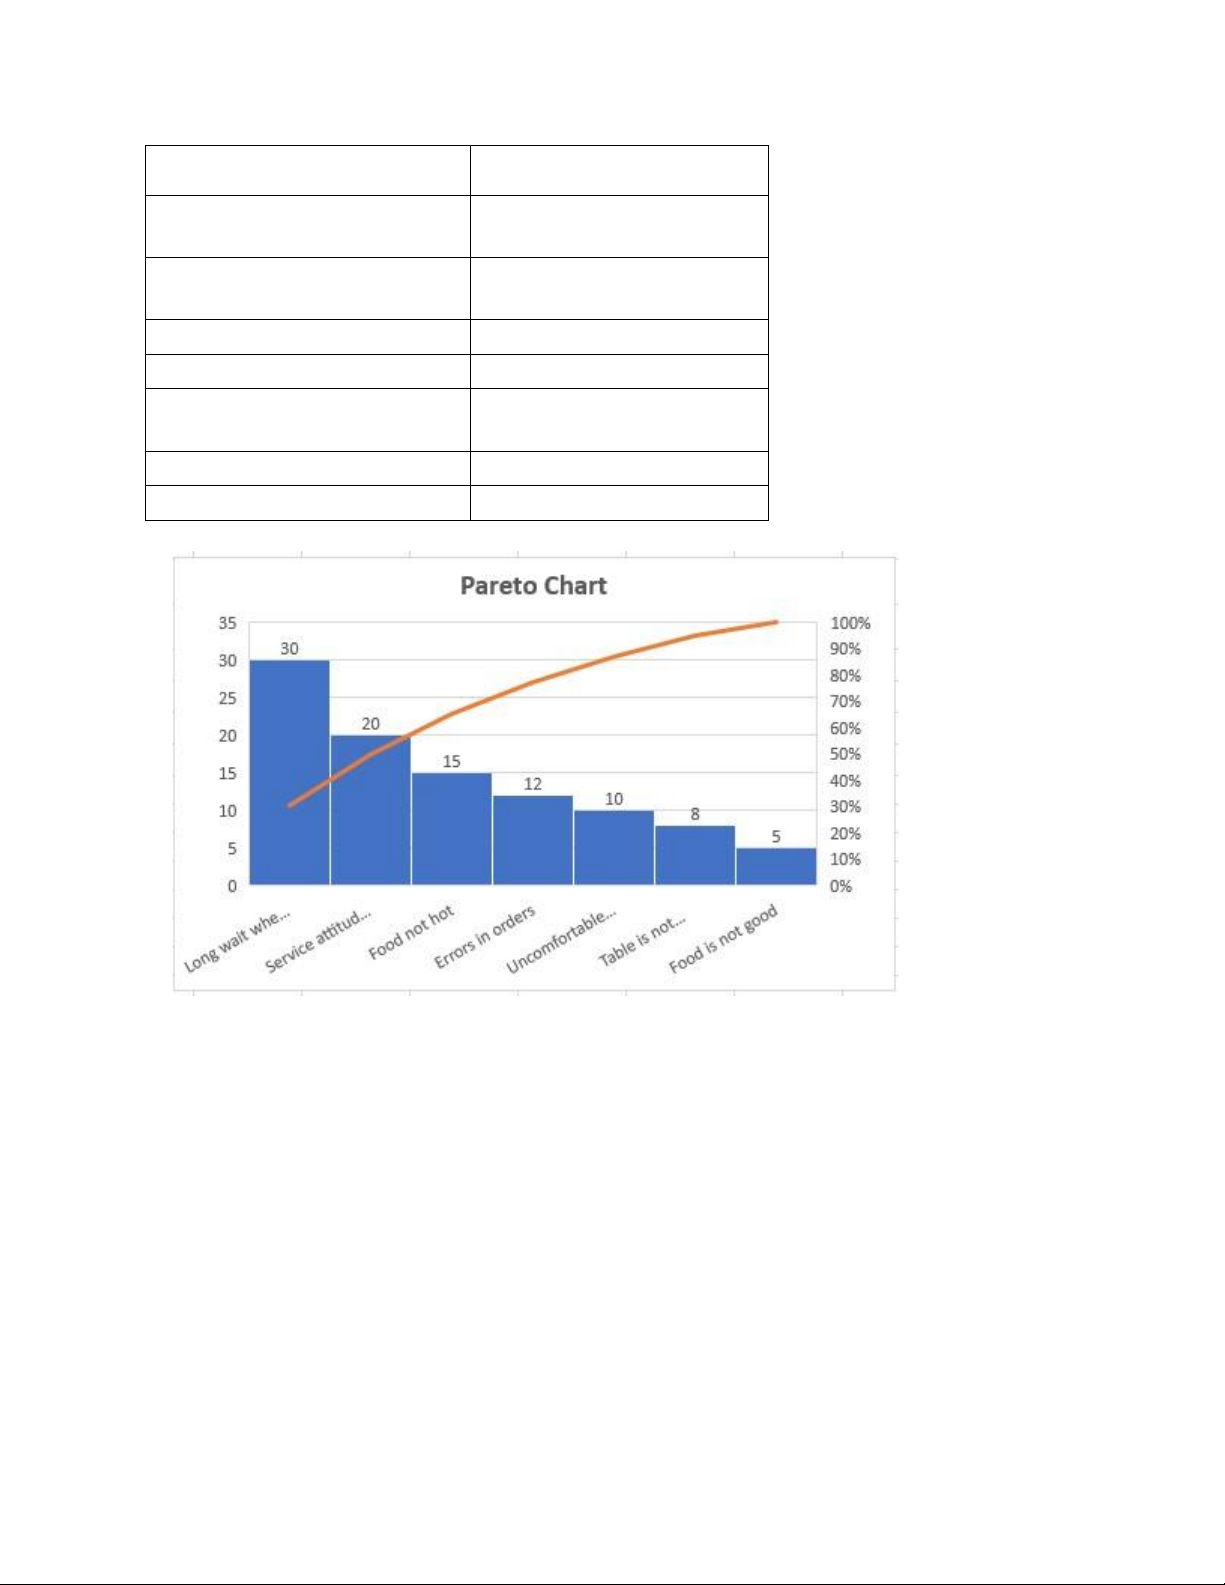
Contribution percentage = (Number of reflections/ Total number of reflections) x 100% lOMoAR cPSD| 45349271 Reason for the problem Number of reflections Long wait when 30 % ordering Service attitude is not 20 % good Food not hot 15 % Errors in orders 12 % Uncomfortable about 10 % space Table is not clean 8 % Food is not good 5 %
Step 3: Draw a Pareto chart with cumulative columns and lines
Step 4: Analyze the chart to identify the most important issues and suggest improvements
Based on data from the chart, problems can be identified:
- Prioritize solving the problem of long waits when ordering to improve the main customer experience.
- Retrain employees on service attitude to increase customer satisfaction.
- Check and improve cooking processes to ensure food is always hot when served.
- Optimize the ordering process to minimize errors. lOMoAR cPSD| 45349271
- Reconsider table and space layout to create more comfortable conditions for customers.
- Enhance cleaning procedures to ensure table cleanliness.
- Re-evaluate the menu and get feedback to improve food quality.
The above detailed analysis helps to clearly identify important issues and suggest possible
improvement measures to improve service quality in the restaurant.
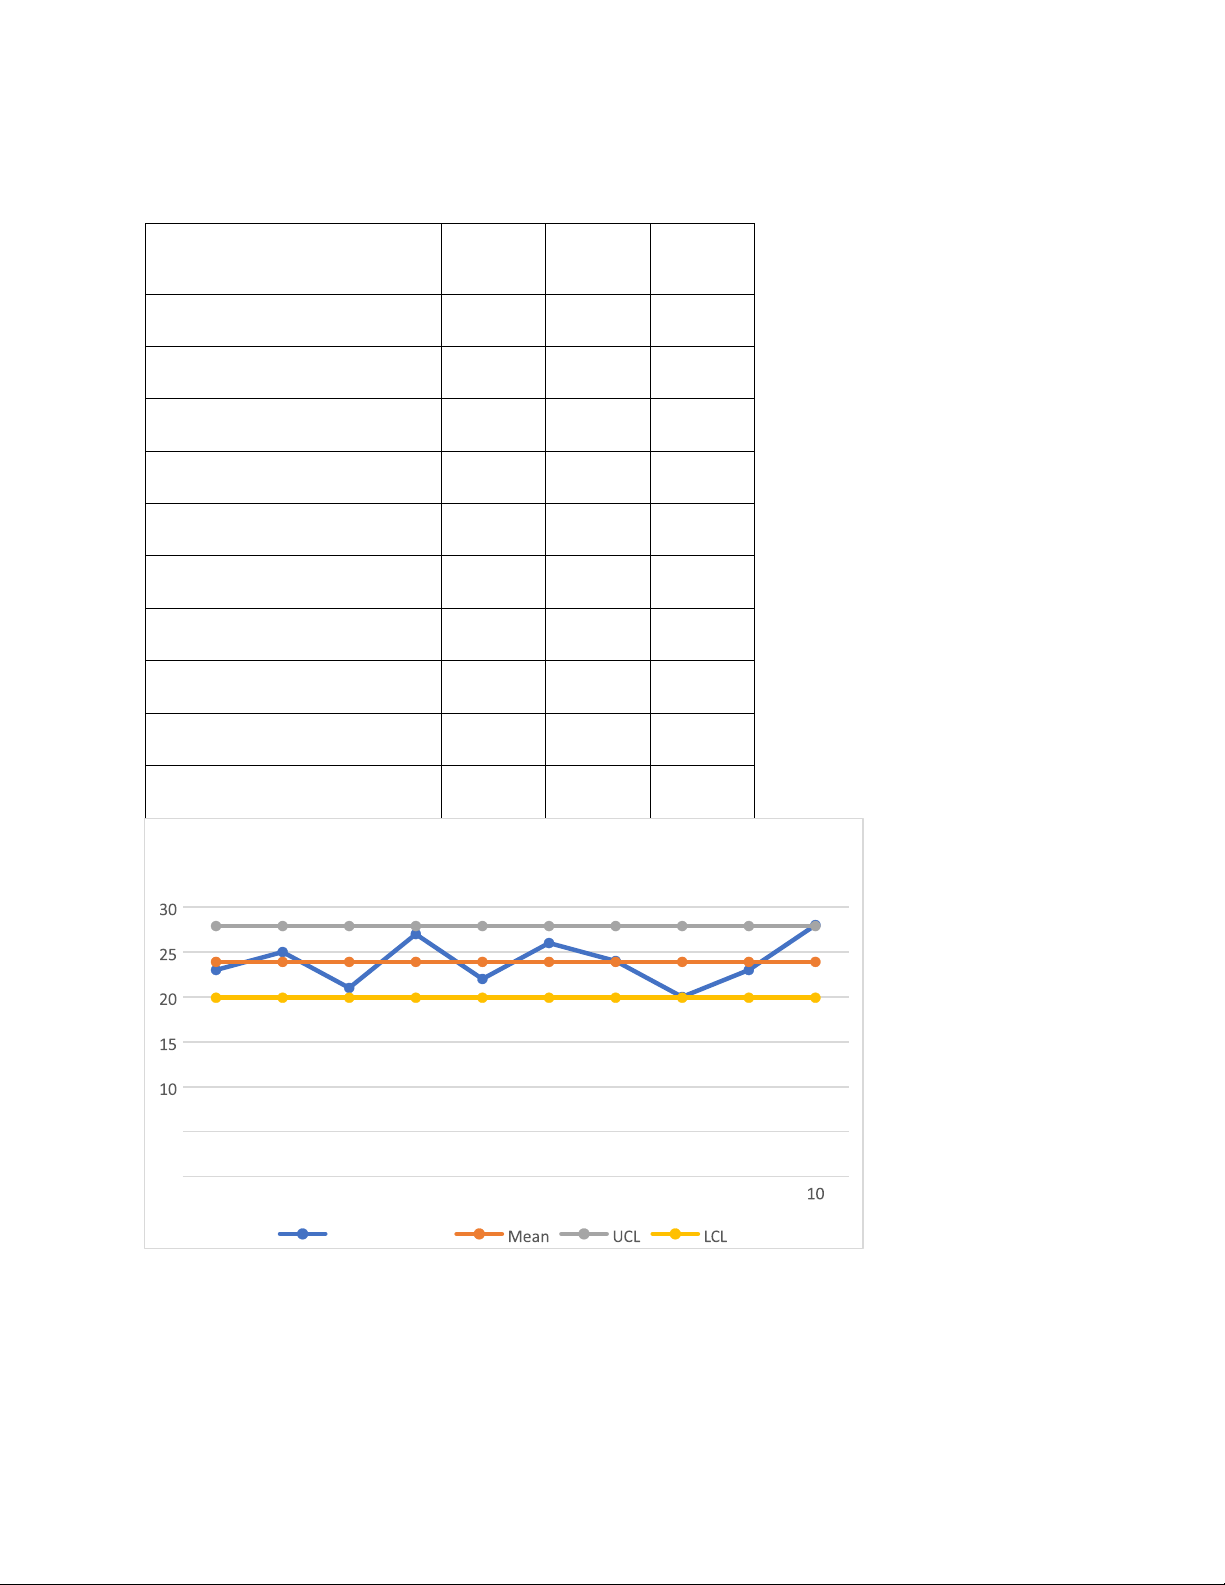
Exercise 2 : Control Chart
A Control Chart is a statistical tool used to monitor manufacturing or application delivery
processes and determine whether a system is stable or experiencing exceptional fluctuations.
Track the time it takes to deliver an order from the warehouse to the customer's address, and
see if the process is consistent. Time (minutes) 23 25 21 27 22 26 24 20 23 28
Step 1: Calculate Average (Mean)
Mean= ∑Thời Gian/số lần đo = 239/10 = 23.9
Step 2: Calculate Range
Range = Thời Gianmax − Thời Gianmin Range = 28−20 =8
Step 3: Calculate control Limits
UCL = 23.9+2.66 × 8/√10 ≈ 27.89 lOMoAR cPSD| 45349271
LCL = 23.9 − 2.66 × 8/√10 ≈ 19.91 Control Chart Time (minutes) Mea UCL LCL n 23 23.9 27.89 19.91 25 23.9 27.89 19.91 21 23.9 27.89 19.91 27 23.9 27.89 19.91 22 23.9 27.89 19.91 26 23.9 27.89 19.91 24 23.9 27.89 19.91 20 23.9 27.89 19.91 23 23.9 27.89 19.91 28 23.9 27.89 19.91 Control Chart 5 0 1 2 3 4 5 6 7 8 9 Time (minutes)