Báo cáo tài chính | Môn Tài chính quốc tế - Đại học Sư phạm Kỹ thuật Thành phố Hồ Chí Minh
Báo cáo tài chính Môn Tài chính quốc tế. Tài liệu được sưu tầm gồm 42 trang, giúp bạn ôn tập tốt hơn. Mời các bạn đón xem.
Môn: Tài chính quốc tế 32 tài liệu
Trường: Trường Đại học Sư phạm Kỹ thuật Thành phố Hồ Chí Minh 4.3 K tài liệu
Tác giả:


Preview text:
lOMoAR cPSD| 58778885
Viva Energy Group Limited (the “Company”) ACN 626 661 032
Appendix 4D: Half-year report
Results for announcement to the market
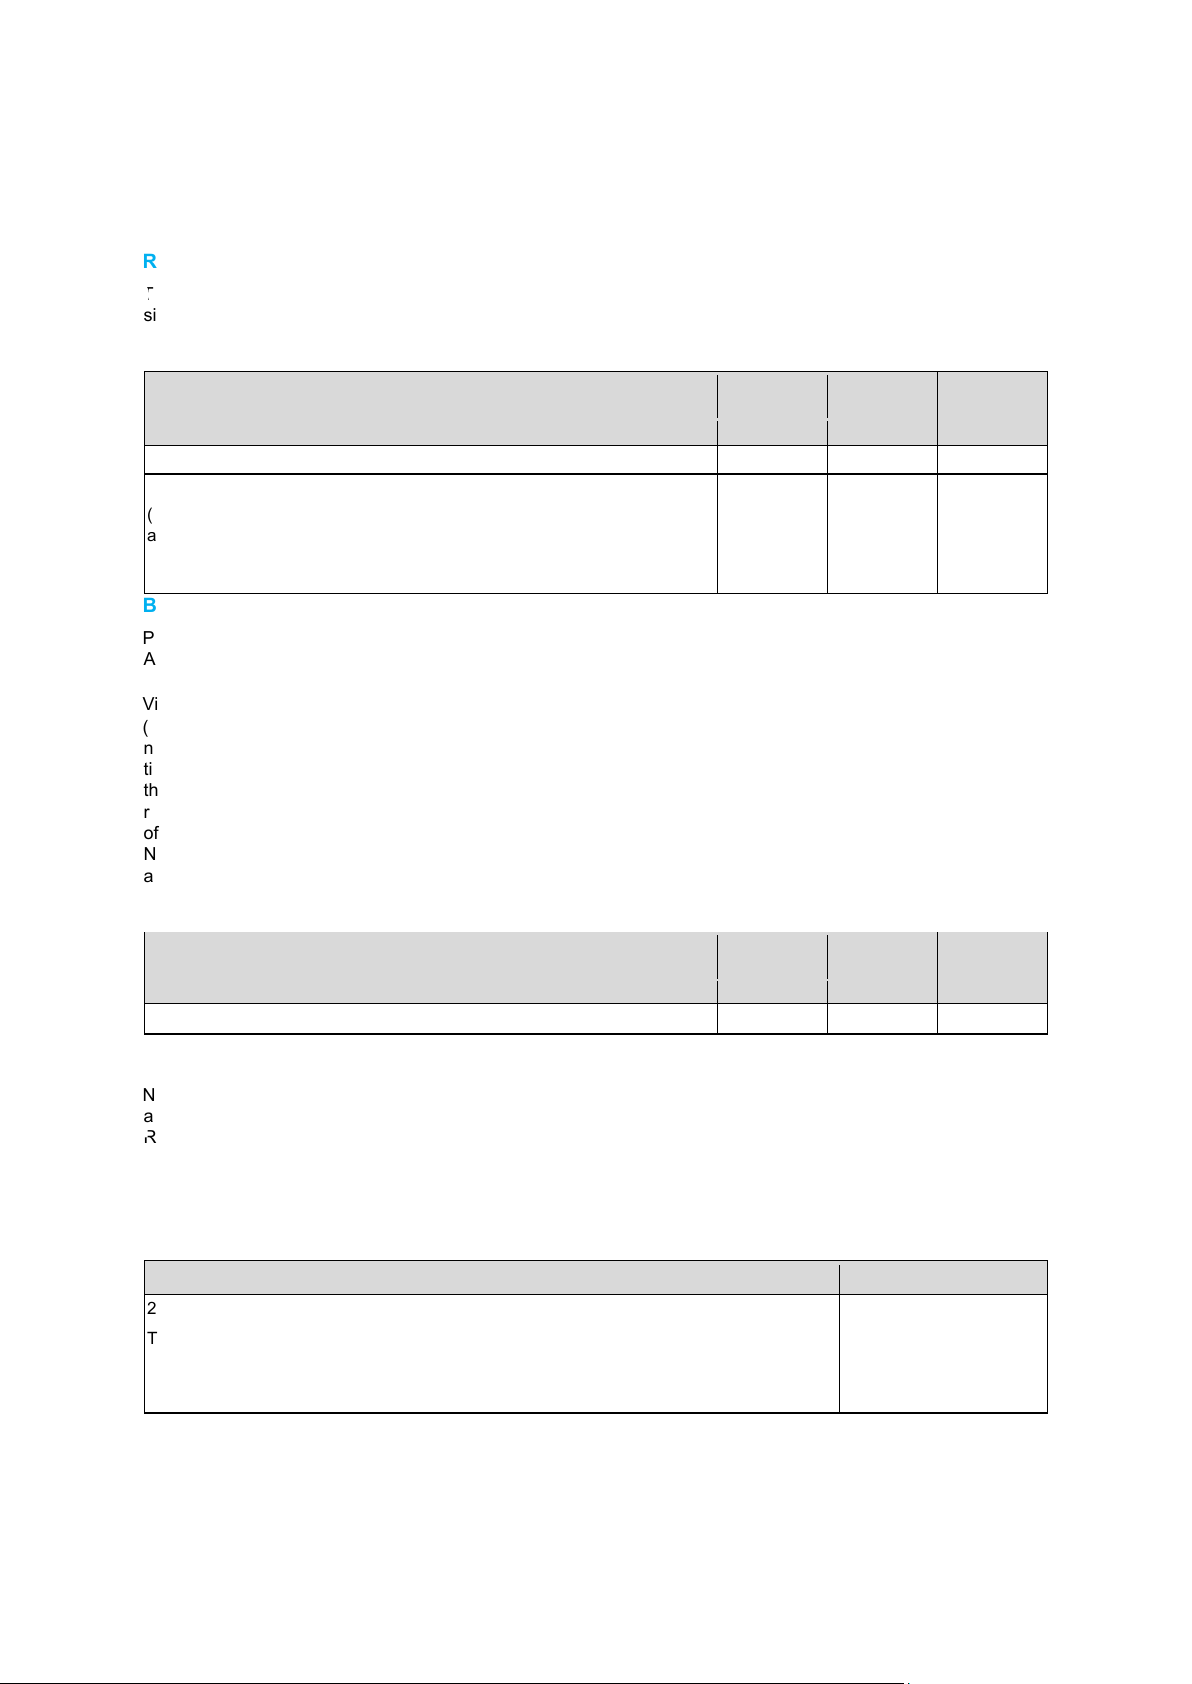
The current reporting period is the six month period ended 30 June 2023. The previous corresponding period is the
six month period ended 30 June 2022. 30 June 30 June 2023 2022 % Change $M $M Revenue 12,722.8 11,517.1 10.5%
(Loss)/profit from ordinary activities after tax / net (loss)/profit for the period
attributable to shareholders Historical cost basis (77.5) 520.9 -114.9% Replacement cost basis 174.1 355.4 -51.0%
Brief explanation of basis of results
Profit from ordinary activities after tax and net profit for the period are prepared in accordance with the Corporations
Act 2001 and International Financial Reporting Standards (IFRS).
Viva Energy Group Limited (the “Company” or “Viva Energy”) reports its performance on a “Replacement Cost”
(RC) basis. RC is a non-IFRS measure under which the cost of goods sold is calculated on the basis of theoretical
new purchases of inventory instead of the historical cost (HC) of inventory. As a result, it removes the effect of
timing differences and management believes it enables users of the financial information to more clearly observe
the operating performance of the business independently of the impact of movements in the oil price. RC basis
reporting also includes lease expense to provide better transparency of underlying cash performance. The effects
of applying inventory and lease accounting standards are captured between Net Profit/(Loss) After Tax (RC) and
Net Profit/(Loss) After Tax (HC), as are any significant items, and revaluation impacts on foreign exchange (FX) and oil derivatives. 30 June 30 June 2023 2022 % Change $ $ Net tangible asset per share 0.98 1.27 -22.8%
Net tangible asset per share is derived by dividing net tangible assets by the number of ordinary shares on issue
as at 30 June of each period. Net tangible assets are net assets attributable to members less intangible assets.
Right of use assets have been treated as tangible for the purpose of this calculation. Dividends 2023
2023 Interim dividend – amount per security (fully franked) 8.5 cents Trading on ex dividend basis 5 September 2023
Record date for determining entitlement to final dividend 6 September 2023
Date dividend expected to be paid 20 September 2023
There is no dividend or distribution re-investment plan currently in operation and there is no foreign sourced income
component distributed in relation to the dividend.
This information should be read in conjunction with the 2023 Half-year Financial Report of Viva Energy Group
Limited (‘2023 Half-year Report’) and associated ASX market releases made during the period. The 2023 Half-year lOMoAR cPSD| 58778885
Viva Energy Group Limited and controlled entities
Financial report for the half-year ended 30 June 2023
Report includes additional Appendix 4D disclosure requirements and commentary on the results for the period ended 30 June 2023.
This report is based on the 2023 Half-year Financial Report which has been audited by PricewaterhouseCoopers
(‘PwC’). PwC has not audited Underlying numbers included in the Directors’ report. The Independent Auditor’s
Report provided by PwC is included in the 2023 Half-year Financial Report. Julia Kagan Company Secretary 22 August 2023
Viva Energy Group Limited and controlled entities
Interim report - 30 June 2023 ACN: 626 661 032 ABN: 74 626 661 032 lOMoAR cPSD| 58778885
Viva Energy Group Limited and controlled entities
Financial report for the half-year ended 30 June 2023 Contents
Directors’ report....................................................................................................................................... 4
Auditor’s Independence Declaration ..................................................................................................... 19
Consolidated statement of profit or loss ............................................................................................... 21
Consolidated statement of comprehensive income .............................................................................. 22
Consolidated statement of financial position ........................................................................................ 23
Consolidated statement of changes in equity ....................................................................................... 25
Consolidated statement of cash flows .................................................................................................. 26
Notes to the consolidated financial statements .................................................................................... 28
1. Corporate information ...................................................................................................................... 28
2. Basis of preparation ......................................................................................................................... 28
3. Significant changes in the current reporting period ......................................................................... 28
4. Revenue ........................................................................................................................................... 28
5. Other items of profit or loss .............................................................................................................. 29
6. Segment information ........................................................................................................................ 30
7. Dividends determined and paid ....................................................................................................... 32
8. Inventories ........................................................................................................................................ 33
9. Income tax and deferred tax ............................................................................................................ 33
10. Financial assets and liabilities ........................................................................................................ 33
11. Fair value measurement of financial instruments .......................................................................... 34
12. Contributed and other equity .......................................................................................................... 36
13. Business combinations .................................................................................................................. 37
14. Events occurring after the reporting period .................................................................................... 39
Directors’ declaration ............................................................................................................................ 39
Independent auditor’s review report .................................................................................................... 34 lOMoAR cPSD| 58778885
Viva Energy Group Limited and controlled entities
Financial report for the half-year ended 30 June 2023 Directors’ report
The Directors present their report, together with the Financial Report of Viva Energy Group Limited (the
‘Company’) and the entities it controlled (collectively, the ‘Group’), for the half-year ended 30 June 2023.
This Directors’ Report has been prepared in accordance with the requirements of the Corporations Act 2001 (Cth).
The following information forms part of this report: •
Operating and financial review on pages 4 to 15; and •
External auditor’s independence declaration on page 17.
A reference to Viva Energy, we, us or our is a reference to the Group or the Company, as the case may be. Directors
The fol owing persons were Directors of the Company during the whole of the half-year and up to the date of this
report (unless otherwise stated): Robert Hill
Chairman, Independent Non-Executive Director Scott Wyatt
Chief Executive Officer (CEO), Managing Director Dat Duong Non-Executive Director Michael Muller Non-Executive Director Arnoud De Meyer
Independent Non-Executive Director Sarah Ryan
Independent Non-Executive Director
Nicola Wakefield Evans Independent Non-Executive Director Company Secretaries
The following persons were Company Secretaries during the whole of the half-year and up to the date of this report (unless otherwise stated): Julia Kagan Company Secretary Cheng Tang Company Secretary Principal Activities
During the period, the principal activities of the Group included the following: •
sales of fuel, lubricants and convenience offerings across Australia; •
the supply of energy and industrial solutions and services across key sectors of Australia’s economy; •
management of a national supply, distribution and terminal network; and manufacturing
activities at the Group’s Geelong oil refinery.
Operating and financial review Company overview
Viva Energy is a leading convenience retailer, commercial services and energy infrastructure business, with a
history spanning more than 120 years in Australia. The Group operates a convenience and fuel network of more
than 700 stores across Australia, and exclusively supplies Shell fuels and lubricants to a total network of more than 1,300 service stations.
Viva Energy owns and operates the strategically located Geelong Refinery in Victoria, and operates bulk fuels,
aviation, bitumen, marine, chemicals, polymers and lubricants businesses supported by more than 20 terminals
and 60 airports and airfields across the country. Convenience & Mobility
Viva Energy Retail is the largest integrated convenience and fuel network in Australia under a single operator. Its
network of more than 700 stores meets the convenience and mobility needs of customers across the country, with
an established offering under the Shell and Coles Express brands. lOMoAR cPSD| 58778885
Viva Energy Group Limited and controlled entities
Financial report for the half-year ended 30 June 2023
Directors’ report (continued)
Operating and financial review (continued)
With a total network presence at more than 1,300 sites, Viva Energy Retail exclusively supplies fuels and lubricants
through the Shell, Liberty and Westside branded retail service stations. Liberty Convenience, which is a 50% joint
venture which the Group has a right to ful y acquire from 2025, provides a value-led, independent brand and a
differentiated fuel and convenience offer. Commercial & Industrial
Viva Energy is a leading diversified supplier of energy and industrial solutions and services across key sectors of
Australia’s economy. The Group supplies fuel, lubricants, polypropylene and specialty hydrocarbon products to
commercial customers in the aviation, marine, transport, resources, construction, agriculture and manufacturing
industries, as well as wholesalers. Viva Energy’s strong position across many segments is underpinned by national
infrastructure and long-standing customer relationships.
The Group engages with customers extensively on decarbonisation efforts, including the potential use of biofuels
and hydrogen for when they become commercially viable. The carbon solutions business has achieved carbon
neutral certification by Climate Active for most products. In addition to jet fuel, customers are offered the option to
offset emissions from diesel, marine fuel, unleaded petrol, solvents and bitumen. Energy & Infrastructure
Viva Energy has an extensive national import, storage and distribution infrastructure network through which it
supplies the energy needs of consumers across the country, while leveraging these positions to support the
transition to lower-carbon energies.
The Group owns and operates the country’s largest and most complex refinery in Australia, located at Geelong in
Victoria. Refineries play an important role in processing Australian and imported crude oil into petroleum products
which meet Australian specifications and help to enhance fuel supply security for the country. Geelong Refinery
supplies more than 10% of Australia’s total fuel requirements (approximately 50% of Victoria’s fuel demand) and
is the only manufacturer of bitumen, aviation gasoline (Avgas) for use in piston engine aircraft, aromatic and
aliphatic based solvents, and polypropylene products.
Consolidated results for the half-year ended 30 June 2023
The Group Net loss after tax on a historical cost (‘HC’) basis for the half-year ended 30 June 2023 (1H2023) was
$77.5 million (‘M’). After adjusting for net inventory loss, significant one-off items, revaluation losses and non-cash
lease adjustments, Net profit after tax on a replacement cost (‘RC’) basis for the period was $174.1M. A
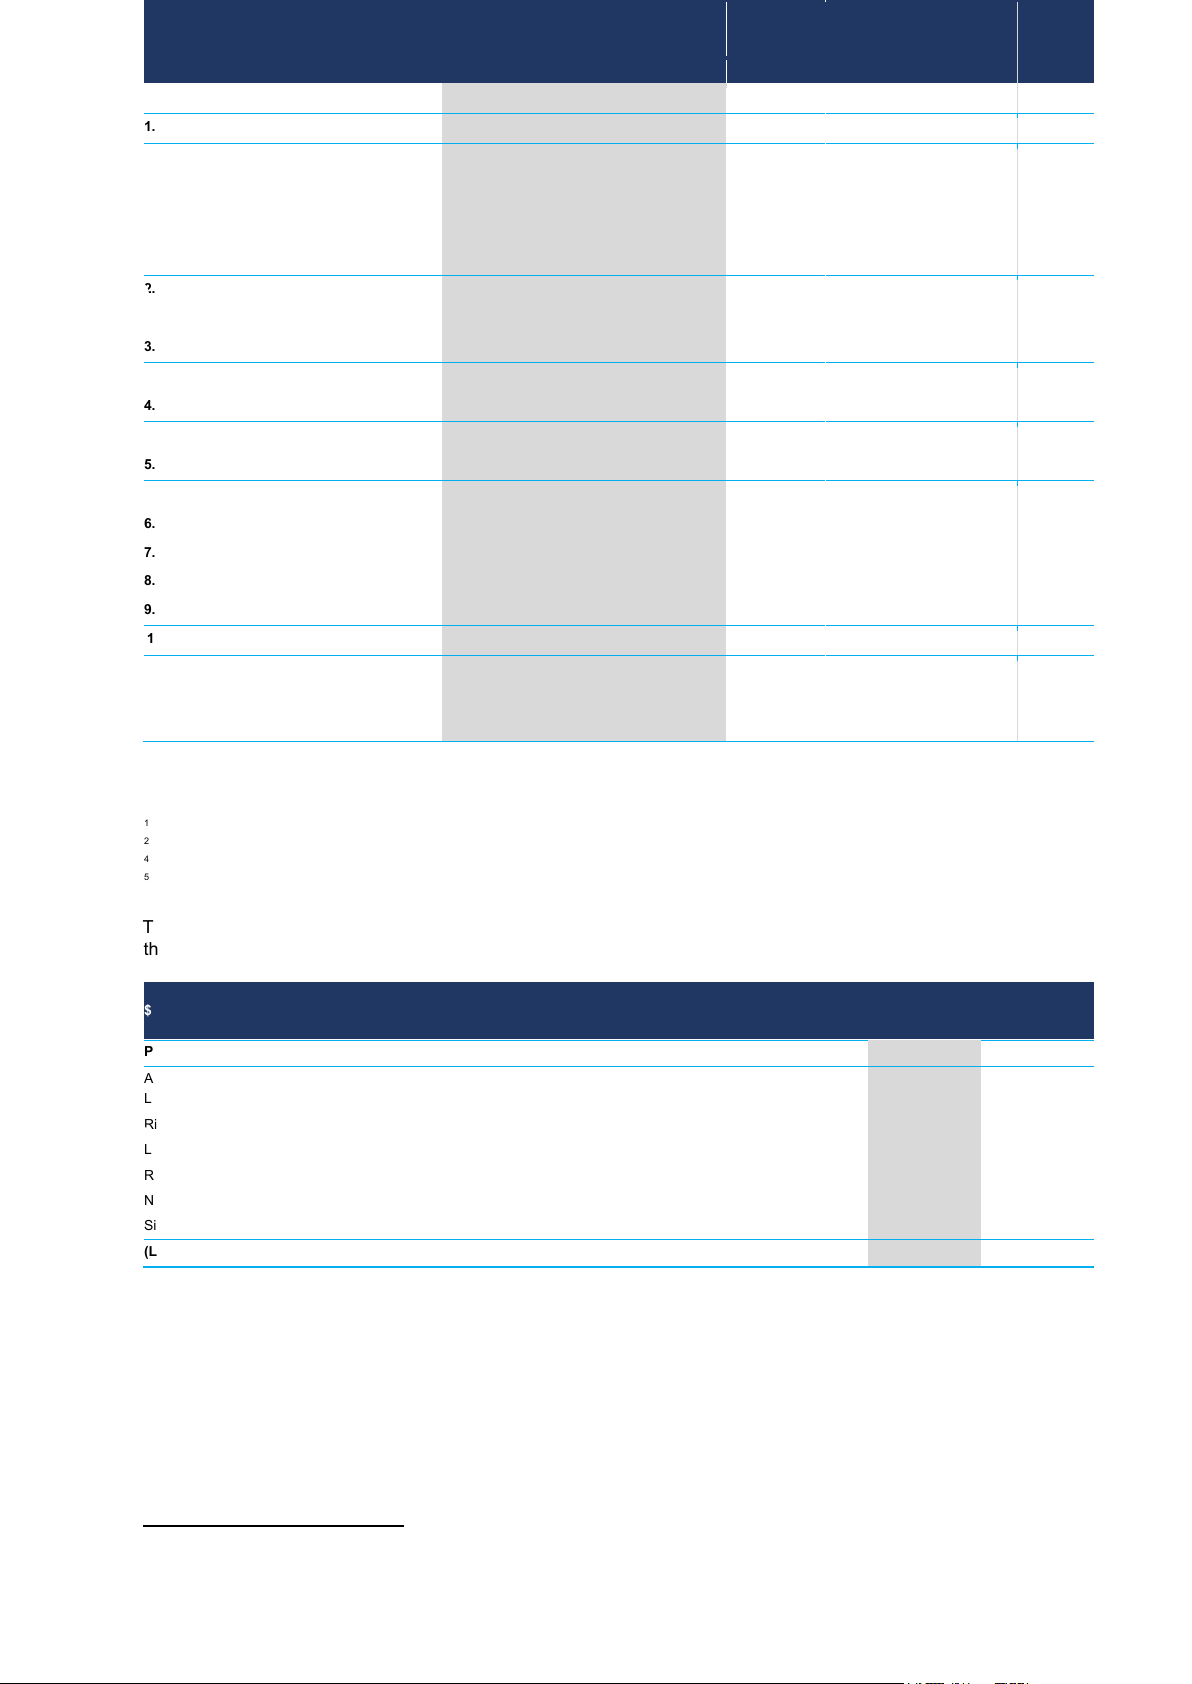
reconciliation from Statutory Loss After Tax (HC) to Net Profit After Tax (RC) is provided below: ($M)
Reconciliation of Statutory loss after tax to Net profit after tax (RC)
Statutory loss after tax (77.5)
Add: Net Inventory loss1 124.9
Add: Significant one-off items1,2 94.8
Add: Revaluation loss on FX and oil derivatives1 7.9
Add: Non-cash lease adjustments1 24.0
Net profit after tax (RC) 174.1
1 Results are reported net of tax.
2 Significant one-off items includes an impairment loss of $79.9M and $14.9M in acquisition costs and amortisation charges
which will not be incurred in future periods.
Group results on a HC basis are calculated in accordance with International Financial Reporting Standards (IFRS)
and shows the cost of goods sold at the actual prices paid by the business using a first in, first out (FIFO) accounting
methodology. As such, HC accounting includes gains and losses resulting from timing differences between
purchases and sales of inventory and the rise and fall of oil and product prices during that time. Gains and losses lOMoAR cPSD| 58778885
Viva Energy Group Limited and controlled entities
Financial report for the half-year ended 30 June 2023
arising from the rise and fall of oil and product prices are typically offset by a change in working capital because of
the higher or lower cost to replenish inventory. RC accounting is a non-IFRS measure under which the cost of
goods sold is calculated on the basis of theoretical new purchases of inventory instead of the historical cost of
inventory. As a result, it removes the effect of timing differences to enable users of the financial information to more
consistently assess the underlying performance of the business.
To further assist with the assessment of the underlying performance of the business, Group results on an RC basis
include lease expense and exclude lease interest and right of use amortisation. These amounts are captured in
the “Non-cash lease adjustments” line item in the above reconciliation table. Financial measures based on
replacement costs and inclusive of lease expense are identified by the use of the suffix “RC”.
Directors’ report (continued) Operating and financial review (continued)
Reporting changes implemented in 1H2023
During the reporting period, upon the completion of the Coles Express acquisition on 1 May 2023, the Group’s
strategy to expand into the Convenience sector and operate its business as three distinct ‘Convenience and
Mobility’, ‘Commercial and Industrial’ and ‘Energy and Infrastructure’ segments came into effect. At the time, the
Group formal y changed the way in which its business results are reported to the Chief Operating Decision Maker,
and accordingly has adopted the following reportable segments in the current reporting period:
Convenience & Mobility (C&M):
The key earnings stream in C&M is from an integrated network generating both convenience and fuel revenue
streams. This also includes some relatively smaller contributions from a Dealer Owned network and Shell Card.
Commercial & Industrial (C&I):
The key earnings stream in C&I is from the supply of fuels, lubricants and specialty fuel products and services to
the Marine, Aviation, Resources, Transport and Wholesale sectors.
Energy & Infrastructure (E&I):
Refining will continue to report as its own segment under the new heading of Energy & Infrastructure which in
addition to the Group’s refining activities, also captures the evolving Geelong Energy Hub operations.
Corporate: There is no change to the Corporate reportable segment.
The change in reportable segments is reflected in both current and comparative periods. lOMoAR cPSD| 58778885
Viva Energy Group Limited and controlled entities
Financial report for the half-year ended 30 June 2023
Directors’ report (continued)
Operating and financial review (continued)
1H2023 Business Performance Summary
Viva Energy delivered another strong result in the first half of 2023, despite the Refining business being impacted
by lower regional margins and major maintenance activity in the second quarter.
Sales from the Convenience & Mobility and Commercial & Industrial segments grew by 10.5% and earnings
improved by approximately 40% compared to the same period last year. The Group continues to grow market
share, and make important progress in its long term strategies to transform the businesses.
The Group has completed the acquisition and transition of Coles Express, and is working towards completing the
acquisition of the On The Run (OTR) Group (subject to regulatory approval) by the end of this year. Together these
acquisitions will see Viva Energy become one of the leading convenience retailers in the country.
The Commercial and Industrial businesses continue to deliver strong growth across all business units, but
particularly in the specialty markets where sustained and attractive long-term growth is observed. The execution
of the contract with the Australian Defence Force (ADF) during the period was a particularly significant achievement
and the Group looks forward to supporting them to achieve their goals in the years ahead.
Although the Energy and Infrastructure business was unfavourably impacted by extended major maintenance in
the second quarter, refining margins have lifted considerably over recent months as a result of tightness in
international markets, and the Group looks forward to returning to full production in September.
Continued capital discipline was maintained from a strong balance sheet to support investments and acquisitions
to deliver long term growth, and continue to return cash to shareholders in line with the dividend policy. lOMoAR cPSD| 58778885
Viva Energy Group Limited and controlled entities
Financial report for the half-year ended 30 June 2023
Directors’ report (continued)
Operating and financial review (continued)
Summary Statement of Profit and Loss lOMoAR cPSD| 58778885 30 June $M 30 June 20225 2023 Group C&M1 C&I2 E&I3 Group C&M1 C&I2 E&I3 Variance Revenue 12,722.8 4,052.6 8,670.2 - 11,516.9 3,761.5 7,755.4 - 1,205.9
Viva Energy Group Limited and controlled entities 1. Total EBITDA (RC) 361.9 119.7 227.2 15.0 611.7 85.6 161.3 364.8 (249.8)
Financial report for the half-year ended 30 June 2023
Convenience & Mobility 123.7 123.7 - - 88.6 88.6 - 35.1 Directors’
Commercial & r Ind ep
ustrial ort (continued) 231.2 - 231.2 - 164.3 164.3 - 66.9
Energy & Infrastructure 22.9 - - 22.9 370.8 - Op erati Corporate n g and financial revie (15.9) w (co (4.0) ntinu (4.0) ed) 370.8 (347.9) (7.9) (12.0) (3.0) (3.0) (6.0) (3.9)
2. Share of profit from associates 0.6 0.6 - - 1.0 1.0 - - (0.4)
Net loss on other disposal of assets (1.9) (0.5) - (1.4) 0.2 (0.1) 0.3 - (2.1)
3. Depreciation and amortisation (84.8) (21.6) (31.8) (31.4) (88.0) (24.2) (27.8) (36.0) 3.2
Profit before interest and tax (RC) 275.8 98.2 195.4 (17.8) 524.9 62.3 133.8 328.8 (249.1) 4. Net finance costs (29.5) (3.1) (24.9) (1.5) (16.6) (2.5) (11.6) (2.5) (12.9)
Profit/(loss) before tax (RC) 246.3 95.1 170.5 (19.3) 508.3 59.8 122.2 326.3 (262.0)
5. Income tax (expense)/benefit (RC) (72.2) (26.9) (51.1) 5.8 (152.9) (18.4) (36.6) (97.9) 80.7
Net profit/(loss) after tax (RC) 174.1 68.2 119.4 (13.5) 355.4 41.4 85.6 228.4 (181.3)
6. Significant one-off items 4 (94.8) 7.8 (102.6)
7. Net inventory (loss)/gain 4 (124.9) 191.2 (316.1)
8. Revaluation loss on FX and oil derivatives 4 (7.9) (3.6) (4.3)
9. Non-cash lease adjustments 4 (24.0) (29.9) 5.9
10. Net (loss)/profit after tax (HC) (77.5) 520.9 (598.3)
Statutory earnings (cents) per share (HC) (5.0) 33.7 (38.7)
Underlying earnings (cents) per share (RC) 11.3 23.0 (11.7)
1 Convenience & Mobility (C&M)
2 Commercial & Industrial (C&I) 3 Energy & Infrastructure (E&I)
4 Results are reported net of tax.
5 Comparative updated to reflect the change in reportable segments.
The table below provides a reconciliation between Profit before tax (RC) shown above and Profit before tax (HC) within
the consolidated statement of profit or loss. 30 June 30 June $M 2023 2022
Profit/(loss) before tax (RC) as above 246.3 508.3 Adjusted for: Lease expense 163.0 149.9 Right-of-use amortisation (117.2) (111.2) Lease interest expense (80.2) (81.4)
Revaluation loss on FX & oil derivatives (11.0) (5.2) Net inventory (loss)/gain (178.5) 273.1 Significant one-off items (94.8) 7.8
(Loss)/profit before tax (HC) (72.4) 741.3
Summary Statement of Profit and Loss Analysis 1. EBITDA (RC)
Convenience & Mobility (C&M) lOMoAR cPSD| 58778885
Viva Energy Group Limited and controlled entities
Financial report for the half-year ended 30 June 2023
Directors’ report (continued)
Operating and financial review (continued)
C&M EBITDA (RC) was $123.7M in 1H2023, a 40% increase on the comparative period last year. This strong
performance was supported by a favourable fuel margin environment and continued growth in fuel sales across al
channels (up 4% to 2,268 million litres).
The company-operated network (previously Coles Express) achieved weekly fuel volumes of 58 mil ion litres, up
3% on the prior period, with further growth coming from the extension of the Liberty Convenience network (now at
95 stores nationwide). Premium fuel penetration across the networks increased from 30% to 31%.
The Company made significant progress in pursuing its strategy to grow high-quality convenience earnings,
completing the Coles Express acquisition to secure ful control over more than 700 stores, and announcing the
acquisition of OTR Group. Together these acquisitions provide a pathway to become the leading convenience retailer in Australia.
Commercial & Industrial (C&I)
C&I EBITDA (RC) increased by 41% to $231.2M in 1H2023, with sales volumes up by 15% (to 5,336 mil ion litres)
led by continued recovery in International Aviation and Marine businesses and robust demand from other C&I
businesses. Specialty products and services (sales other than Diesel and Jet) bolstered earnings growth, now
comprising approximately 50% of C&I EBITDA (RC) in 1H2023.
During the period C&I further diversified its business and customer mix. It completed the small acquisition of Skyfuel
Australia, growing the regional airport presence and customer solutions offering, and signed two long-term,
strategically important contracts with the ADF and Royal Flying Doctors Service.
Energy & Infrastructure (E&I)
E&I delivered EBITDA (RC) of $22.9M in 1H2023, compared to $370.8M in the comparative period. Earnings were
impacted by lower regional refining margins and the planned major maintenance turnaround during the second
quarter, which was extended as a result of the compressor incident which occurred on 6 June 2023.
There was a reduction in crude intake and higher operating costs due to increased shipping activity to support the
major maintenance turnaround and unplanned extended outage of the Platformer and associated units.
Replacement of crude oil with additional imports of refined products also impacted profitability in the second quarter of the period.
2. Share of profit from associates
Share of profit from associates of $0.6M represents the Group’s 50% ownership of the half-year results of associate
investments in LOC Global Pty Ltd and Fuel Barges Australia Pty Ltd.
3. Depreciation and amortisation
Depreciation and amortisation for the half-year includes $73.6M of depreciation on property, plant and equipment,
$9.8M of amortisation expense on intangible assets and $1.4M on leases classified as finance leases. Total
depreciation and amortisation of $84.8M decreased by $3.2M compared to the prior comparative period, primarily
driven by the Coles Express intangible write-off upon acquisition. Amortisation of right-of-use assets is captured in
‘Non-cash lease adjustments’.
Summary Statement of Profit and Loss Analysis (continued) 4. Net finance costs
Net finance costs of $29.5M were $12.9M higher than the prior comparative period and consisted of interest income,
interest expense on borrowings, amortised transaction costs and fees associated with trade finance instruments of lOMoAR cPSD| 58778885
Viva Energy Group Limited and controlled entities
Financial report for the half-year ended 30 June 2023
Directors’ report (continued)
Operating and financial review (continued)
$28.9M, finance costs associated with leases classified as finance leases prior to the adoption of AASB 16 Leases
of $4.1M, net of $3.5M from the unwinding of discounted balance sheet provisions.
The increase in net finance costs is due primarily to higher borrowings and increases in market interest rates. 5. Income tax expense
While the income tax expense for the period on an RC accounting basis is $72.2M, representing an effective tax
rate of 29.3%, the Group is subject to income tax on the basis of HC earnings rather than RC earnings. The income
tax expense for the period on a HC basis is $5.1M. Even though the Group incurred a loss on an HC accounting
basis, the group recognised a tax expense due to the non-deductibility of the impairment of the Coles Express
related intangible and stamp duty costs within the $94.8M significant one-off items during the period.
6. Significant one-off items (net of tax)
The current period significant items totalling $94.8M comprises a $79.9M impairment loss resulting from the writeoff
of an intangible asset following the acquisition of Coles Express, as well as $14.9M in acquisition costs and
amortisation charges in C&M which will not be incurred in future periods.
7. Net inventory (loss)/gain
The net inventory loss relates to the effect of movements in crude and refined product prices and foreign exchange
on inventory recorded at HC using the FIFO principle of accounting. The loss of $124.9M (net of tax) reflects
decreasing oil prices experienced during 1H2023 and the impact of foreign exchange movements.
8. Revaluation loss on FX and oil derivatives
Revaluation loss on foreign exchange (FX) and oil derivatives is impacted by realised and unrealised FX and
associated hedges, flat oil price hedges and refinery margin hedging. During the period, a loss of $7.9M (net of tax)
was recognised due to the actual net FX loss outweighing the gains on derivative contract positions caused by
fluctuating FX rates and decreasing crude and refined product prices over the period.
9. Non-cash lease adjustments
The non-cash lease adjustments reflects the elimination of lease expenses recorded in EBITDA (RC) and the recognition
of lease interest and right-of-use amortisation.
10. Net profit after tax (HC)
A net loss after tax (HC) of $77.5M for the period was a decrease from the comparative $520.9M profit after tax
(HC) in 1H2022. The loss in the current period is a result of weakening refining margins and unfavourable oil price
and FX movements, along with significant one-off expenses resulting from acquisitions.
Summary Statement of Financial Position Variance 30 June 31 December $M 2023 2022 lOMoAR cPSD| 58778885
Viva Energy Group Limited and controlled entities
Financial report for the half-year ended 30 June 2023
Directors’ report (continued)
Operating and financial review (continued) 1. Working capital 32.6 41.3 (8.7)
2. Property, plant and equipment 1,919.3 1,645.7 273.6
3. Right-of-use assets 2,067.5 2,088.4 (20.9) 4. Intangible assets 542.8 599.6 (56.8)
5. Investment in associates 16.3 15.7 0.6 6. Net (debt)/cash (274.2) 290.5 (564.7) 7. Lease liability (2,480.2) (2,456.5) (23.7)
8. Long-term provisions, other assets and liabilities (75.5) (179.8) 104.3
9. Net deferred tax asset 310.6 315.9 (5.3)
10. Total equity 2,059.2 2,360.8 (301.6)
Summary Statement of Financial Position Analysis 1. Working capital
Working capital decreased by $8.7M, primarily as a result of a significant decrease in trade and other receivables
over the period driven by the timing of payments on receivable balances, partially offset by movement in current tax balances.
2. Property, plant and equipment (PP&E)
Property, plant and equipment (PP&E) relates to freehold terminal property, leasehold retail and terminal
improvements, plant and infrastructure such as tanks and pipelines held at terminals, airports and retail sites and
the Geelong Refinery land and equipment.
PP&E increased by $273.6M in 1H2023, driven by capital expenditure over the period of $222.0M and further PP&E
additions through business acquisitions of $120.8M, asset transfers in of $2.7M and non-cash additions to the asset
retirement obligation cost base totalling $2.1M, partial y offset by depreciation of $73.6M and net disposals of $0.4M during the period.
A breakdown of capital expenditure by segment is outlined below. $M 30 June 2023 30 June 2022 Variance
a. Convenience & Mobility 14.3 16.5 (2.2)
b. Commercial & Industrial 25.8 19.1 6.7
c. Energy & Infrastructure Base expenditure 22.5 13.3 9.2 Major maintenance 86.8 6.8 80.0 Energy Hub 72.6 35.2 37.4 Capital expenditure 222.0 90.9 131.1 a.
Convenience & Mobility
Convenience & Mobility capital expenditure of $14.3M for the period (1H2022: $16.5M) includes network growth
spend, new site branding and refreshing of network convenience stores and forecourts, together with tank and
pump replacements, tank relines and other asset integrity works. b.
Commercial & Industrial
During the period $25.8M (1H2022: $19.1M) of Commercial & Industrial’s capital expenditure related to works to
ensure the integrity of the Group’s terminals, pipelines, depots and aviation assets, along with commercial growth
opportunities and branding of dealer-owned sites within the Wholesale network.
Summary Statement of Financial Position Analysis (continued) lOMoAR cPSD| 58778885
Viva Energy Group Limited and controlled entities
Financial report for the half-year ended 30 June 2023
Directors’ report (continued)
Operating and financial review (continued)
2. Property, plant and equipment (PP&E) (continued)
c. Energy & Infrastructure Base expenditure
Base capital expenditures during the period of $22.5M (1H2022: $13.3M) primarily related to spend on the
cyclical tank maintenance program, the Distributed Controls System upgrade, Field Centre relocation costs
and on the Gas Separation Unit column & exchanger replacement. Major maintenance
Major maintenance capital expenditure of $86.8M during the period (1H2022: $6.8M) primarily relates to the Crude
Distil ation Unit Turnaround event. Energy Hub
Energy Hub expenditure during the period of $72.6M (1H2022: $35.2M) related to progress works on the
Ultra-Low Sulphur Gasoline Project, advancing the Gas Terminal Project, reaching the first milestone on the
Hydrogen Refuelling Station and progressing the diesel Strategic Storage Facility. 3. Right-of-use assets
The right-of-use assets balance at period end was $2,067.5M, a decrease of $20.9M from FY2022. Impacting this
balance during the period was right-of-use depreciation of $118.7M and lease terminations, reclassifications and
derecognitions of $2.4M, with these decreases partially offset by new leases through business acquisitions of
$65.8M and extensions, other new leases and lease reassessments totalling $34.4M. 4. Intangible assets
Intangible assets decreased by $56.8M during the year primarily due to the write off of the $79.9M reacquired rights
intangible as a result of the Coles Express acquisition and amortisation charges of $14.3M, partially offset by
$32.6M in goodwill recognised on acquisitions, and $4.8M of other software capitalisations.
5. Investment in associates
This balance relates to the Group’s 50% ownership of LOC Global Pty Ltd and Fuel Barges Australia Pty Ltd. Associate
company profit of $0.6M was recognised during the period. 6. Net (debt)/cash
Net (debt)/cash relates to Viva Energy’s syndicated Revolving Credit Facility (RCF) which is used as a working
capital facility to fund fluctuations in working capital, net of cash at bank. Viva Energy does not hold any long term
structural debt, with business acquisitions in 2023 funded by its own cash resources. The Group’s current net debt
position of $274.2M comprises $477.1M in working capital borrowings, partially offset by a cash balance of $202.9M. 7. Lease liability
The lease liability balance at 30 June 2023 was $2,480.2M, an increase of $23.7M over the six month period, with
new lease liabilities from business acquisitions of $65.8M and other increases though new leases, lease extensions
and lease escalations of $37.3M, offset by payments of lease principal balances totalling $78.9M made during the
period and terminations of $0.5M. lOMoAR cPSD| 58778885
Viva Energy Group Limited and controlled entities
Financial report for the half-year ended 30 June 2023
Directors’ report (continued)
Operating and financial review (continued)
Summary Statement of Financial Position Analysis (continued)
8. Long term provisions, other assets and liabilities
The decrease in the net liability of $104.3M during the period primarily represents the settlement of the $100.0M long
term payable to Coles as part of the Coles Express acquisition.
9. Net deferred tax asset
The net deferred tax asset relates to the tax-effected difference between the carrying value of assets and liabilities
recorded for accounting purposes, and those recorded for tax purposes.
The $5.3M decrease in net deferred tax assets was primarily driven by the utilisation of a tax benefit through the
immediate deduction of the turnaround expenditure incurred during the period, which is depreciable for accounting
purposes over the longer period between turnarounds. This was partially offset by the deferred tax asset recognised
upon acquisition of the Coles Express Retail business. 10. Total equity
Total equity decreased by $301.6M due to the recognition of a net loss after tax of $77.5M, the payment of $205.8M
in dividends (net of dividends paid on treasury shares), equity reductions through share buy-back program activities
($17.3M) and the Group’s share-based incentive plans ($4.1M) as well as a $0.2M decrease from OCI movements,
partially offset by the net impact of treasury shares issued and purchased of $3.3M. lOMoAR cPSD| 58778885
Viva Energy Group Limited and controlled entities
Financial report for the half-year ended 30 June 2023
Directors’ report (continued)
Operating and financial review (continued)
Summary Statement of Cash Flows lOMoAR cPSD| 58778885 Variance 30 June 30 June $M 2023 2022
Profit before interest, tax, depreciation and amortisation (HC) 243.7 1,038.3 (794.6)
Decrease/(increase) in trade and other receivables Viva Energy Group Lim 2 ite 23.d 8 a nd c(on 84 tro 6.3)ll ed enti 1, ti 07 e 0 s . 1
Decrease/(increase) in inventories
Financial report for the half-y 3 ea 1.2 r end (1ed ,06 30 0.3) J une 2 1, 02 091 3 .5
Decrease in other assets 10.4 38.6 (28.2) D irecto
Increas re s’
in t rraep
de anod rotth e(r co pay n abl ti es n ued) 0.1 1,565.5 (1,565.4)
Decrease in provisions (18.0) (15.2) (2.8) Op 1. C er han at ges i n in g wo ran king d ca pfi ita n
l ancial review (continued) 247.5 (317.7) 565.2
2. Non-cash items in profit before interest, tax, depreciation and amortisation 94.1 33.2 60.9
3. Payment for treasury shares (net of contributions) (6.2) (2.8) (3.4)
Repayment of lease liabilities (78.9) (65.3) (13.6)
Interest on capitalised leases (84.2) (85.4) 1.2
Operating free cash flow before capital expenditure 416.0 600.3 (184.3)
Payments for PP&E and intangibles (222.0) (90.9) (131.1)
Proceeds from sale of PP&E 0.7 0.6 0.1
Payments for other investments (7.0) - (7.0)
4. Payments for business acquisitions (325.7) (18.0) (307.7)
5. Government grant receipts 15.3 25.3 (10.0)
Net free cash flow before financing, tax and dividends (122.7) 517.3 (640.0) 6. Finance costs (20.9) (8.8) (12.1)
7. Net income tax payments (200.9) (38.9) (162.0)
Net cash flow available for dividends and before borrowings (344.5) 469.6 (814.1) 8. Dividends paid (205.8) (49.5) (156.3) 9. Share buy back (17.3) - (17.3)
10. Net drawings/(repayments) of borrowings and upfront fees 480.0 (197.0) 677.0 Net cash flow (87.6) 223.1 (310.7)
Opening net cash/(debt) 290.5 (95.2) 385.7
Movement in capitalised borrowing costs 2.9 (0.8) 3.7
Closing net (debt)/cash (274.2) 324.1 (598.3) Change in net debt (564.7) 419.3 (984.0)
Summary Statement of Cash Flows analysis
1. Changes in working capital
Trade and other receivables have decreased significantly over the period, driven by the timing of payments on receivable
balances. Changes in working capital excludes non-cash related movements. 2. Non-cash items
Non-cash items add back of $94.1M comprises impairment expense of $79.9M, unrealised foreign exchange losses
of $40.7M, $5.3M in share based payments and a $1.9M net loss on disposal of property, plant and equipment,
partially offset by $32.4M in unrealised gains on derivatives, $0.6M from the share of profits in associates, $0.4M
in gains from early lease terminations and $0.3M in other minor items. lOMoAR cPSD| 58778885
Viva Energy Group Limited and controlled entities
Financial report for the half-year ended 30 June 2023
Directors’ report (continued)
Operating and financial review (continued)
Summary Statement of Cash Flows Analysis (continued)
3. Payment for treasury shares
During the period 2,000,000 shares were purchased at an average price of $3.10 per share totalling $6.2M.
4. Payments for business acquisitions
The $325.7M net cash outflow from the acquisition of investments represents cash consideration of $223.9M,
$100.0M to settle the existing fuel stock payable, less $22.8M in cash and cash equivalents in the books of Coles
Express when acquired, as well as $24.6M in net cash paid for other minor acquisitions.
5. Government grant receipts
During the period the Group received government grants total ing $15.3M to fund the Strategic Storage Facility and
New Energies Service Station projects. 6. Finance costs
Financing cost cash outflows have increased by $12.1M primarily due to a $14.0M increase in market interest rates
for trade finance instruments period on period. Higher borrowings during the period and higher market interest rates
also increased finance costs by $4.1M, however favourable cash balances for much of the period partially offset
the costs of finance, with a $6.0M increase in interest income.
7. Net income tax payments
The net income tax payments of $200.9M for the year represent tax payments of $135.7M paid by the Group to the
ATO in relation to the 2022 financial year, $62.7M in PAYG tax instalments in relation to the current period and tax
payments of $2.5M by the Group on behalf of its Singapore tax resident entity (Viva Energy S.G. Pte Ltd) to the Singapore tax authority. 8. Dividends paid
During the period the Company paid a final 2022 dividend of 13.3 cents per share ($206.1M) in relation to the
sixmonths ended 31 December 2022. Included in the $206.1M dividends was $0.3M in dividends payable to
treasury shares on hand, with the net cash impact totalling $205.8M. 9. Share buy back
The Company completed its previously announced buy-back program in 1H2023, purchasing 5,473,468 shares on-
market at an average price of $3.15 for the 1H2023 purchases.
10. Net drawings/(repayment) of borrowings and upfront fees
The Group had net drawings of $480.0M through its syndicated working capital facility over the period to manage
short term working capital requirements. Business acquisitions during the period were funded by the Group’s own cash reserves. lOMoAR cPSD| 58778885
Viva Energy Group Limited and controlled entities
Financial report for the half-year ended 30 June 2023
Directors’ report (continued) Dividends
The Company paid a final dividend of $206.1M (13.3 cents per share) to shareholders on 24 March 2023 in relation
to the six month period ended 31 December 2022.
A fully-franked interim dividend of 8.5 cents per share was determined by the Board on 22 August 2023, payable to
shareholders on 20 September 2023. This dividend has not been included as a liability in these interim financial
statements. The total estimated dividend to be paid is $131.3M.
Events occurring after the end of the reporting period
There are no matters or circumstances occurring subsequent to the end of the reporting period that have
significantly affected, or may significantly affect, the operations of the Group, the results of those operations, or the
state of affairs of the Group in future financial periods.
Auditor’s independence declaration
A copy of the Auditor’s Independence Declaration as required under section 307C of the Corporations Act 2001
( Cth ) is included on page 17. Rounding of amounts
The Company is of a kind referred to in ASIC Legislative Instrument 2016/191, relating to the ‘rounding off’ of
amounts in the Directors’ report and financial report. Amounts in the Directors’ report and financial report have been
rounded off to the nearest one hundred thousand dollars ($100,000) in accordance with the instrument, unless stated otherwise.
This report is made in accordance with a resolution of Directors. Scott Wyatt Robert Hill CEO and Managing Director Chairman 22 August 2023 lOMoAR cPSD| 58778885
Auditor’s Independence Declaration
As lead auditor for the review of Viva Energy Group Limited for the half-year ended 30 June 2023, I
declare that to the best of my knowledge and belief, there have been:
(a) no contraventions of the auditor independence requirements of the Corporations Act 2001 in relation to the review; and
(b) no contraventions of any applicable code of professional conduct in relation to the review.
This declaration is in respect of Viva Energy Group Limited and the entities it controlled during the period. Trevor Johnston Melbourne Partner 22 August 2023 PricewaterhouseCoopers
PricewaterhouseCoopers, ABN 52 780 433 757 lOMoAR cPSD| 58778885
2 Riverside Quay, SOUTHBANK VIC 3006, GPO Box 1331, MELBOURNE VIC 3001
T: 61 3 8603 1000, F: 61 3 8603 1999, www.pwc.com.au
Tài liệu liên quan:
-
Quy trình Nghiên cứu 8 Bước: Hướng dẫn & Yêu cầu lý thuyết
18 9 -
BÁO CÁO THỰC HÀNH 1: PT DAEHAN GLOBAL YÊN DŨNG - QT29C
24 12 -

Phân biệt các loại thang đo trong nghiên cứu (Tài liệu)
26 13 -

Ktct: Phân Tích Khối Lượng Giá Trị Thặng Dư M Trong Sản Xuất
25 13 -

Kiểm định mối liên hệ giữa các biến định tính và các yếu tố xã hội
160 80