Case Study -Tyre - Tài liệu tham khảo | Đại học Hoa Sen
Case Study -Tyre - Tài liệu tham khảo | Đại học Hoa Sen và thông tin bổ ích giúp sinh viên tham khảo, ôn luyện và phục vụ nhu cầu học tập của mình cụ thể là có định hướng, ôn tập, nắm vững kiến thức môn học và làm bài tốt trong những bài kiểm tra, bài tiểu luận, bài tập kết thúc học phần, từ đó học tập tốt và có kết quả cao cũng như có thể vận dụng tốt những kiến thức mình đã học.
Môn: Human resource management 103 tài liệu
Trường: Trường Đại học Hoa Sen 5.3 K tài liệu
Tác giả:


Preview text:
_______________________ Tyre Maharajahs Case Study _______________________
TYRE MAHARAJAHS AGAINST CHINESE EXPORTERS
AND TYRE GLOBAL MAKERS.
THE STRUGGLE FOR LEADERSHIP IN THE INDIAN TYRE INDUSTRY
The Tyre Industry in India: Growth, Trends and Technologies
“The Indian tyre industry is emerging as a
Even for large Indian companies that have
force to reckon within the global tyre
expanded their operations abroad, they
manufacturing ecosystem […]. The industry
remain greatly dependent on the Indian
has undergone a metamorphosis of sorts in
market for their turnover, growth and
the last few years and has received global
profitability. Their home country remains
recognition too […]. As a fast developing
their so-called “cash cow” market.
nation, being the fastest growing economy in
Among these uncertainties and risks looming
the world, India offers immense potential for
over the Indian tyre industry, we can first
the growth of the tyre industry”(Anant
highlight the variations in the raw material
Goenka’s interview, CEO of CEAT and
prices. Tyre inputs, such as natural and
Chairman of the Indian Automotive Tyre
synthetic rubber and crude oil, have become Manufacturers’ Association - ATMA)1.
more expensive due to their cyclical price
Indeed, in a 10-year period, the Indian tyre
increase, the depreciation of the Rupee and
production has increased from 80 to 180
the 25% customs duty imposed on imports by
million units; in the meantime, Indian tyre
the Indian government5. Moreover, some tyre
companies have thrived investing heavily
manufacturing facilities cannot operate at
abroad and exporting annually Rs. 100,000
full scale as they are short of supply due to
million (US$ 1.5 billion). As a result, four
bad crop of natural rubber in India6.
Indian tyre companies are ranked among the
top 30 global tyre makers by turnover2. For
Second, the Indian tyre industry is
the coming years, India’s GDP is predicted to
confronted with tough competition from
grow at a pace of 7.4%, ahead of other
imported Chinese tyres, which are on
emerging economies. It would surpass China
average 50% cheaper than domestic
by 1% while other BRICS economies would
products7. The Indian government has
stick to growth rate ranging from 1 to 2%3. In
recurrently imposed some tariff and non-
the automotive industry, the Society of
tariff barriers to imported tyres with the aim
Indian Automotive Manufacturers (SIAM)
to reducing the attractiveness of low-cost
expects that the production will increase by
foreign products, such as in September 2017
3.5 to 4 times from 2016 to 20264. Boosted
and September 20188. But these measures
by this strong momentum, the tyre industry
have only partly deterred price-sensitive
plans on growing from Rs. 550,000 (US$ 8
Indian customers from buying imported
billion) to 2,000,000 million (US$ 30 products. billion).
Third, a series of Indian government
Although India will experience high or
initiatives have been launched with mixed
hyper-growth, uncertainties and risks will
and unforeseeable consequences. In July
also rise in such a fast pace that tyre
2017, the Indian government enforced a
companies could see their return on
consumption tax known as the GST (Goods
investment dented and their growth thwarted.
and Services Tax). This tax enforcement has
This case study was written by Dr. Alexandre Bohas (Professor at ESSCA Business School) and Dr. Pierre-Xavier
Meschi (Professor at IAE, Aix-Marseille Université). It is intended as an illustration to be used in class discussions.
The authors gratefully acknowledge Michelin’s irreplaceable cooperation in providing them complete access to world
tyre industry data. They wish to thank in particular: Thierry Anglade (Michelin’s Corporate Development & Progress
manager) and Frédéric-Patrice Vincent (Michelin’s Vice-President Strategy & Development).
_________________________________ 1 _________________________________
_______________________ Tyre Maharajahs Case Study _______________________
made it harder for low-cost imported tyres to
Fourth, recent rising protectionism from the
enter the domestic market. These imported
US government under the initiative of
tyres can no longer circumvent GST by
President Donald Trump threatens the Indian
making cash deals. Along the same lines, the
tyre industry: (i) directly, with the
demonetization regulation, which led to
enforcement of anti-dumping measures
withdrawal of Rs. 500 and 1,000 bank notes,
against tyre imports from emerging
has also caused a drop in massive imports by
economies, including India. These measures
diminishing excessive cash in the economic
represent a major threat, as the US is the first
system9. All these government measures
export country for Indian tyre makers
have triggered destocking behavior from tyre
(especially, for JK Tyre, the third largest tyre
dealers and garages. Besides, environmental
maker in India). (ii) Indirectly, with the trade
and sustainable development concerns have
war currently occurring between the US and
raised pressures to curb air pollution. Since
China. This war could have adverse side
2000, Bharat Stage (BS) emission standards,
effects for Indian tyre makers since a
inspired from European “Euro” regulations,
decrease in Chinese tyres exports to the US
have been progressively imposed on all
would mean an additional flow of discounted
motor vehicles. The BS-IV grade was
Chinese tyres diverted to India.
enforced for the whole country since April All these headwinds increase the
2017. Faced with increased air pollution, the
uncertainties and risks for the Indian tyre
Indian government has decided to skip BS-V
makers, which explain the sharp decrease in
and looked forward to implementing BS-VI
stock prices for leading players such as
in the short term10. The acceleration in
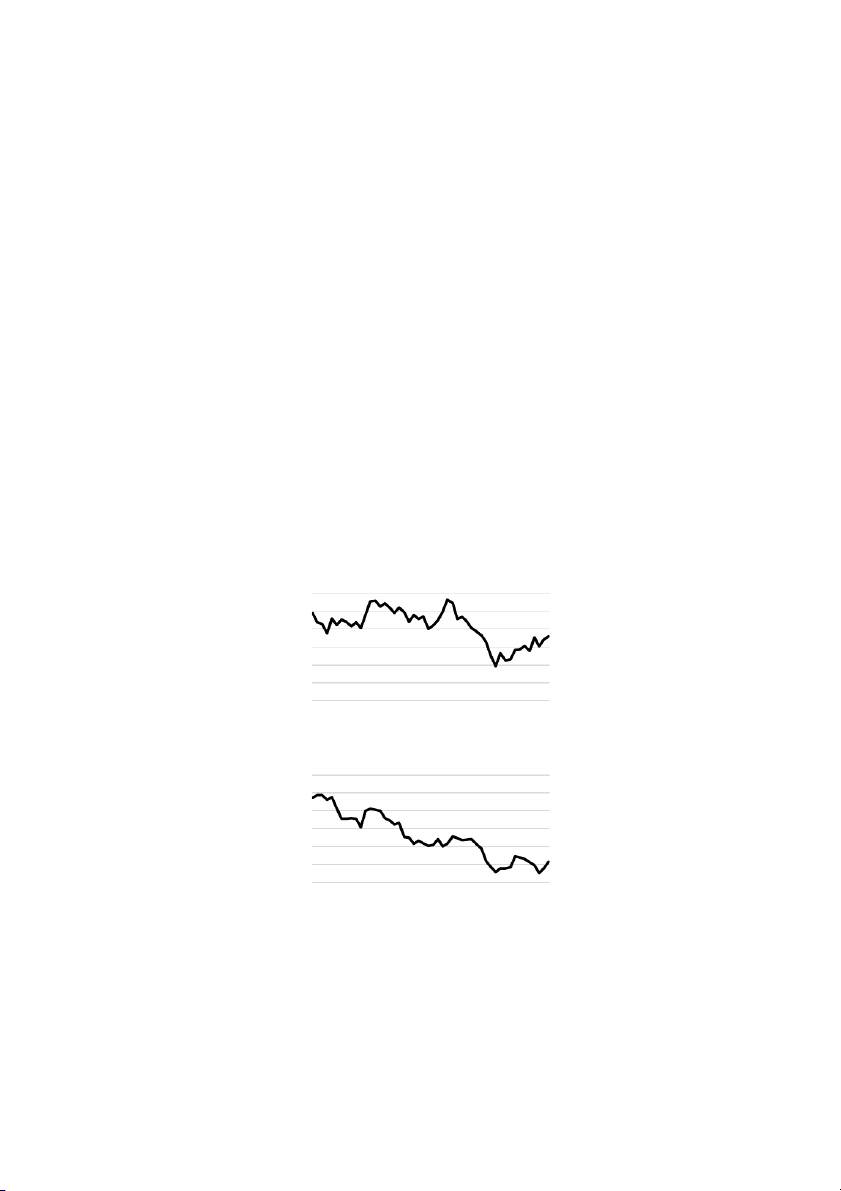
Apollo Tyres and JK Tyre (see Figure 1) and,
enforcing environmental norms comes along
to a lesser extent, MRF, in 2018.
with the increase in the price of cars and gas.
Figure 1 – Stock Market Price Variations in 2018 (in Rs., Apollo Tyres and JK Tyre) 300 275 250 225 200 175 Apollo Tyres 150 8 8 8 8 8 8 8 8 8 8 8 8 -1 -1 -1 l-1 -1 -1 -1 ar-1 r-1 p n g ct-1 v ec-1 Jan eb ay-1 u ep o F Ju M A M Ju A S O N D 200 180 160 140 120 100 JK Tyre 80 8 8 8 8 8 8 8 8 8 8 8 8 -1 -1 -1 -1 -1 -1 ar-1 r-1 l-1 p n g ct-1 v Jan eb ay-1 u ep o ec-1 F M A Ju M Ju A S O N D
Source: stock market prices for Apollo Tyres and JK Tyre are
available on the website: https://in.finance.yahoo.com/quote,
accessed on December 20, 2018.
_________________________________ 2 _________________________________
_______________________ Tyre Maharajahs Case Study _______________________
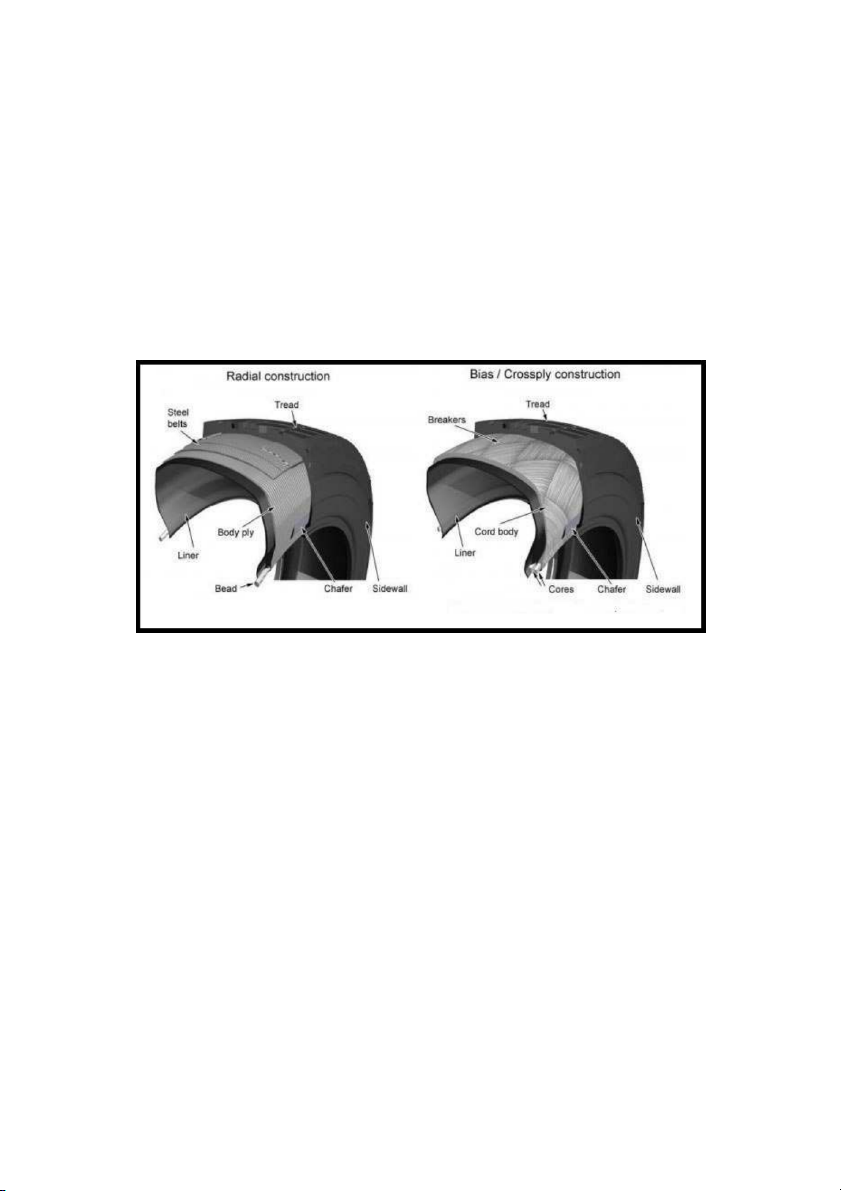
As regards technologies used for making
textile and metal steel cords are braided
tyres, one can distinguish two types,
radially or at 90° (see Figure 2). The radial
corresponding to the tyre body construction
tyre has gradually imposed itself in
and the combination of textile and metal steel
developed countries with the increased
cords (see Figure 2), namely, “diagonal” or
performance of cars and trucks. With soft
cross-ply technology, and “radial” or radial-
sidewalls, the radial tyre has better adhesion
ply technology. In the cross-ply technology
and greater resistance to torsion than the
(created in 1950), the textile and metal steel
cross-ply one. The imprint of the tyre is
cords are braided diagonally on the external
wider and the pressure is more equally
surface of the tyre. In the radial technology
distributed over the crowns of the tyre, which
(patented on June 4, 1946 by Michelin), the insure better tread wear.
Figure 1 – Radial and Cross-Ply (“Diagonal”) Tyre Technologies
Source: https://otrwheel.com/otr-blog/radial-vs-bias-need-know/ (accessed on December 17, 2018).
In India, 65% of tyre sales are cross-ply (or
the passenger vehicle tyre segment (see
“diagonal”). This situation is explained by Table 1).
different factors inherent to Indian road
A later-than-expected and steady process of
infrastructures and consumer behaviour,
“radialization” has taken place for a few
which can observed in most emerging
years. Road infrastructures have improved
economies: the very unequal quality of the
and cheap radial tyre imports from China
road infrastructure, the tendency to overload
have explained the switch to radial tyre, in
vehicles and the cheaper buying-in price of
particular in M&HCV tyres. In this segment,
cross-ply tyres. Moreover, in rough
between 2008 and 2018, the ratio of radial
conditions where tyre is easily punctured, the
tyres in the market has risen from 4 to 45%
cross-ply tyre can have longer life-time than
(see Table 1). Another reason is that radial
radial tyre although, by mileage’s standards,
tyres have a lower rolling resistance than
the latter lasts longer. However, cross-ply
cross-ply tyres in a country where air
tyre has poor road-holding at high speed and,
pollution has become an important concern
when it is subjected to high torsion, there are
among public authorities. Due to its
strong risks of it coming off the rim or
construction specificities, the crown and
blowing out. These various factors explain
sidewalls of radial tyres can be composed
that cross-ply tyres still represent the
differently, which brings about better
majority sales in most segments, excluding
performance in rolling-resistance.
_________________________________ 3 _________________________________
_______________________ Tyre Maharajahs Case Study _______________________
In the other tyre segments, the “radialization”
two- and three-wheeler tyre segment (see
process is more contrasted. The market
Table 1). This can be related to the
transformation in favor of radial technology
customer’s price sensitiveness and the
is almost achieved in the passenger car tyre difference in tyre use.
segment while it has almost not started in the
Table 1 – Tyre Market “Radialization” in India
Radial tyre market share (in volume) 1995 2008 2018 Passenger vehicle 28% 95% 98%
Light commercial vehicle (LCV) 9% 12% 40%
Medium & high commercial vehicle (M&HCV) 1% 4% 45%
Two- and three-wheeler (motorcycle, scooter and “tuk-tuk”) 0% 0% 1.5%
Source: (i) Michelin in the Land of the Maharajahs (A): Note on the Tire Industry in India (Case Study, Ivey
Publishing, Ivey Business School, 9B07M030). (ii) ATMA (2017b) ATMA Review. Indian Automobile Industry,
FY2016-17 (Apr-Dec), ATMA Periodicals (http://www.mohitnarang.in/atma/wp-content/uploads/2018/03/Atma-
Periodicals_17-4-17.pdf, accessed on December 6, 2018). (iii) FY2018 Apollo Tyres’ annual reports
(https://corporate.apollotyres.com/en-in/investors/financial-reporting/, accessed on December 1, 2018).
The Tyre Industry in India: Markets and Products
New tyre distribution corresponds to three
better tyre mileage and improved road
main channels in India. First, tyres are
infrastructure. It is also much more uncertain
directly sold to carmakers through a
since it annually varies according to tyre
business-to-business channel, also known as imports.
OEM (Original Equipment Manufacturers)
The OEM market consists of the major
(see Figure 3). Second, the replacement
Indian and non-Indian carmakers. The main
market takes place once the tyres get worn-
tyre buyers are presented below:
out or punctured. It consists of garages and
tyre dealers, including small retailers and
In the passenger vehicle market,
large distribution networks. Third, tyres
Maruti Suzuki (Maruti Udyog group) is
produced by the Indian tyre industry are
India’s oldest and largest carmaker. Owned
exported abroad. In 2018, unit sales are
by the Japanese Suzuki and the Indian
broken down across these three markets as
State, it detains a 47% share of the
follows: 43% for OEM market, 51% for
passenger vehicle market13. Although it has
replacement market and 6% for export
lost some market share since 2005 (51%), it
market11. This sales breakdown is distinct
remains the dominant player with 1.3
from that observed worldwide: 25-30% for
million cars sold in 2016. Its closest
OEM market and 70-75% the replacement
competitor is Hyundai whose market share
market. This is specific to emerging is only 17%.
economies where the level of household
In the commercial vehicle market,
equipment, still low, is booming by high
Tata Motors (Tata group) is the market
growth. It is worth mentioning that
leader with a 55% market share14. It started
penetration of passenger vehicles is below 20
to build cars in 1954 in partnership with
per 1,000 people in India compared to 786 in
Daimler Benz. Its closest competitor is
the US12. But, in value, the market is skewed
Ashok Leyland with a 31% market share.
toward the replacement segments which
While Tata Motors has balanced sales
account for 70% of total sales. In the coming
across the commercial vehicle market,
years, the considerable OEM distribution
Ashok Leyland is more focused on
channel will not only maintain but may
commercial vehicles ranging from 12 to
strengthen its position since it is nurtured by 16.2 tons.
the structural growth of customer’s original
As regards two- and three-wheelers,
equipment. The replacement market for the
the segment is highly concentrated around
tyre industry is much less dynamic due to
the following players: Hero Moto (32%),
_________________________________ 4 _________________________________
_______________________ Tyre Maharajahs Case Study _______________________
Honda (24%), Bajaj (18%) and TVS
and tyre dealers. Some are exclusive
(14%)15. It is worth noting that these
(franchised or not) distributors, while others
companies have crossed the 20 million unit
are multi-brand. The trend is towards vertical
sales in 201816 . Among them, the Hero
integration of distribution and development
Moto, formerly linked with Honda until
of online distribution by tyre makers. This is
2010, is the world largest two-wheeler
notably the case for JK Tyre, with the maker.
development of “JK Tyre Steel Wheels,” and
As regards tractors and agriculture
for CEAT, with “CEAT Shoppes.” In the
vehicles, OEM in India forms the world’s
replacement market, the price of tyres is a
largest industry in this domain. It is
priority purchase criterion for customers,
dominated by Mahindra Motors with more
particularly for those who have a motorcycle,
than a quarter of market share, TAFE
a scooter or a three-wheeler (“tuk-tuk”).
(19%), which produces and sells under its
At the other end of this capital-intensive
brand name and Massey Ferguson brand,
industry, 60 to 65% of sales are devoted on
and Swaraj (16%), part of Mahindra group
average to raw material cost (or input cost) since 200717. whereas SG&A (sales, general &
Various foreign carmakers such as
administration) and personnel cost amounts
Toyota, Ford and Nissan have entered the
to 13 to 26% of sales (see Figure 5).
Indian automotive industry to reach the
Nevertheless, these average input costs can
consumer markets but also as a basis for
hide wide differences across Indian tyre
export in Asia. Nissan dedicates 73% of its makers (see following section on
vehicles manufactured in India to export;
competitors). In addition, as illustrated in
Ford 58%. In stark contrast, the Indian
Figure 5, the price of raw materials tends to
commercial vehicle industry exports 10%
cyclically change according to stock
of its production while 19% of passenger
speculations, political contexts but also
vehicle production is exported.
economic dynamics linked to each raw
As their major customers are heavily
material industry. In addition to this, Indian
concentrated in competitive segments, these
companies are faced with specific issues of
OEMs have obtained large price cuts from
import tax on raw materials from the Indian
suppliers such as tyre companies while these
government. Consequently, the major
latter have been unable to pass on higher raw
challenge for this industry is to reach
material prices, fearing market share losses.
profitability despite the ups-and-downs of
the supply market and its dependence on
As regards the replacement market, it large customers.
consists of thousands of independent garages
_________________________________ 5 _________________________________
_______________________ Tyre Maharajahs Case Study _______________________
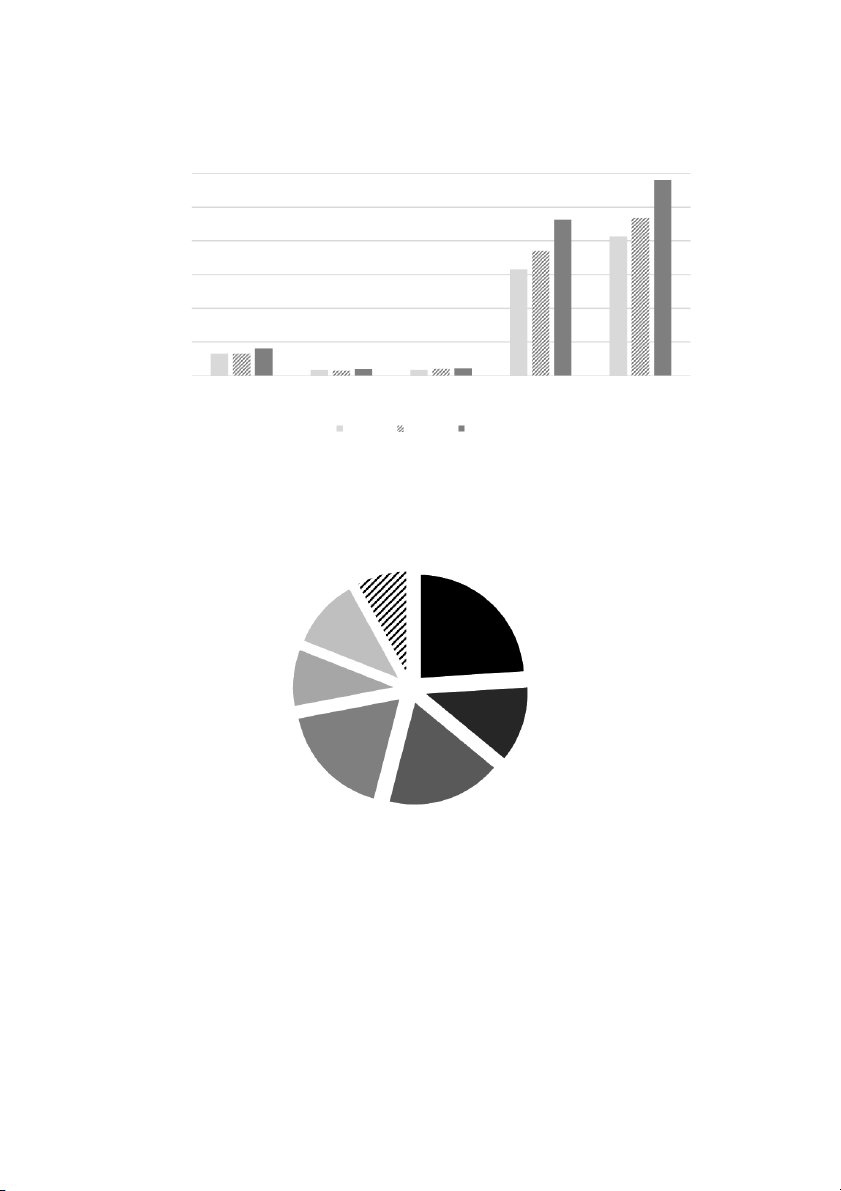
Figure 3 – Vehicle Production in India (2013-2018) 30 25 20 its n u n 15 illio M 10 5 0 Passenger vehicles Commercial Three wheelers Two wheelers Grand total vehicles 2012-13 2014-15 2017-18
Source: Society of Indian Automobiles Manufacturers (SIAM), 2018
(http://www.siamindia.com/uploads/filemanager/47AUTOMOTIVEMISSIONPLAN.pdf, accessed on December 3, 2018).
Figure 4 – Tyre Cost Structure in India Margin and depreciation 9-22% Natural rubber cost Personnel cost 23-26% 7-14% SG&A cost 6-12% Synthetic rubber cost 10-13% Other raw material costs 16-20% Other crude derivative cost 16-20%
Source: Alphà Invesco, Understanding the Indian tyre industry, key players and the road ahead, 2018
(https://www.alphainvesco.com/blog/understanding-the-indian-tyre-industry/, accessed on December 16, 2018).
As Indian customers are highly price-
Apollo Tyres and CEAT) have tried to team
sensitive, they are attracted by tyres imported
up with Chinese tyre makers in order to
at low prices from China. These imported
jointly produce radial tyres and match the
tyres have an average price that is 30% lower
lower-priced imported Chinese tyres.
than tyres sold by Indian companies.
Tyre exports have reached Rs. 100 million in
Besides, some Indian companies (JK Tyre,
2017. Recording a 20% increase, the US has
_________________________________ 6 _________________________________
_______________________ Tyre Maharajahs Case Study _______________________
emerged as the biggest market for Indian
companies are also present in other emerging
tyres exports. The US market has imported
economies in Latin America, South-East
28 million tyres from India, accounting for
Asia, the Middle East and Africa.
15% of all Indian exports18. Indian tyre
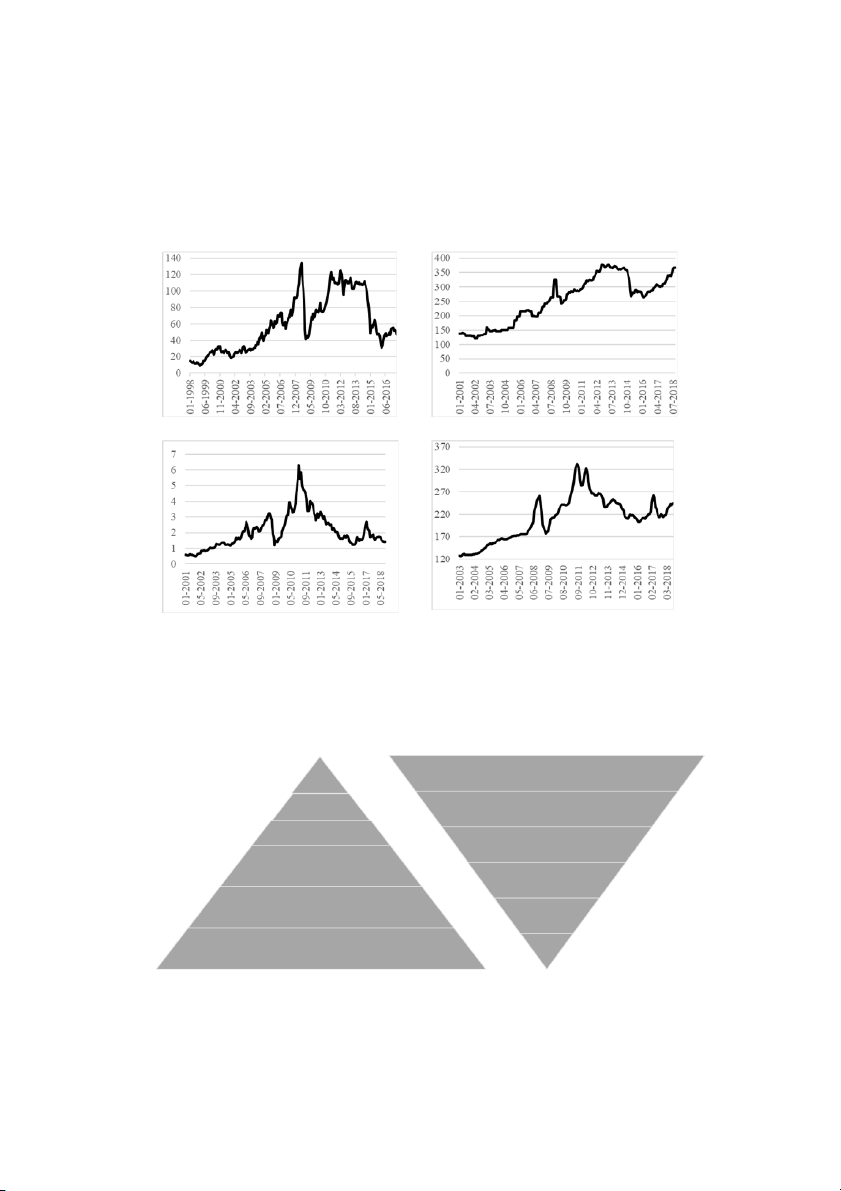
Figure 5 – Variations in Input Costs
(Brent Crude Oil, Carbon Black, Natural Rubber and Synthetic Rubber Costs)
Source: from top left to bottom right, brent crude oil, carbon black, natural rubber and synthetic rubber. (i) For
synthetic rubber, crude oil and carbon black, Federal Reserve Economic, monthly, not seasonally adjusted. (ii) For
synthetic rubber, Data index Jun 1981=100. (iii) For carbon black Dec. 1983=100. All data available on the
website: https://fred.stlouisfed.org, accessed on December 16, 2018. (iv) For natural rubber, US Dollar per
kilogram, monthly, not seasonally adjusted (www.indexmundi.com, accessed on December 16, 2018).
Figure 6 – Breakdown of Market Sales and Volume by Tyre Segment (FY2016) VOLUME SALES Others 54% Truck & bus 1% 5% Farm Passenger vehicle 14% 5% LCV 2- and 3-wheeler 13% 13% Truck & bus LCV 9% 23% Passenger vehicle Farm 8% 54% 2- and 3-wheeler 2% Others
Source: ATMA (2017b) ATMA Review. Indian Automobile Industry, FY2016-17 (Apr-Dec), ATMA Periodicals
(http://www.mohitnarang.in/atma/wp-content/uploads/2018/03/Atma-Periodicals_17-4-17.pdf, accessed on December 6, 2018).
_________________________________ 7 _________________________________
_______________________ Tyre Maharajahs Case Study _______________________
Table 2 – Breakdown of Tyre Sales in India by Market and Product (FY2017, in volume) Passenger vehicle
Medium & high commercial vehicle (M&HCV) OEM Replacement Export OEM Replacement Export Volume 43% 51% 6% 15% 71% 14% Two- and three-wheeler
Light commercial vehicle (LCV) OEM Replacement Export OEM Replacement Export Volume 51% 47% 2% 27% 53% 20%
Source: (i) Michelin’s Internal Data on the World Tyre Market (2018). (ii) ATMA (2017b) ATMA Review. Indian Automobile
Industry, FY2016-17 (Apr-Dec), ATMA Periodicals, available on the webpage: http://www.mohitnarang.in/atma/wp-
content/uploads/2018/03/Atma-Periodicals_17-4-17.pdf, accessed December 6, 2018).
These three markets (OEM, replacement and
Passenger vehicle (or car) tyre sales represent
export markets) concern several lines of
14% of total tyre sales by volume and around
products: M&HCV tyres (mainly bus and
23% by value (see Figure 6). This difference
truck tyres), car tyres, two- and three-wheeler
is explained by the increase in car
tyres, LCV tyres (see Table 2).
performance, the development of the radial
tyre and the emergence of strong brands in
In the fiscal year 2015-16 (or FY2016),
the Indian market. In the coming years, both
commercial vehicle tyres accounted for 18%
replacement and OEM markets are expected
of all tyres sold in India while their sales
to grow annually in line of years 2015-17, at
constitute 63% of the revenue (see Figure 6).
a pace above 5% (Michelin’s Internal Data
This is explained not only by the cost
on the World Tyre Market, 2018). OEM
production but also by truck driver’s and
market will lead the way as passenger vehicle
fleet manager’s business needs. They
market is forecast to grow yearly at 10%
demand a robust tyre at a good price, rate20.
withholding the load all the way. They have
been led to think in terms of cost per
In stark contrast to the commercial vehicle
kilometre rather than the tyre buy-in cost,
tyre segment, two- and three-wheeler tyres
which prompts them to include the tyre
represent 54% of all tyres sold in India
mileage and retreading in their cost
whereas its forms 13% of sales (see Figure
calculation. Furthermore, some sense of
6). There is strong competition in this
relationship between the tyre and fuel
segment, with a strong focus of customers on
consumption has grown since several years.
price, which results for tyre makers in regular
From this point of view, the radial tyre is
drops in prices and margins. Due to its
much more economical than the cross-ply
affordability and low maintenance cost, this
tyre. From the tyre industry’s standpoint, all
means of transport should grow at a faster
these factors mean at best a stagnant demand,
pace than passenger vehicle. As this tyre
which has even decreased in the years 2015-
market is quasi-exclusively made up of
2017, especially in the replacement segment
cross-ply tyres, it is sheltered from Chinese
(Michelin’s Internal Data on the World Tyre imports. Consequently, the domestic
Market, 2018). The only increasing market
industry will fully benefit from this demand,
will be the OEM, driven by commercial
which explains that all major tyre companies
vehicle sales, which are correlated with the
have lately invested this segment 21. GDP growth19.
The Tyre Industry in India: Market Shares and Competition
In FY2018, the Indian tyre market
locally 60 manufacturing facilities along
amounted to approximately Rs. 595,000 with dozen of importers (mostly
million. This market is made up of 39
Chinese). However, four Indian tyre
Indian and foreign companies operating
makers alone―MRF (leader), Apollo
_________________________________ 8 _________________________________
_______________________ Tyre Maharajahs Case Study _______________________
Tyres, JK Tyre and CEAT―stand out
industry concentration is even stronger,
with cumulated sales accounting for
especially in the commercial tyre segment
around 65% of the entire tyre market (see (see Table 3).
Figure 7). In terms of volume, the
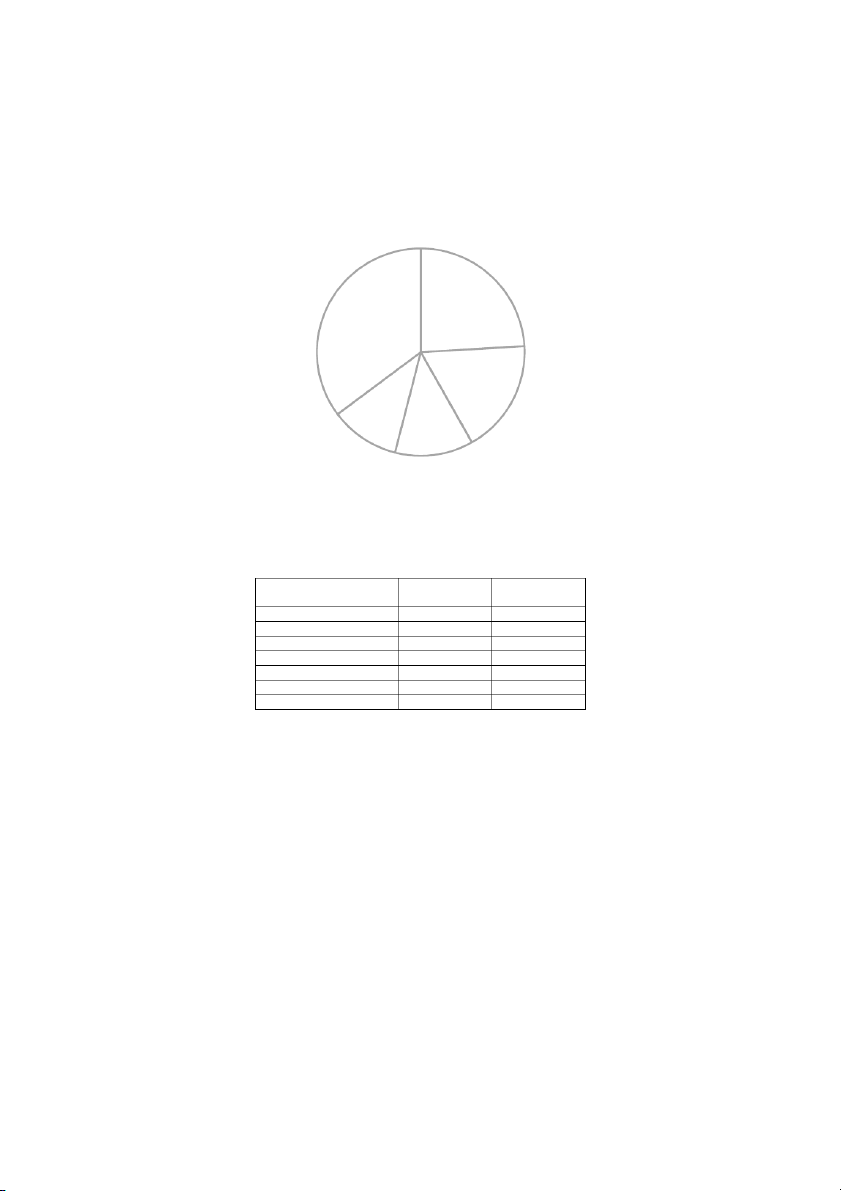
Figure 7 – Market Shares (in Value) of Tyre Makers in India (FY2018) MRF 24% Others 35% Apollo Tyres 18% CEAT 11% JK Tyre 12%
Nota Bene: we estimated the market shares of tyre makers in this figure by dividing their respective
FY2018 total sales (minus foreign sales) by the FY2018 total value of the Indian tyre market
(amounting to approximately Rs. 595,000 million).
Table 3 – Market Shares (in Volume) by Product (FY2018) Passenger Commercial Tyre maker vehicle vehicle MRF 10.9% (leader) 21.5% Apollo Tyres 8.9% 24.9% (leader) JK Tyre 6.0% 20.1% Other Indian tyre makers 33.4% 22.2% Global tyre makers* 32.6% 7.0% Chinese exporters** 3.9% 4.3% Other Asian exporters*** 4.3% -
* Cumulated market shares of the five world’s largest tyre makers
(Bridgestone, Goodyear, Michelin, Continental and Pirelli).
** This category also includes Taiwanese tyre makers such as Maxxis.
*** Cumulated market shares of Hankook (South Korea), Nexen (South
Korea), Kumho (South Korea), GITI (Singapore), Toyo (Japan),
Sumitomo (Japan) and Yokohama (Japan).
Source : Michelin’s Internal Data on the World Tyre Market (2018).
Despite a growing tyre market, several
commercial vehicle radial and two- and
incumbents have recently encountered
three-wheeler tyres), to JK Tyre on April
tougher competitive conditions and 2016.
subsequently faced financial distress,
Many factors may explain the difficulties
leading to company restructuring and
faced by some Indian tyre makers,
industry consolidation: for instance,
especially in the commercial vehicle
Falcon Tyres, a full-range tyre maker,
radial tyre and passenger car radial tyre
filed for bankruptcy in 2017 and Birla
segments (see developments in the
Tyres, a highly indebted tyre maker, sold
introductory section) but the aggressive
off one of its subsidiaries, Cavendish
pricing of Chinese and Taiwanese
Industries (specialized in manufacturing
exporters (Maxxis, Shandong Linglong
_________________________________ 9 _________________________________
_______________________ Tyre Maharajahs Case Study _______________________
yre and Hangzhou Zhongce Rubber) in
CAGR) during the same period22. On
the replacement market seems to be a key
September 2018, the Indian government
destabilizing factor. Chinese tyre makers
responded to this trend by imposing
started exporting commercial vehicle
another set of customs duties (15%) on
radial tyres for the OEM market at the end
imported passenger car radial tyres.
of the 1990s, as the local capacity was not These higher customs duties will
sufficient to fulfil the Indian truck
probably lead Chinese exporters to
makers’ needs. Over time, Indian truck
modify their Indian market strategy and makers considerably reduced their
to favor equity entry modes over exports.
Chinese tyre purchase, as they were not
A good illustration is the recent
satisfied with the tyre quality. Chinese
greenfield investment decision made by
exporters have redirected their sales to
one of the world’s largest two-wheeler
the replacement market where end
tyre maker, the Taiwan-based Maxxis
customers are more sensitive to tyre
group. Targeting 15% (in volume) of the
price. Today, they grab a record 14.9%
Indian two- and three-wheeler tyre
share for commercial vehicle radial tyres
segment in five years, Maxxis has locally
sold to the replacement market (see Table
set up a manufacturing facility with a 4).
yearly capacity of 7.3 million tyres in
Consequently, Indian tyre makers have March 2018.
lobbied their government to increase
Facing with these threats, Indian tyre
customs duties on tyre imports. In
makers are currently reviewing their
September 2017, the Indian government
competitive strategy and pursuing new
took a first step against Chinese imports,
directions for growth: (i) extending their
known as the Anti-Dumping Duty
product range and striving to become full-
(ADD): customs duties on commercial
range tyre makers, (ii) expanding abroad,
vehicle radial tyres imported from China
especially in emerging economies, and
and Taiwan rose from 10 to 15%. Over
(iii) developing their online distribution.
time, the ADD enforcement has had
As regards this last growth direction,
opposite impacts on the Indian tyre
Indian tyre makers have devised distinct
market: on one side, it has led to slowing
online distribution strategies: some tyre
down the flows of imported Chinese
makers sell tyres on their own e-
commercial vehicle radial tyres in India
commerce website (Bridgestone India,
but on the other side, it has diverted these
GoodYear India, Michelin India, MRF
flows to the passenger vehicle radial tyre
and Apollo Tyres) while others favor
segment. While total tyre imports have
independent and specialized websites
risen by 6.1% (compound average growth
such as tyres.cardekho.com or consumer
rate, CAGR) between FY2015 and goods shopping websites such as
FY2018, imported passenger car radial Snapdeal or Flipkart.
tyres have grown at a faster pace (12.7%
_________________________________ 10 _________________________________
_______________________ Tyre Maharajahs Case Study _______________________
Table 4 – Market Shares (in Volume) by Product / Market (FY2018) Passenger vehicle Commercial vehicle Tyre maker OEM Replacement OEM Replacement MRF 20.4% (leader) 15.2% 22.9% Apollo Tyres 16.6% 31.2% (leader) 23.5% (leader) 64.3% JK Tyre 11.2% 26.2% 18.7% Other Indian tyre makers 6.7% 23.5% 21.9% Global tyre makers* 32.6% 32.6% 3.1% 8.0% 7.1% (7.2% in the 5.0% (14.9% in Chinese exporters** - 0.8% radial segment) the radial segment) Other Asian exporters*** 3.1% 5.4% - -
* Cumulated market shares of the five world’s largest tyre makers (Bridgestone, Goodyear, Michelin, Continental and Pirelli).
** This category also includes Taiwanese tyre makers such as Maxxis.
*** Cumulated market shares of Hankook (South Korea), Nexen (South Korea), Kumho (South Korea), GITI (Singapore), Toyo
(Japan), Sumitomo (Japan) and Yokohama (Japan).
Source: Michelin’s Internal Data on the World Tyre Market (2018).
Table 5 – Market Shares (in Volume) by Product / Technology (FY2018) Passenger Commercial vehicle Tyre maker vehicle radial Cross-ply Radial MRF 10.7% (leader) 26.6% (leader) 13.7% Apollo Tyres 8.9% 23.7% 26.7% (leader) JK Tyre 5.9% 19.4% 21.1% Other Indian tyre makers 33.4% 30.3% 14.6% Global tyre makers* 32.9% - 13.2% Chinese exporters** 3.8% - 10.7% Other Asian exporters*** 4.4% - -
* Cumulated market shares of the five world’s largest tyre makers (Bridgestone, Goodyear,
Michelin, Continental and Pirelli).
** This category also includes Taiwanese tyre makers such as Maxxis.
*** Cumulated market shares of Hankook (South Korea), Nexen (South Korea), Kumho (South
Korea), GITI (Singapore), Toyo (Japan), Sumitomo (Japan) and Yokohama (Japan).
Source: Michelin’s Internal Data on the World Tyre Market (2018).
The Tyre Industry in India: Competitors ■ MRF
(in value) in India hovers around 24.1% (see
Figure 7). MRF is a full-range tyre maker
(see Table 6), which occupies a leading
position in most product segments in India
(passenger vehicle, two- and three-wheeler, agriculture and OTR tyres).
CEO (FY2018): K.M. Mammen
MRF has eight manufacturing facilities
Sales (FY2018): Rs. 156,956.2 million ($US 2,396
(mostly located in the south of India) and a million)
distribution network of 5,000 dealers in India
Indian and world market shares (in value, (including 4,200 directly-operated
FY2018): 24.1% (ranked 15 th world tyre maker)
stores―MRF TireTok, MRF MuscleZone
Listed on the Bombay Stock Exchange: Yes
and MRF FASST―and 800 MRF T&S
franchised stores). In 2017, the Indian tyre
The creation of Madras Rubber Factory
company started distributing its products
(MRF) in Chennai (Tamil Nadu province)
online through its website and the MRF T&S
dates back to 1946. The company has been network.
leading the Indian tyre industry for 40 years
and ranks 15th among the 30 largest tyre
The first international move of the Indian
makers in the world. Its current market share
tyre company occurred in 1964 with the
_________________________________ 11 _________________________________
_______________________ Tyre Maharajahs Case Study _______________________
opening of a commercial representative
Philippines and Middle East countries. Over
office in Lebanon. Today, the Indian tyre
the FY2013-18 period, MRF’s sales in its
company achieves 8.6% of its sales abroad
export markets have stagnated following the
through exports. Its main geographical
intense price competition imposed by
markets are Sri Lanka, Indonesia, the Chinese tyre makers.
Table 6 – MRF: Product and Technology (FY2018) Passenger Commercial Two- and three- Agriculture and LCV vehicle vehicle wheeler OTR vehicle Cross-ply ■ ■ ■ ■ Radial ■ ■ ■ ■
Source: FY2018 MRF’s annual report (www.mrftyres.com/financial-results, accessed on November 26, 2018).
Table 7 – MRF: Market Shares (Value) (FY2005 and FY2018) Passenger Commercial Two- and three- Agriculture and LCV vehicle vehicle wheeler OTR vehicle 2005 25% 19% n.a. 42% leader 2018 23% (leader) 25% n.a. 37% (leader) leader
Source : FY2018 MRF’s annual report (https://www.mrftyres.com/financial-results, accessed on November 26, 2018).
Table 8 – MRF: Financial Data (in Rs. m) 2013-14 2014-16 2016-17 2017-18 (FY 2014) (18 months) (FY2017) (FY2018) Total sales 133,961.9 228,146.1 152,601.8 156,956.2 Foreign sales 13,320.0 18,560.0 13,160.0 13,530.0 Total assets 98,339.9 132,538.1 150,484.7 164,784.8 Shareholder equity 45,395.5 72,243.4 85,444.2 96,042.0 CSR expenses n.a. 225.5 392.4 94.9 R&D expenses 340.8 548.9 1,996.8 1,108.6 Input cost 82,989.0 111,629.1 76,799.5 89,853.8 Net profit 9,083.2 24,870.8 14,862.2 11,316.1 Market-to-book ratio 3.05 2.25 2.98 3.15
Note Bene: Before 2014, financial data of MRF were estimated over a yearly period ranging from
September N-1 to September N and from 2016, over a yearly period ranging from March N-1 to March N.
Source: (i) Orbis (https://orbis.bvdinfo.com, accessed on November 26, 2018). (ii) MRF’s
annual reports (2014, 2015, 2016, 2017, and 2018; https://www.mrftyres.com/financial-results,
accessed on November 26, 2018). ■ Apollo Tyres
share in value) and 17th among the 30 largest
tyre makers in the world. Initially, Apollo
Tyres was specialized in manufacturing and
selling truck tyres. Building on a leading
competitive position in the commercial
vehicle segment (27% market share in value
CEO (FY2018): Onkar S. Kanwar
and 24.9% in volume), Apollo Tyres has
Sales (FY2018): Rs. 152,119.5 million ($US 2,322
followed two directions for growth: product million)
range extension and internationalization.
Indian and world market shares (in value,
Throughout its history, the Indian tyre maker
FY2018): 17.7% (ranked 17 th world tyre maker)
has strived to expand into all tyre segments,
Listed on the Bombay Stock Exchange: Yes
with its latest entry into the two- and three-
wheeler tyre segment in 2016 (see Table 9).
Created in 1972, Apollo Tyres ranks 2nd in
Today, Apollo Tyres is a full-range tyre
the Indian tyre industry (with a 17.7% market
maker with a strong focus on the replacement
_________________________________ 12 _________________________________
_______________________ Tyre Maharajahs Case Study _______________________
market where it achieves the largest share of
While its internationalization strategy is its sales in India.
unique in the Indian tyre context, Apollo
Tyres has also suffered notable setbacks in
As regards its internationalization, Apollo
this matter. First, the rising level of South
Tyres differentiates itself from most of the
Africa’s political and economic uncertainty,
Indian tyre makers, which rely on exports to
which was observed at the beginning of the
expand abroad (except JK Tyre). First,
2010s, produced operational disruptions,
Apollo Tyres is today the Indian tyre maker
sharp labor cost increase and financial issues
with the highest internationalization intensity
for the Apollo Tyres’ local subsidiary. As
with a 30.5% foreign sales-to-total sales ratio
stated by the tyre maker’s Chief Business
(see Table 11). The Indian tyre maker sells
Officer, Sunam Sarkar, in Forbes India: “post
its products in 102 countries with a majority
the 2010 Fifa World Cup in South Africa,
proportion of foreign sales achieved in the
there was a lot of industrial unrest.
European market. Second, the tyre maker’s
Electricity rates rose rapidly and the entire
has leveraged its foreign sales mostly
tyre industry went on strike for a month.
through taking over local tyre makers and
Cheap Chinese imports to South Africa also
setting up wholly-owned manufacturing and
caused a lot of pain to domestic tyre
distribution subsidiaries. These different
manufacturers”24. Finally, Apollo Tyres
internationalization features explain why
decided to sell off Dunlop Tyres South
Apollo Tyres is often cited as an example of
Africa and the “Dunlop” brand rights to “emerging multinational.”
Sumitomo Rubber in 2014. Second, Apollo
Apollo Tyres started its internationalization
Tyres attempted to enter the US tyre market
by taking over Dunlop Tyres South Africa in
by launching a takeover bid on Cooper Tire
2006. This acquisition allowed the Indian
& Rubber (ranked 12th world tyre maker) in
tyre maker to benefit from a manufacturing
2013. However, after a long negotiation
base in South Africa and the “Dunlop” brand
process, the bid ended up negatively with the
rights for 32 African countries. After this first
bid rejection from the US tyre maker’s
international entry, Apollo Tyres accelerated
shareholders and after a strong opposition
its international expansion pace with the
expressed by Cooper subsidiary’s employees
takeover of the Dutch tyre maker, in China.
Vredestein, in 2009. Lastly, Apollo Tyres
Apollo Tyres has four manufacturing
consolidated its European position with a
facilities (with two additional manufacturing
record investment (Rs. 40,000 million) to set
facilities in Europe) and a distribution
up a wholly-owned manufacturing facility in
network of 5,300 dealers in India (including
Hungary. As emphasized by the tyre maker’s
1,700 franchised exclusive stores: “Apollo
CEO, Onkar S. Kanwar, during the
Zone” “Apollo CV Zone” and “Apollo
inauguration: “this is the first time the
Point”). Its main ambition for the next years
company has set up a plant outside India
is to dethrone MRF as the leader of the Indian
from scratch”23 . Fully operating in 2018, this
tyre industry. To this purpose, Apollo Tyres
second manufacturing base in Europe (the
has unveiled an ambitious 5-year investment
first one is the Vredestein’s manufacturing
plan (Rs. 38,000 million), aiming to set up a
facility in the Netherlands) allowed Apollo
new manufacturing facility in India with a
Tyres to supply the local OEM and
capacity of 5.3 million passenger vehicle
replacement markets with an additional 5.5
tyres and 1 million commercial vehicle tyres.
million passenger vehicle tyres and 675,000 commercial vehicle tyres.
_________________________________ 13 _________________________________
_______________________ Tyre Maharajahs Case Study _______________________
Table 9 – Apollo Tyres: Product Mix, Type and Technology (FY2018) Passenger Commercial Two- and three- Agriculture and LCV vehicle vehicle wheeler OTR vehicle Sales 39% 42% 7% 2% 10% Cross-Ply ■ ■ ■ (since 2016) ■ Radial ■ (since 2000) ■ ■ ■ (since 2016) ■
Source: FY2018 Apollo Tyres’ annual reports (https://corporate.apollotyres.com/en-in/investors/financial-reporting/,
accessed on December 1, 2018).
Table 10 – Apollo Tyres: Market Shares (Value) (FY2005 and FY2018) Passenger Commercial Two- and three- Agriculture and LCV vehicle vehicle wheeler OTR vehicle 2005 13% 26% 26% - 23% 27% (leader) and 24% in the 2012 17% n.a. 2% n.a. radial segment (leader)
Source: FY2018 Apollo Tyres’ annual report (https://corporate.apollotyres.com/en-in/investors/financial-reporting/,
accessed on December 1, 2018).
Table 11 – Apollo Tyres: Financial Data (in Rs. m) 2013-14 2014-15 2015-16 2016-17 2017-18 (FY2014) (FY2015) (FY2016) (FY2017) (FY2018) Total sales 135,098.2 128,692.2 129,195.1 143,217.6 152,119.5 Foreign sales 50,526.7 35,905.1 34,624.2 42,965.2 46,457.3 Total assets 90,455.8 91,352.2 116,538.2 152,961.1 201,532.4 Shareholder equity 45,746.2 54,190.3 66,046.1 72,899.5 97,766.7 CSR expenses n.a. 56.8 129.3 185.0 215.6 R&D expenses 757.5 1,042.7 1,712.5 1,749.4 1,559.7 Input cost 71,067.4 64,188.4 53,142.1 53,132.2 62,811.5 Net profit 10,050.5 9,776.0 11,229.6 10,989.9 7,238.8 Market-to-book ratio 1.76 1.70 1.35 1.46 1.61
Nota Bene: Apollo Tyres’ financial data were estimated over a yearly period ranging from March N-1 to March N.
Source: Orbis (https://orbis.bvdinfo.com, accessed on November 26, 2018) and Apollo Tyres’ annual reports (2014,
2015, 2016, 2017, and 2018; https://corporate.apollotyres.com/en-in/investors/financial-reporting/, accessed on December 1, 2018). ■ JK Tyre
JK Tyre is a subsidiary of JK Industries,
which is a conglomerate operating in
different Indian industries: cement (JK
Lakshmi), paper (JK Paper), food processing (Umang Dairies), biotech (JK Agri
Genetics), insurance (JK Risk Managers &
CEO (FY2018): Raghupati Singhania
Insurance Brokers) and tyres. JK Industries
created its tyre business unit in 1972. The
Sales (FY2018): Rs. 66,109.5 million ($US 1,009
company ranks 3rd in the Indian tyre industry million)
(with a 12.2% market share in value) and
Indian and world market shares (in value,
22nd among the 30 largest tyre makers in the
FY2018): 12.2% (ranked 22 nd world tyre maker)
world. Throughout its history, JK Tyre has
Yearly manufacturing capacity (FY2018): 31.8
privileged the acquisition mode to expand
million tyres (7.9 million in Mexico and 23.9 million
quickly in the tyre industry, both locally and in India) internationally.
Listed on the Bombay Stock Exchange: Yes
Pioneer of radial tyres in India, JK Tyre has
built a strong competitive position in the
_________________________________ 14 _________________________________
_______________________ Tyre Maharajahs Case Study _______________________
LCV and commercial vehicle tyre segment.
JK Tyre has nine manufacturing facilities
The Indian tyre maker enjoys the second (with three additional manufacturing
largest share for commercial vehicle radial
facilities in Mexico) and a distribution
tyres (with 21.1% market share in volume,
network of 3,700 dealers in India (including
see Table 5) and commercial vehicle tyres
400 directly-operated stores: 60 “JK Tyre
sold in the OEM market (with 26.2% market
Xpress Wheels” stores for two- and three-
share in volume, see Table 4). It is also the
wheeler tyres, 300 “JK Tyre Steel Wheels”
volume leader in the LCV (cross-ply and
stores for passenger vehicle tyres and 40 “JK
radial) tyre segment with 32% market share.
Tyre Truck Wheels” stores for commercial
This strong focus on the LCV and vehicle tyres).
commercial vehicle tyre segments is
JK Tyre expanded abroad early in its history.
reflected in the company’s total sales: this
In 1974, it signed a distribution agreement
segment accounts for 60% of the company
with General Tire & Rubber to sell its tyres
sales. Another focus of the tyre maker is the
in the US. This was its first international
replacement market where it achieves 58%
move. Today, JK Tyre exports its products in
of its sales (with 19% for foreign sales and
over 100 countries and achieves 14.7% of its 23% for OEM).
sales abroad. The acquisition (completed on
While strengthening its competitive position
April 11, 2008) of the Mexican tyre maker,
in the LCV and commercial vehicle tyre
Tornel, was a milestone in its international
segment, JK Tyre has sought new directions
expansion strategy. It has allowed JK Tyre to
for growth. First, it recently entered the two-
access the Central and South American tyre
and three-wheeler tyre segment: on April 18,
market and gain greater access to the North
2016, it completed the acquisition of the two-
American tyre market benefitting from the
and three-wheeler tyre maker, Cavendish
North American Free Trade Association
Industries (from the financially distressed
(NAFTA) agreement. JK Tyre has steadily
Birla Tyres). This acquisition brings JK Tyre
invested in its Mexican subsidiary, growing
three manufacturing facilities with a yearly
the yearly manufacturing capacity from 4.5
capacity of 8.5 million tyres. This acquisition
million tyres (FY2008) to 7.9 million tyres
adds manufacturing capacities in the
(FY2018). This acquisition can be viewed as
commercial vehicle radial tyre segment and
a success with regard to the foreign sales
allows JK Tyre to enter the two- and three-
growth reported from 2007 (year prior to the
wheeler tyre segment. Second, attracted by
acquisition) to 2018. Over this period, the
the high growth in the Indian aircraft
foreign sales grew from Rs. 4,810 million
industry, JK Tyre intends to develop new
(15% of total sales) to Rs. 12,580 million
product lines for this industry in the near (19%) (see Table 14). future.
Table 12 – JK Tyre: Product Mix, Type and Technology (FY2018) Passenger Commercial Two- and three- Agriculture and LCV vehicle vehicle wheeler OTR vehicle 21% (including See passenger Sales 60% 3% 16% LCV) vehicle Cross-ply ■ ■ ■ (since 2016) ■ Radial ■ ■ ■ ■
Source: FY2018 JK Tyre’s annual reports (https://www.jktyre.com/annualreports.aspx, accessed on November 28, 2018).
Table 13 – JK Tyre: Market Shares (in Value) (FY2005 and FY2018) Passenger Commercial Two- and three- Agriculture and LCV vehicle vehicle wheeler OTR vehicle 2005 18% 25% n.a. - n.a. 2018 14% 32% n.a. 3% n.a.
Source: FY2018 JK Tyre’s annual report (https://www.jktyre.com/annualreports.aspx, accessed on November 28, 2018).
_________________________________ 15 _________________________________
_______________________ Tyre Maharajahs Case Study _______________________
Table 14 – JK Tyre: Financial Data (in Rs. m) 2013-14 2014-15 2015-16 2016-17 2017-18 (FY2014) (FY2015) (FY2016) (FY2017) (FY2018) Total sales 82,609.7 80,428.5 76,069.8 83,832.8 85,434.1 Foreign sales 10,400.0 8,440.0 5,810.0 9,370.0 12,580.0 Total assets 60,426.1 67,321.9 70,781.3 104,351.9 105,674.6 Shareholder equity 10,971.2 14,010.1 17,514.3 21,097.9 21,031.1 CSR expenses n.a. 20.7 47.5 43.5 45.5 R&D expenses 290. 381.3 478.1 570.1 609.6 Input cost 48,843.3 44,346.5 37,893.2 44,514.0 52,466.5 Net profit 2,630.2 3,296.6 4,696.1 3,602.2 576.3 Market-to-book ratio 0.67 1.71 1.09 1.41 1.74
Nota Bene: JK Tyre’s, financial data were estimated over a yearly period ranging from March N-1 to March N.
Source : (i) Orbis (https://orbis.bvdinfo.com, accessed on November 26, 2018). (ii) JK Tyre’s annual reports (2014, 2015,
2016, 2017, and 2018; https://www.jktyre.com/annualreports.aspx, accessed on November 28, 2018). ■ CEAT
Historically, CEAT has expanded over time
by focusing on two product segments:
commercial vehicle and two- and three-
wheeler tyres. Recently, it shifted its focus
more on the passenger vehicle tyre,
CEO (FY2018): Anant Goenka
agriculture and OTR segments as these
record increasing margin and growth (see
Sales (FY2018): Rs. 64,291.4 million ($US 981 million)
Table 16). The CEAT’s market mix follows
a standard pattern for the largest Indian tyre
Indian market share (in value, FY2018): 10.8%
makers, with a strong emphasis on
Yearly manufacturing capacity (FY2018): 34.6
replacement (61% of its sales with 12% for million tyres
foreign sales and 27% for OEM).
Listed on the Bombay Stock Exchange: Yes
CEAT has six manufacturing facilities (five
The CEAT brand originates from the
in India and one in Sri Lanka) and a
Italian CEAT group (Cavi Electrici Affini
distribution network of 4,500 dealers in
Torino), which created a wholly-owned
India (including 280 directly-operated two-
subsidiary in India in 1958, CEAT Tyres of
wheeler stores and 500 exclusive franchised
India. RPG group took over the tyre maker stores, “CEAT Shoppes”).
in 1982. RPG group is an Indian
conglomerate operating in communication
In 1981, CEAT initiated its first
technology (KEC International), software
international move by signing a worldwide
(Zensar Technologies), biotech (RPG Life
distribution agreement with Pirelli. Today,
Sciences), and tea and rubber plantations
CEAT exports its products in over 100
(Harrisons Malayalam). While being part of
countries, achieving 12% of its sales abroad
the Indian RPG group, CEAT has kept
(see Table 17). It has established
strong ties with Italy: in 1981 and 2011, it representative offices in Indonesia,
signed an agreement with the Italian tyre
Germany and the United Arab Emirates, maker, Pirelli, for transferring its
and has set up a 50:50 manufacturing joint
worldwide rights for the CEAT brand; and
venture (CEAT Kelani) in Sri Lanka where
in 2018, it became the official sponsor of the
it now occupies a leading market position.
Italian football team, Torino FC.
_________________________________ 16 _________________________________
_______________________ Tyre Maharajahs Case Study _______________________
Table 15 – CEAT: Product Mix, Type and Technology (FY2018) Passenger Commercial Two- and three- Agriculture and LCV vehicle vehicle wheeler OTR vehicle 7% (agriculture) Sales 14% 32% 12% 31% and 4% (OTR) Cross-ply ■ ■ ■ ■ Radial ■ ■ ■
Source: FY2008 CEAT’s annual report (https://www.ceat.com/corporate/investor/financials, accessed on November 30, 2018).
Table 16 – CEAT: Market Shares (in Value) (FY2005 and FY2018) Passenger Commercial Two- and three- Agriculture and LCV vehicle vehicle wheeler OTR vehicle 2005 11% 18% 22% 11% 16% 2018 8% 11% n.a. 28% n.a.
Source: FY2018 CEAT’s annual report (https://www.ceat.com/corporate/investor/financials, accessed on November 30, 2018).
Table 17 – CEAT: Financial Data (in Rs. m) 2013-14 2014-15 2015-16 2016-17 2017-18 (FY2014) (FY2015) (FY2016) (FY2017) (FY2018) Total sales 55,679.7 57,747.3 61,735.9 64,599.4 64,291.4 Foreign sales 11,135.9 10,394.5 8,025.6 7,751.9 7,714.9 Total assets 35,400.5 37,816.7 41,079.5 49,169.4 51,609.9 Shareholder equity 10,286.1 17,461.1 20,869.8 24,441.0 26,294.6 CSR expenses 37.8 34.4 77.3 101.1 107.1 R&D expenses 187.0 215.5 532.8 1,331.6 1,008.0 Input cost 35,649.9 33,626.1 29,537.8 33,088.8 36,521.4 Net profit 2,707.8 3,139.2 4,357.1 3,592.2 2,332.9 Market-to-book ratio 1.49 1.90 2.09 2.19 2.31
Nota Bene: CEAT’s financial data were estimated over a yearly period ranging from March N-1 to March N.
Source : (i) Orbis (https://orbis.bvdinfo.com, accessed on November 30, 2018). (ii) CEAT’s annual reports (2014, 2015,
2016, 2017, and 2018; https://www.ceat.com/corporate/investor/financials, accessed on November 30, 2018). ■ TVS Srichakra
Srichakra manufactures and sells the full
range of two- and three-wheeler tyres and
has recently expanded into the OTR and
agriculture tyre segment. The two- and
three-wheeler tyre specialist has a leading
CEO: Shobhana Ramachandhran
position in the OEM market where it
Sales (FY2018): Rs. 22,181.3 million ($US 339
achieves most of its sales (see Table 18). million)
As regards its international expansion, the
Indian market share (in value, FY2018): 3.3%
Indian tyre maker exports its products in 65
Yearly manufacturing capacity (FY2018): 26.0
countries (mostly in Africa and South million tyres
America), achieving 9.4% of its sales
Listed on the Bombay Stock Exchange: Yes abroad (see Table 20).
The TVS automobile distribution group
created TVS Srichakra in 1982. TVS
_________________________________ 17 _________________________________
_______________________ Tyre Maharajahs Case Study _______________________
Table 18 – TVS Srichakra: Tyre and Technology (FY2018) Passenger Commercial Two- and three- Agriculture and LCV vehicle vehicle wheeler OTR vehicle Cross-ply ■ ■ Radial ■
Source : FY2018 TVS Srichakra’s annual report https://www.tvstyres.com/financial/annual.php, accessed on December 6, 2018).
Table 19 – TVS Srichakra: Market Shares (in Value) (FY2005 and FY2018) Passenger Commercial Two- and three- Agriculture and LCV vehicle vehicle Wheeler OTR vehicle 2005 - - - 21% n.a. 2018 - - - 26% n.a.
Source : FY2018 TVS Srichakra’s annual report https://www.tvstyres.com/financial/annual.php, accessed on December 6, 2018).
Table 20 – TVS Srichakra: Financial Data (in Rs. m) 2013-14 2014-15 2015-16 2016-17 2017-18 (FY2014) (FY2015) (FY2016) (FY2017) (FY2018) Total sales 19,393.0 21,805.1 23,606.0 21,355.3 22,181.3 Foreign sales 2,237.5 2,065.7 2,044.8 2,005.1 2,102.0 Total assets 10,252.2 9,695.5 9,617.3 13,909.6 14,250.7 Shareholder equity 2,134.1 2,822.8 4,121.4 5,534.3 6,312.4 CSR expenses n.a. 8.8 15.6 31.2 41.8 R&D expenses 296.2 171.5 235.9 250.8 295.9 Input cost 11,009.0 11,487.6 10,624.4 11,411.6 12,299.1 Net profit 565.8 996.3 1,862.2 1,496.9 1,173.4 Market-to-book ratio 0.95 3.76 4.29 4.76 3.03
Nota Bene: TVS Srichakra’s financial data were estimated over a yearly period ranging from March N-1 to March N.
Source: (i) Orbis (https://orbis.bvdinfo.com, accessed on November 30, 2018). (ii) TVS Srichakra’s annual reports (2014,
2015, 2016, 2017, and 2018; https://www.tvstyres.com/financial/annual.php, accessed on December 6, 2018). ■ Goodyear India
1961 and corresponds to the first entry of
the Goodyear Tire & Rubber group into the Indian tyre market.
Goodyear India operates two plants, which
manufacture radial (passenger vehicle,
CEO (FY2018): Rajeev Anand
commercial vehicle, LCV and agriculture
Sales (FY2018): Rs. 17,426.2 million ($US 266
and OTR) tyres. The Indian tyre maker is million)
the leader (in value) in the radial agriculture
Indian market share (in value, FY2018): 2.9% tyre segment (see Table 22).
Listed on the Bombay Stock Exchange: Yes
Goodyear India achieves the majority share
Goodyear India is the Indian wholly-owned
of its sales in the OEM market. It also
subsidiary of the US Goodyear Tire &
distributes its products through a multi-
Rubber group, the third largest tyre maker brand dealer network.
in the world. This subsidiary was created in
_________________________________ 18 _________________________________
_______________________ Tyre Maharajahs Case Study _______________________
Table 21 – Goodyear India: Tyre and Technology (FY2018) Passenger Commercial Two- and three- Agriculture and LCV vehicle vehicle wheeler OTR vehicle Cross-ply Radial ■ ■ ■ ■
Source: FY2018 Goodyear India’s annual report (https://www.goodyear.co.in/investor-relations; accessed on December 5, 2018).
Table 22 – Goodyear India: Market Shares (in Value) (FY2005 and FY2018) Passenger Commercial Two- and three- Agriculture and LCV vehicle vehicle Wheeler OTR vehicle 2005 10 to 14% 4% - - 10 to 14% Leader in the radial 2018 n.a. n.a. - - agriculture segment
Source: FY2018 Goodyear India’s annual report (https://www.goodyear.co.in/investor-relations; accessed on December 5, 2018).
Table 23 – Goodyear India: Financial Data (in Rs. m) 2015-16 2016-17 2017-18 (FY2016) (FY2017) (FY2018) Total sales 18,969.7 16,600.1 17,426.2 Total assets 9,349.6 10,895.7 12,975.7 Shareholder equity 6,141.2 7,070.8 8,021.9 Input cost 6,245.2 5,736.1 6,998.6 Net profit 1,196.6 1,262.8 1,298.1 Market-to-book ratio 1.90 2.76 3.20
Nota Bene: Goodyear India’s financial data were estimated over a yearly period
ranging from March N-1 to March N.
Source : (i) Orbis (https://orbis.bvdinfo.com, accessed on November 30, 2018). (ii)
Goodyear India’s annual reports (2014, 2015, 2016, 2017, and 2018;
https://www.goodyear.co.in/investor-relations, accessed on November 30, 2018). ■ Bridgestone India
manufacturing facility in 1996. Today,
Bridgestone India operates two plants,
which manufacture 5.4 million radial
(passenger vehicle, commercial vehicle and CEO: Parag Satpute
two- and three-wheeler) tyres. This
manufacturing capacity allows Bridgestone
Yearly manufacturing capacity (2018): 5.4 million tyres
India to meet 90% of its India tyre demand
(the remainder is covered with imports).
Listed on the Bombay Stock Exchange: No
Bridgestone India has a balanced approach
Bridgestone India is the Indian wholly-
to the Indian tyre market with 53% of its owned subsidiary of the Japanese
sales in the OEM segment and 47% in the
Bridgestone group, the world’s largest tyre replacement segment. maker.
Bridgestone India has a distribution
The Japanese group entered the Indian tyre
network of 3,000 dealers in India (including industry by setting up its first
500 exclusive “Bridgestone” stores).
_________________________________ 19 _________________________________
_______________________ Tyre Maharajahs Case Study _______________________
Table 24 – Bridgestone India: Tyre and Technology (FY2018) Passenger Commercial Two- and three- Agriculture and LCV vehicle vehicle wheeler OTR vehicle Cross-ply Radial ■ (since 1996) ■ (since 1996) ■ (since 2016)
Source: FY2018 Bridgestone India’s annual report (http://www.bridgestone.co.in/Investors_Information.aspx; accessed on December 5, 2018).
Table 25 – Bridgestone India: Market Shares (in Value) (FY2005 and FY2018) Passenger Commercial Two- and three- Agriculture and LCV vehicle vehicle Wheeler OTR vehicle 30% in the 2005 n.a. - - - radial segment 19% (leader in 2018 the radial n.a. - n.a. - segment)
Source: FY2018 Bridgestone India’s annual report (http://www.bridgestone.co.in/Investors_Information.aspx; accessed on December 5, 2018).
Table 26 – Bridgestone India: Financial Data (in Rs. m) 2015-16 2016-17 (FY2016) (FY2017) Total sales 28,088.7 26, 963.4 Total assets 38,063.3 41,314.6 Shareholder equity 27,121.3 30,217.2 Input cost 11,268.0 9,730.4 Net profit 1,942.3 3,101.8
Nota Bene: Bridgestone India’s financial data were estimated
over a yearly period ranging from March N-1 to March N.
Source: Orbis (https://orbis.bvdinfo.com, accessed on December 5, 2018). End Notes
1 RubberAsia, Indian tyre industry has big growth potential; interview of Anant Goenka, ATMA Chairman, May 18, 2018
(https://www.rubberasia.com/2018/05/18/indian-tyre-industry-big-growth-potential-anant-goenka-chairman-atma/, accessed on December 3, 2018).
2 TyreAsia, Changing face of Indian tyre industry, November 5, 2018 (http://tyre-asia.com/2018/11/05/changing-face-of-
indian-tyre-industry/, accessed on December 3, 2018).
3 International Monetary Fund, World Economic Outlook: Challenges to Steady Growth, October 2018,
(https://www.imf.org/en/Publications/WEO/Issues/2018/09/24/world-economic-outlook-october-2018, accessed on December 3, 2018). 4 Society of Indian Automotive Manufacturers (SIAM), Automotive Mission Plan 2026,
(http://www.siamindia.com/uploads/filemanager/47AUTOMOTIVEMISSIONPLAN.pdf, accessed on December 3, 2018).
5 The Economic Times Auto , Imported car tyres to become dearer; Govt hikes custom duty by 5%, September 26, 2018
(https://auto.economictimes.indiatimes.com/news/tyres/imported-tyres-to-become-dearer-govt-hikes-custom-duty-by-
5/65968616, accessed on December 16, 2018. Commodity Online,
Indian tyre industry hit by weak Natural Rubber supplies, December 4, 2017
(https://www.commodityonline.com/commodity-news/indian-tyre-industry-hit-by-weak-natural-rubber-supplies/news-
now/18049, accessed on December 17, 2018).
6 The Financial Express, Natural rubber output may decline by 20% due to Kerala Floods, adversely impact Indian tyre
industry, September 7, 2018 (https://www.financialexpress.com/industry/natural-rubber-output-may-decline-by-20-due-to-
kerala-floods-adversely-impact-indian-tyre-industry/1305061/, accessed on December 17, 2018).
7 Money Control , Not after volume, but after profitable growth, says Neeraj Kanwar of Apollo Tyres, May 24, 2018
(https://www.moneycontrol.com/news/business/companies/not-after-volume-but-after-profitable-growth-says-neeraj-kanwar-
of-apollo-tyres-2575311.html, accessed on December 17, 2018).
8 The Economic Times Auto , Imported car tyres to become dearer; Govt hikes custom duty by 5%, September 26, 2018,
(https://auto.economictimes.indiatimes.com/news/tyres/imported-tyres-to-become-dearer-govt-hikes-custom-duty-by-
5/65968616, accessed on December 16, 2018).
_________________________________ 20 _________________________________
Tài liệu liên quan:
-
Cuộc thi “Nhà quản trị nhân sự tương lai” - Tài liệu tham khảo | Đại học Hoa Sen
240 120 -

L1-An Introduction to Human Resource Management - Tài liệu tham khảo | Đại học Hoa Sen
285 143 -

Models for warehouse management Classification and - Tài liệu tham khảo | Đại học Hoa Sen
290 145 -
Tổng hợp trắc nghiệm - Tài liệu tham khảo | Đại học Hoa Sen
382 191 -
Các phúc lợi của nhân viên tại Vinamilk trong quản trị nhân lực - Tài liệu tham khảo | Đại học Hoa Sen
1 K 496