Chapter 2 Principles of Microeconomic | Bài giảng kinh tế học vi mô
Chapter 2 Principles of Microeconomic | Bài giảng kinh tế học vi mô. Tài liệu giúp bạn tham khảo, ôn tập và đạt kết quả cao. Mời đọc đón xem!
Môn: Kinh tế vi mô (KTE201) 52 tài liệu
Trường: Trường Đại học Ngoại Thương 1.1 K tài liệu
Tác giả:


Preview text:
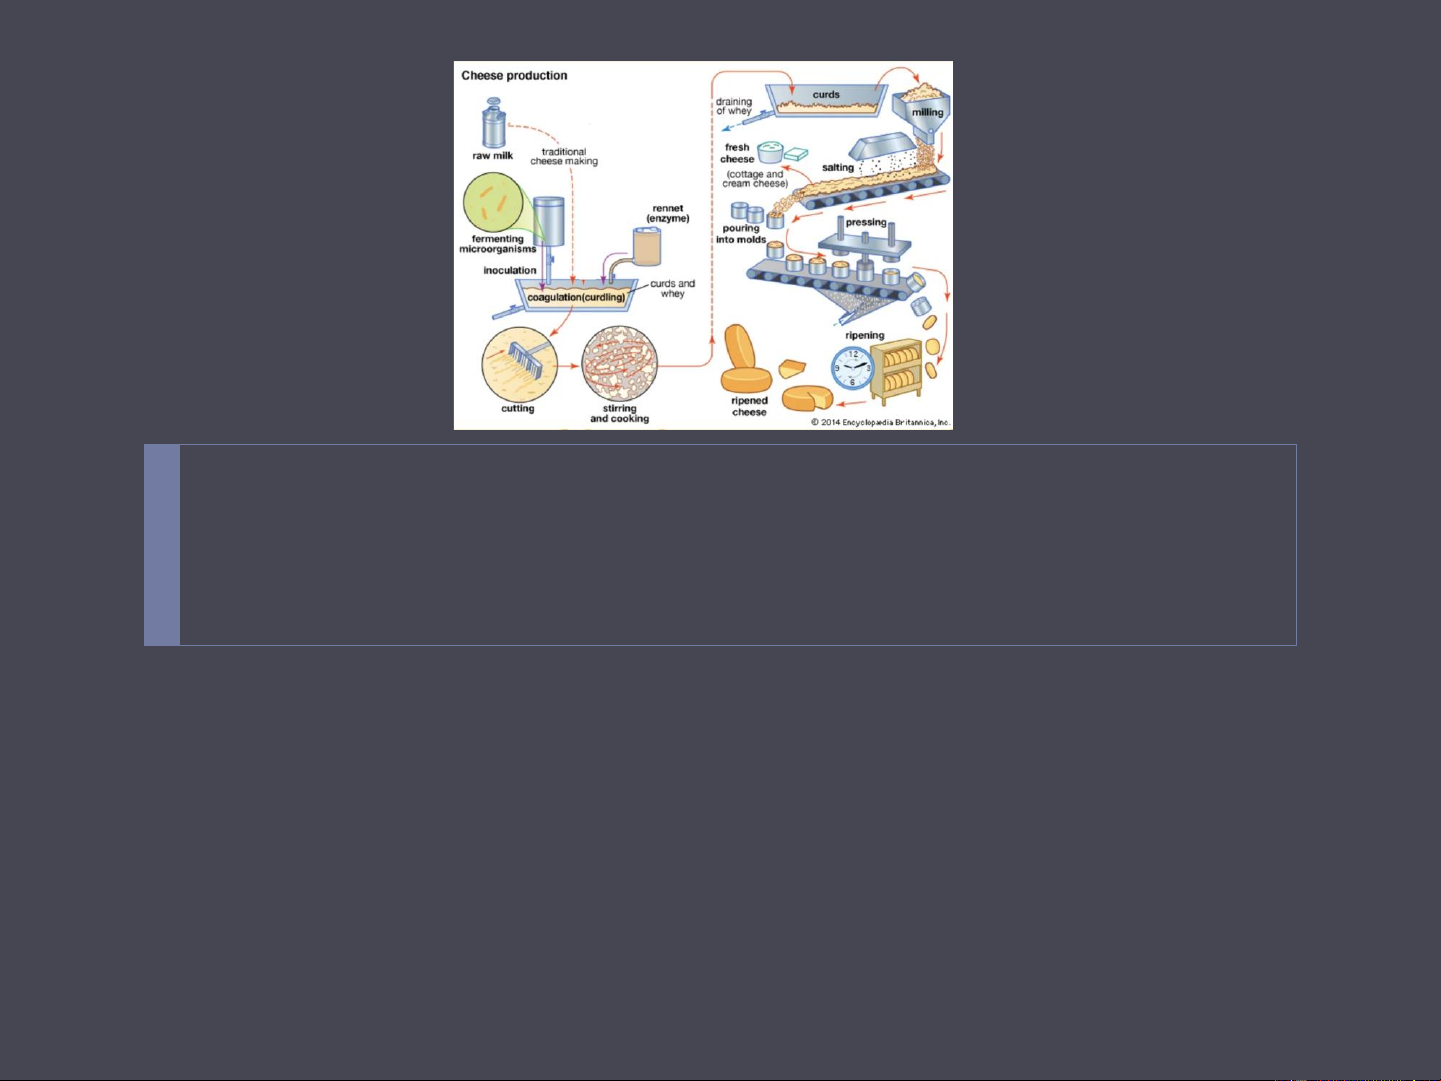
Chapter 2 PRINCIPLES OF MICROECONOMICS The Market Forces of Supply and Demand
By: Tran Thi Kieu Minh, VJCC Institute 1 @KieuMinh.MSc Contents 1. Demand 2. Supply 3. Market Mechanism 4.
Consumer Surplus, Producer Surplus and the efficiency of Markets. 5. Government Policies Reading:
Textbook: Chapter 4, 6, 7 and 8
Study Guide: Chapter 4, 6, 7 and * 2 @KieuMinh.MSc Markets
A group of buyers and sellers of a particular good or service Can be highly organized Can be less organized
Market: any institution, mechanism, or arrangement which facilitates exchange. Competitive market: a market in which there are many buyers and many sellers so that each has a negligible impact on the market price 3 @KieuMinh.MSc 3 Markets and Competition Perfect competition Monopolistic Obligopoly Monopoly Goods offered for Competition The only seller sale - exactly the in the market same Sets the price Buyers and sellers – numerous No single buyer or seller has any influence over the market price 4 2.1 DEMAND 5 Buyers determine demand... @KieuMinh.MSc Demand
Demand shows the willingness to pay (WTP) for a good
WTP = Willing to pay + Be able to pay Quantity demanded (QD) Amount of a good
Buyers are willing and able to purchase at exact Price
Law of Demand: Other things equal, when the price (P) of the
good rises, quantity demanded (QD) of a good falls
Relationship between Price of a good (P) and Quantity demanded (QD) can be shown: Demand schedule - a table: Demand curve - a graph: Downward sloping curve Demand function: QD= f (P) 6 @KieuMinh.MSc 6
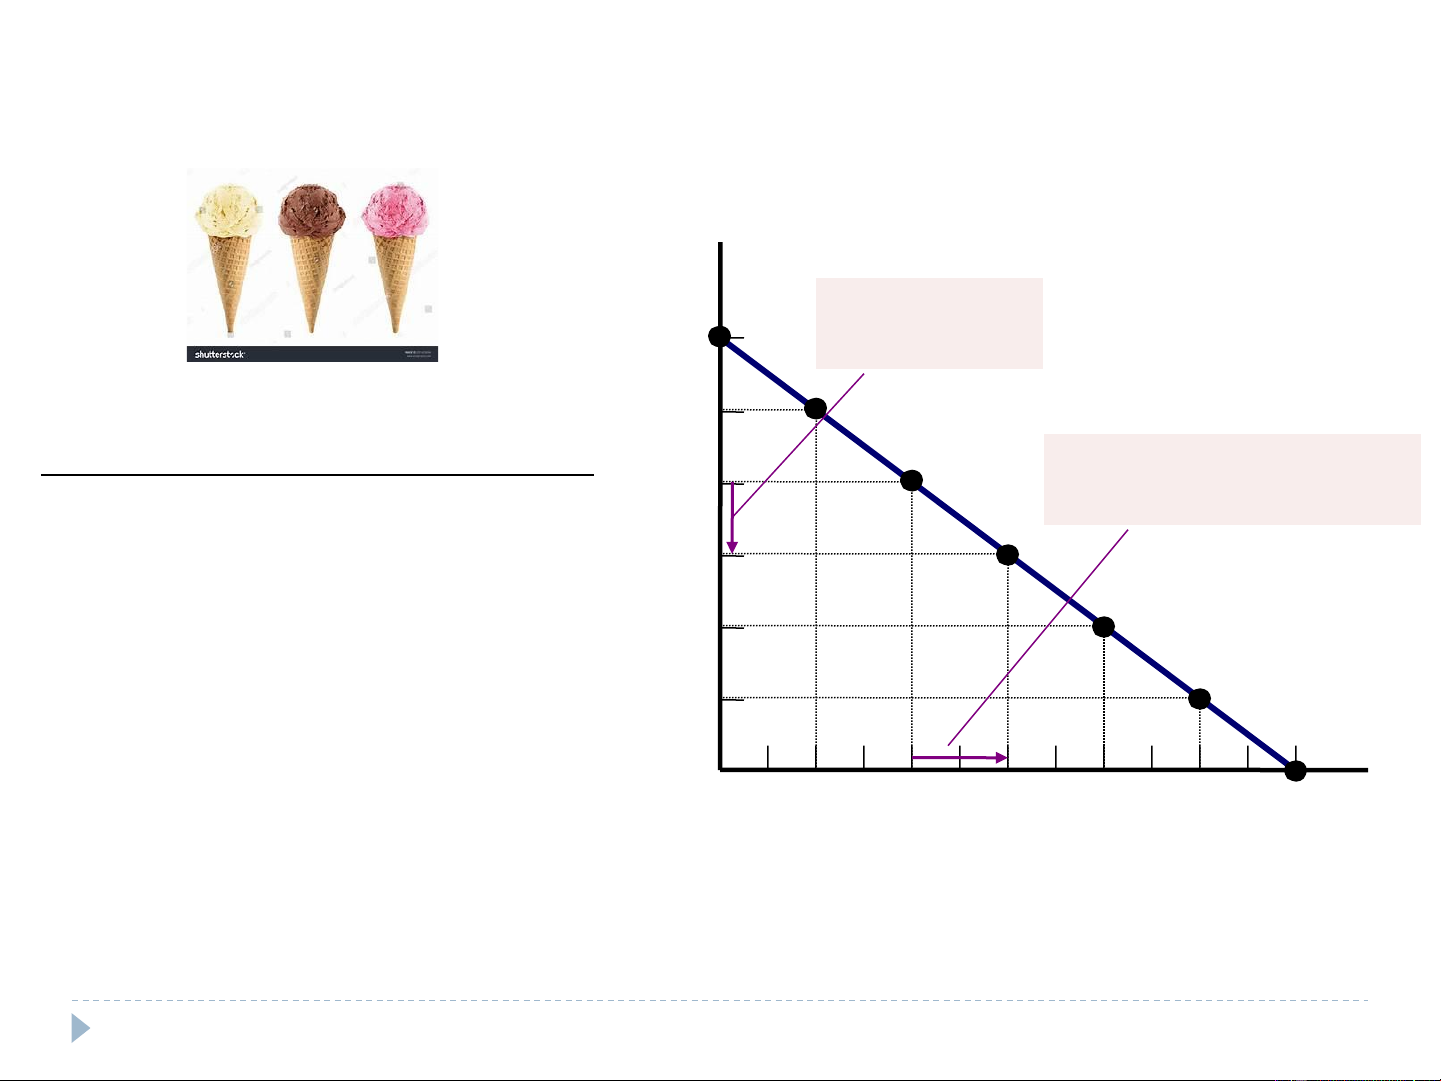
Catherine’s demand schedule and demand curve Price of Ice-Cream Cones 1. A decrease $3.00 in price . . . Price of Quantity of 2.50 Ice-cream cone Cones demanded 2. . . . increases quantity 2.00 $0.00 12 cones of cones demanded. 0.50 10 1.50 1.00 8 1.00 Demand curve 1.50 6 2.00 4 0.50 2.50 2 3.00 0 0 1 2 3 4 5 6 7 8 9 10 11 12 Quantity of Ice-Cream Cones
The demand function of Catherine for ice-cream Cones is:
………………………………………………………………… 7 7
Individual Demand and Market Demand Individual demand: Demand of one individual Market demand
Sum of all individual demands for a good or service Market demand curve
Sum - individual demand curves horizontally Price of ice-cream Catherine Nicholas Market cone $0.00 12 + 7 = 19 0.50 10 6 16 1.00 8 5 13 1.50 6 4 10 2.00 4 3 7 2.50 2 2 4 3.00 0 1 1 8 @KieuMinh.MSc 8
Market demand as the sum of individual demands Catherine’s Nicholas’s + = Market demand demand demand Price of Price of Price of Ice Ice Ice Cream Cream Cream Cones Cones Cones $3.00 D $3.00 $3.00 Catherine D 2.50 Nicholas 2.50 2.50 2.00 2.00 2.00 1.50 1.50 1.50 DMarket 1.00 1.00 1.00 0.50 0.50 0.50 0 1 2 3 4 5 6 7 8 9 10 11 12 0 1 2 3 4 5 6 7 0 2 4 6 8 10 12 14 16 18 Quantity of Ice-Cream Cones Quantity of Quantity of Ice-Cream Cones Ice-Cream Cones 9 9 Shifts in Demand Increase in demand
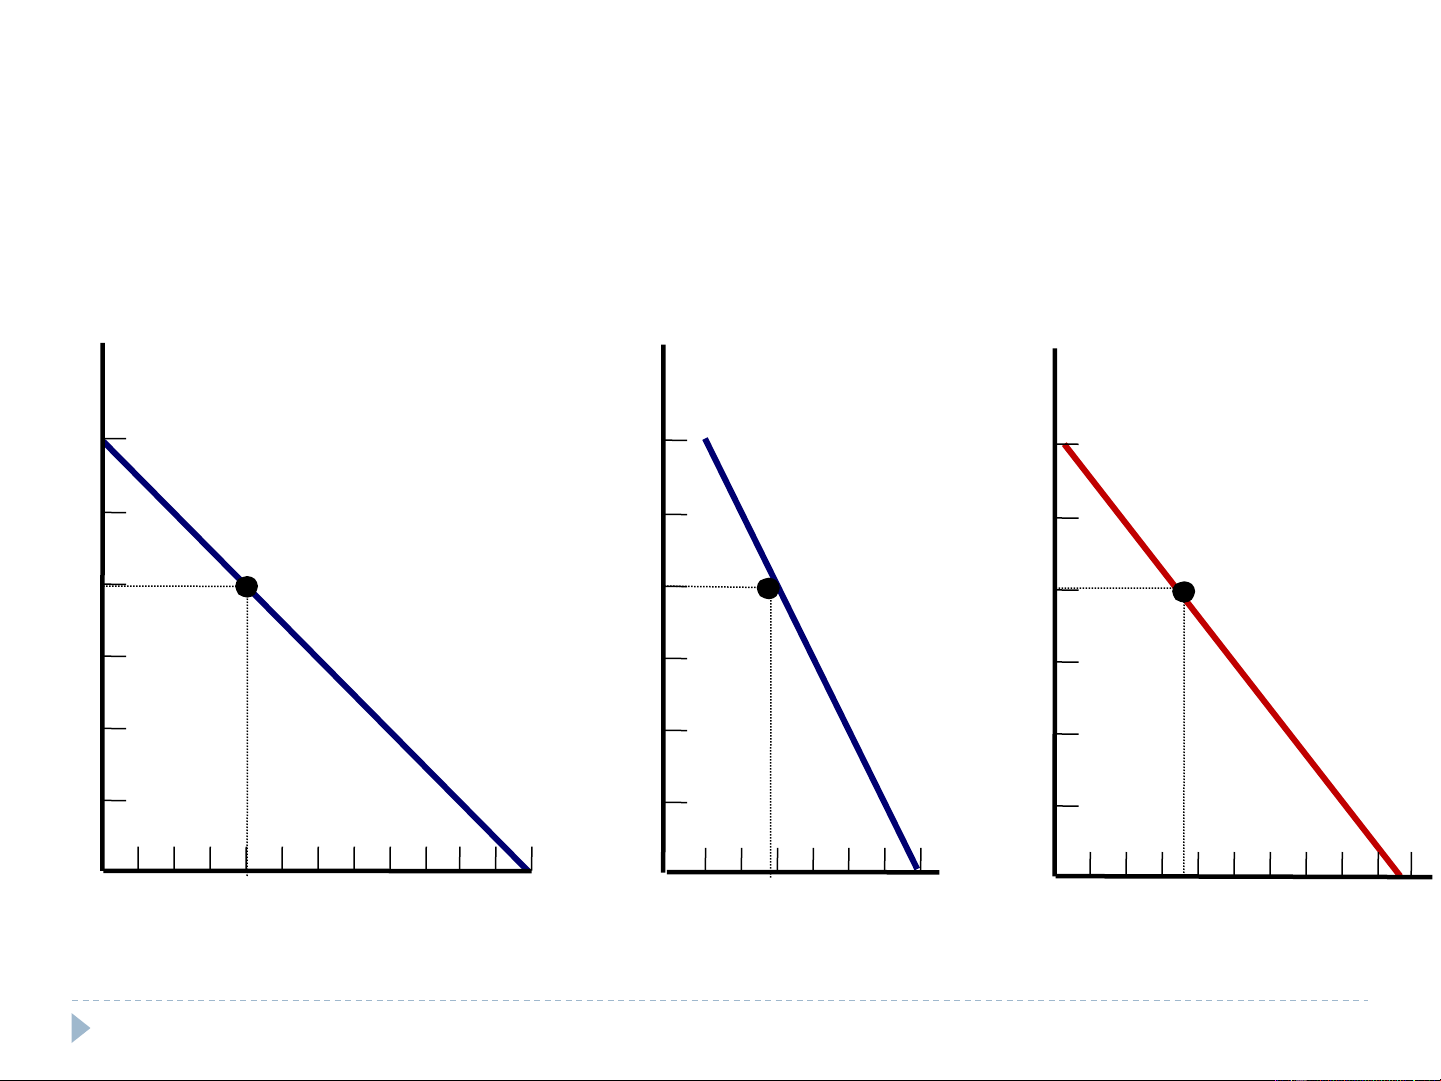
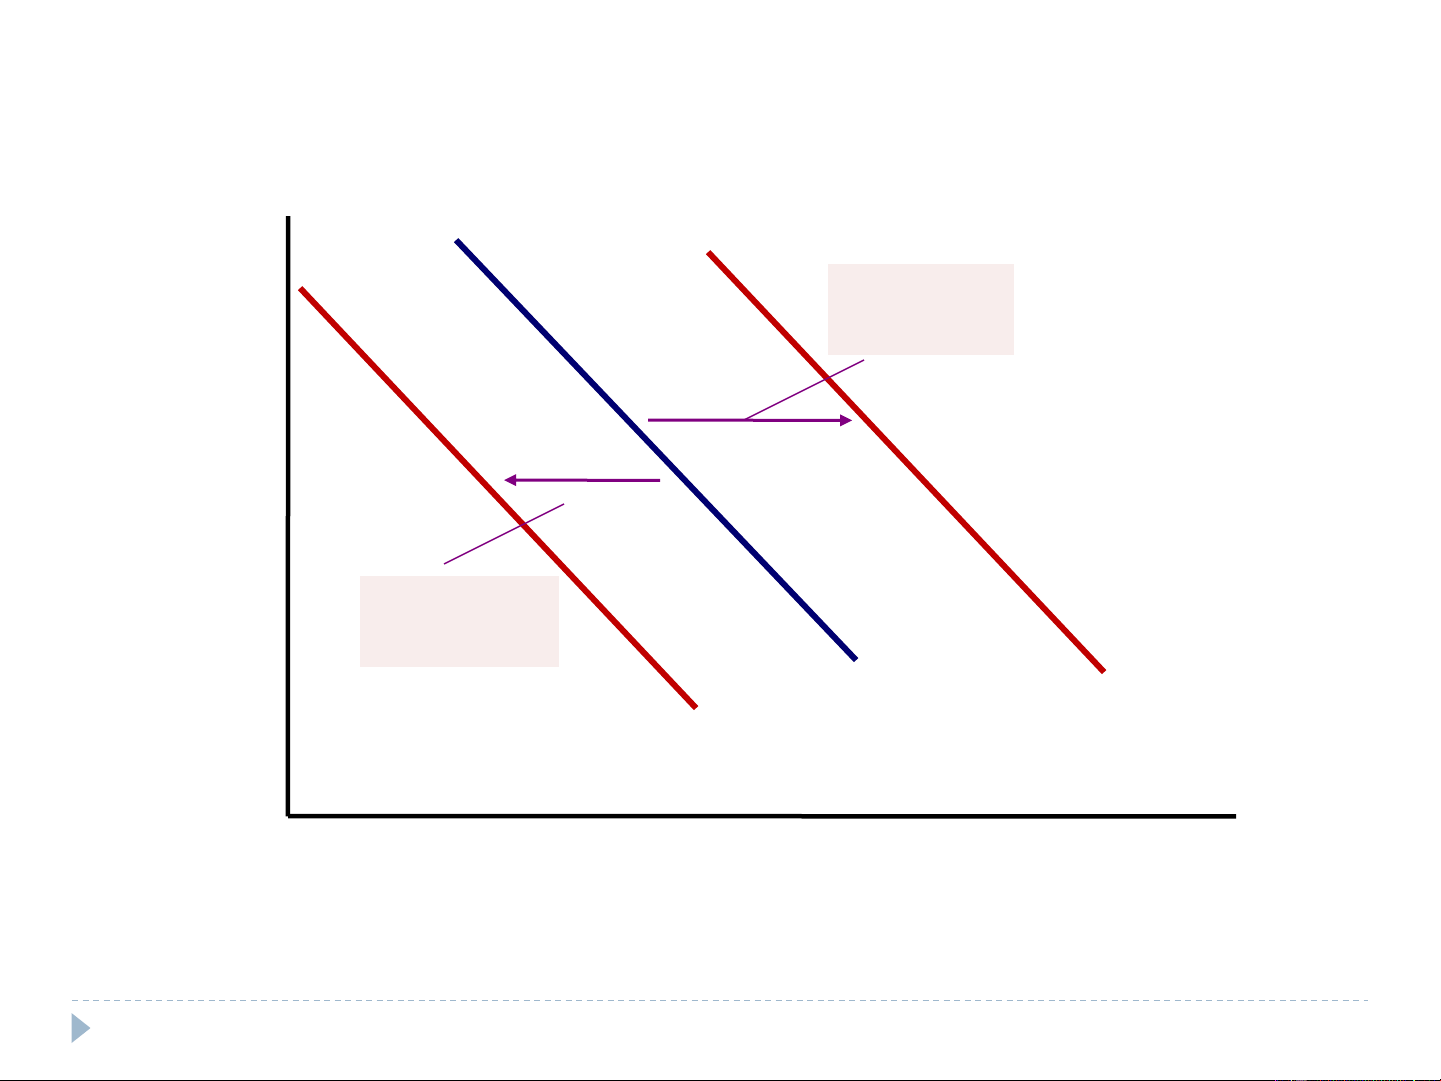
Any change that increases the quantity demanded at every price Demand curve shifts right Decrease in demand
Any change that decreases the quantity demanded at every price Demand curve shifts left
Variables that can shift the demand curve Income Prices of related goods Tastes Expectations Number of buyers 10 @KieuMinh.MSc 10 Shifts in the demand curve P Increase in Demand Decrease in Demand Demand Demand Demand curve, D1 curve, D curve, D 2 3 0 Q 11 @KieuMinh.MSc 11 Changes in Demand 1. Income (I)
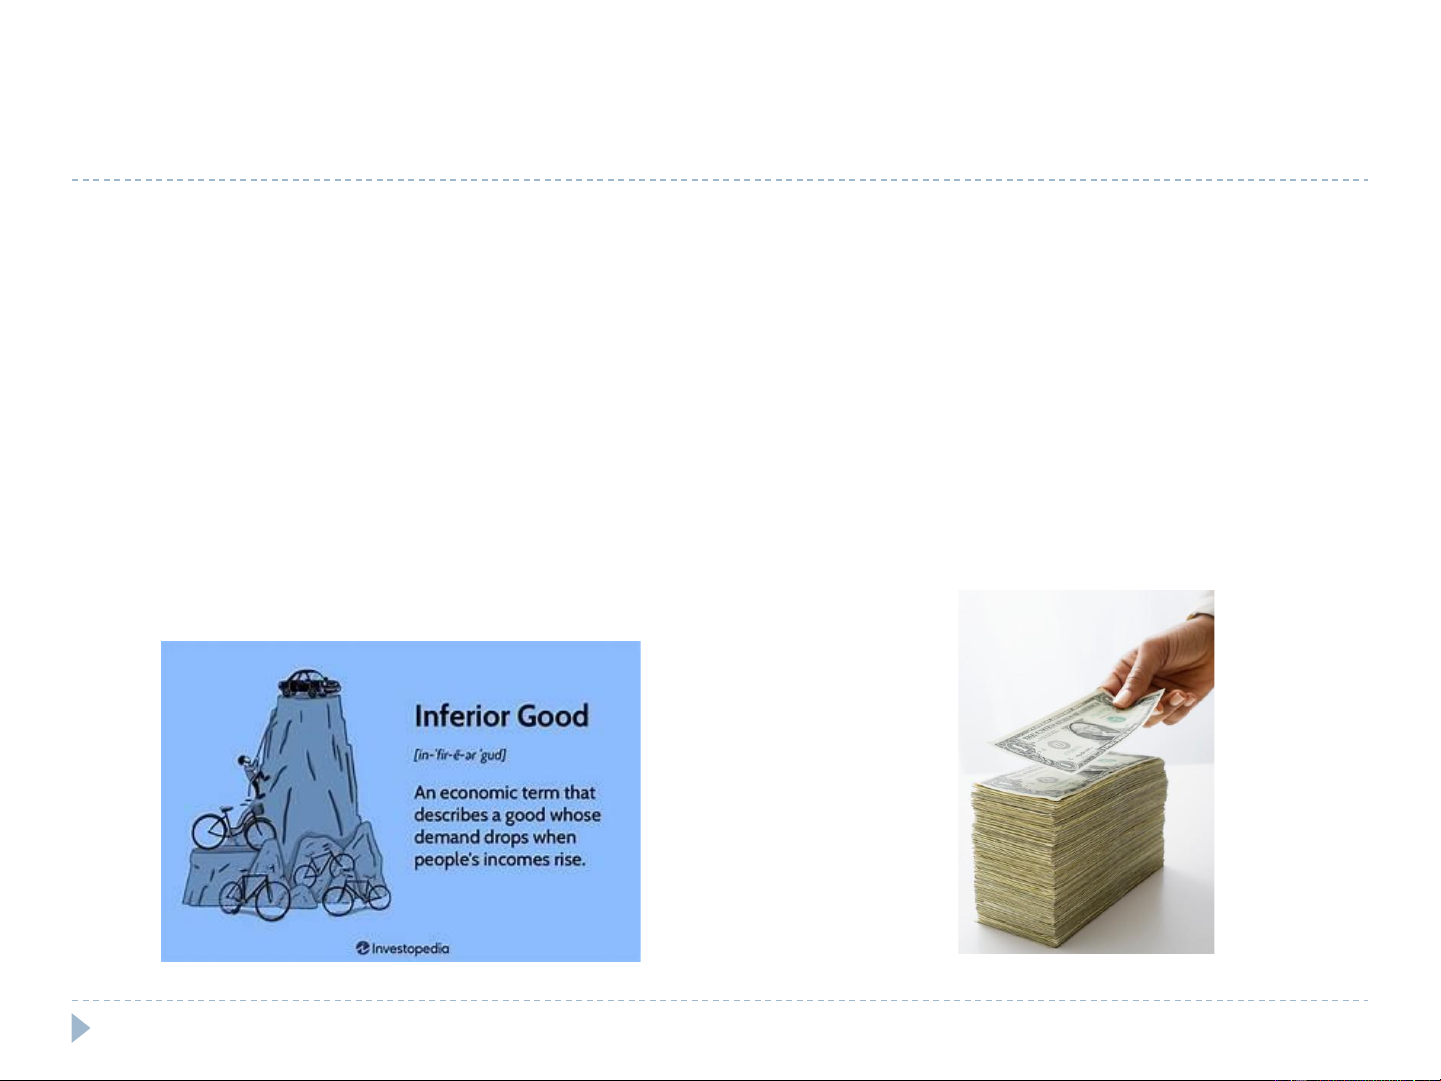
Normal good: other things constant, an increase in income makes increase in demand Necessary goods Luxury goods
Inferior good: Other things constant, an increase in income makes decrease in demand 12 @KieuMinh.MSc 12 Changes in demand
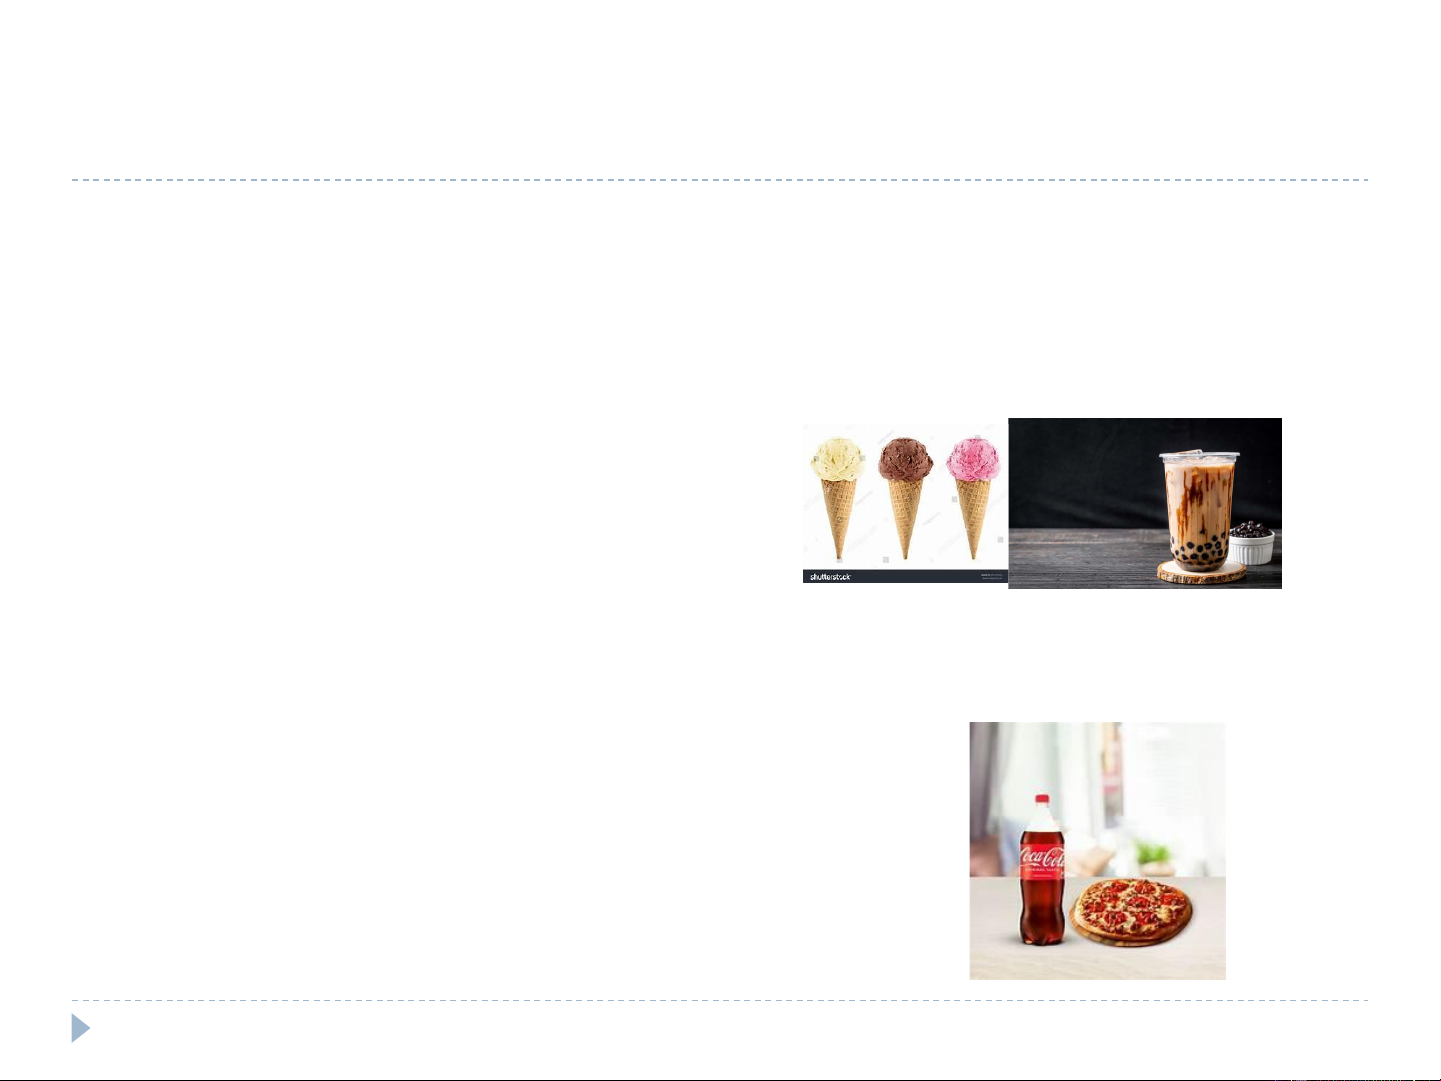
2. Prices of related goods (Py) Substitutes - two goods
An increase in the price of one leads to an increase in the demand for the other Complements – two goods
An increase in the price of one leads to a decrease in the demand for the other 13 @KieuMinh.MSc 13 Changes in demand 3. Tastes (T)
Change in tastes – changes the demand
4. Expectations - about the future (income, prices) (E) Affect current demand
5. Number of buyers – increase (N) Market demand - increases 14 @KieuMinh.MSc 14
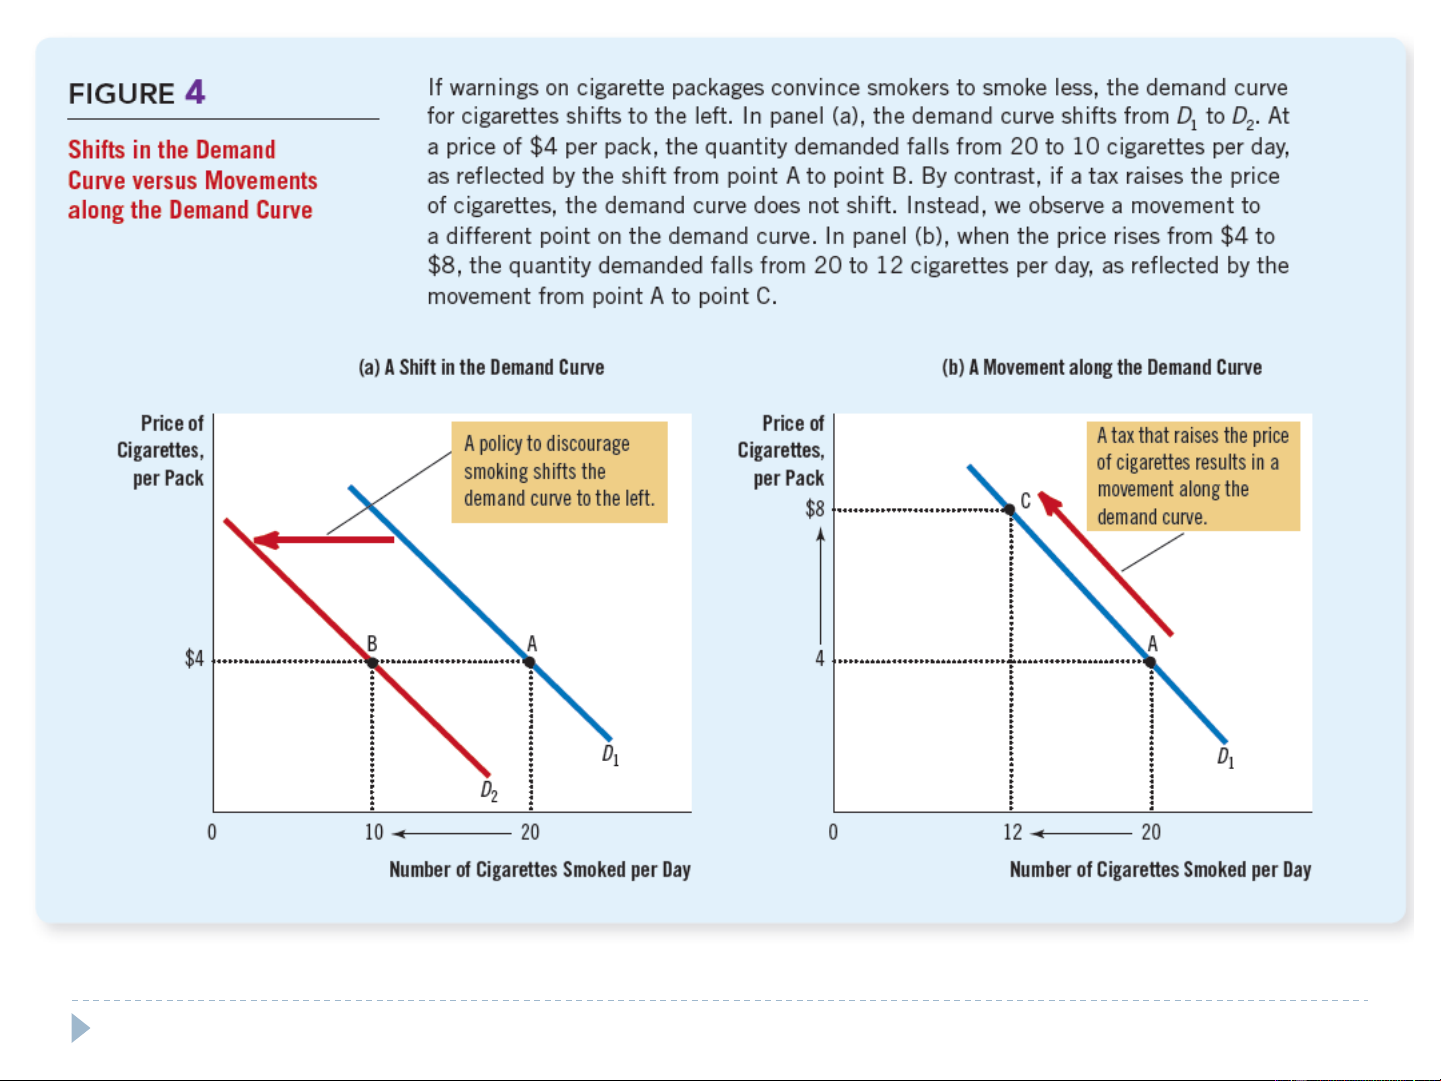
Mankiw (2019), Principles of Microeconomics, 9th edition, p86 15 Quick Quiz Self study:
Study Guide: Chapter 4 (True/False questions: 1 ~ 6) 2.2 SUPPLY Sellers determine supply... 17 @KieuMinh.MSc Supply
Supply shows the willingness to sell (WTS) of sellers for a
goods (willing and be able to sell)
Quantity supplied (Qs): Amount of a good that sellers are willing and able to sell
Law of supply: Other things equal, when the price
(P) of the good rises quantity supplied (Qs) of a good rises
Relationship between: P and QS can be shown as:
Supply schedule - a table: shows the quantity supplied at each price
Supply curve - a graph: Upward sloping curve
Supply function: QS = g (P) 18 @KieuMinh.MSc 18
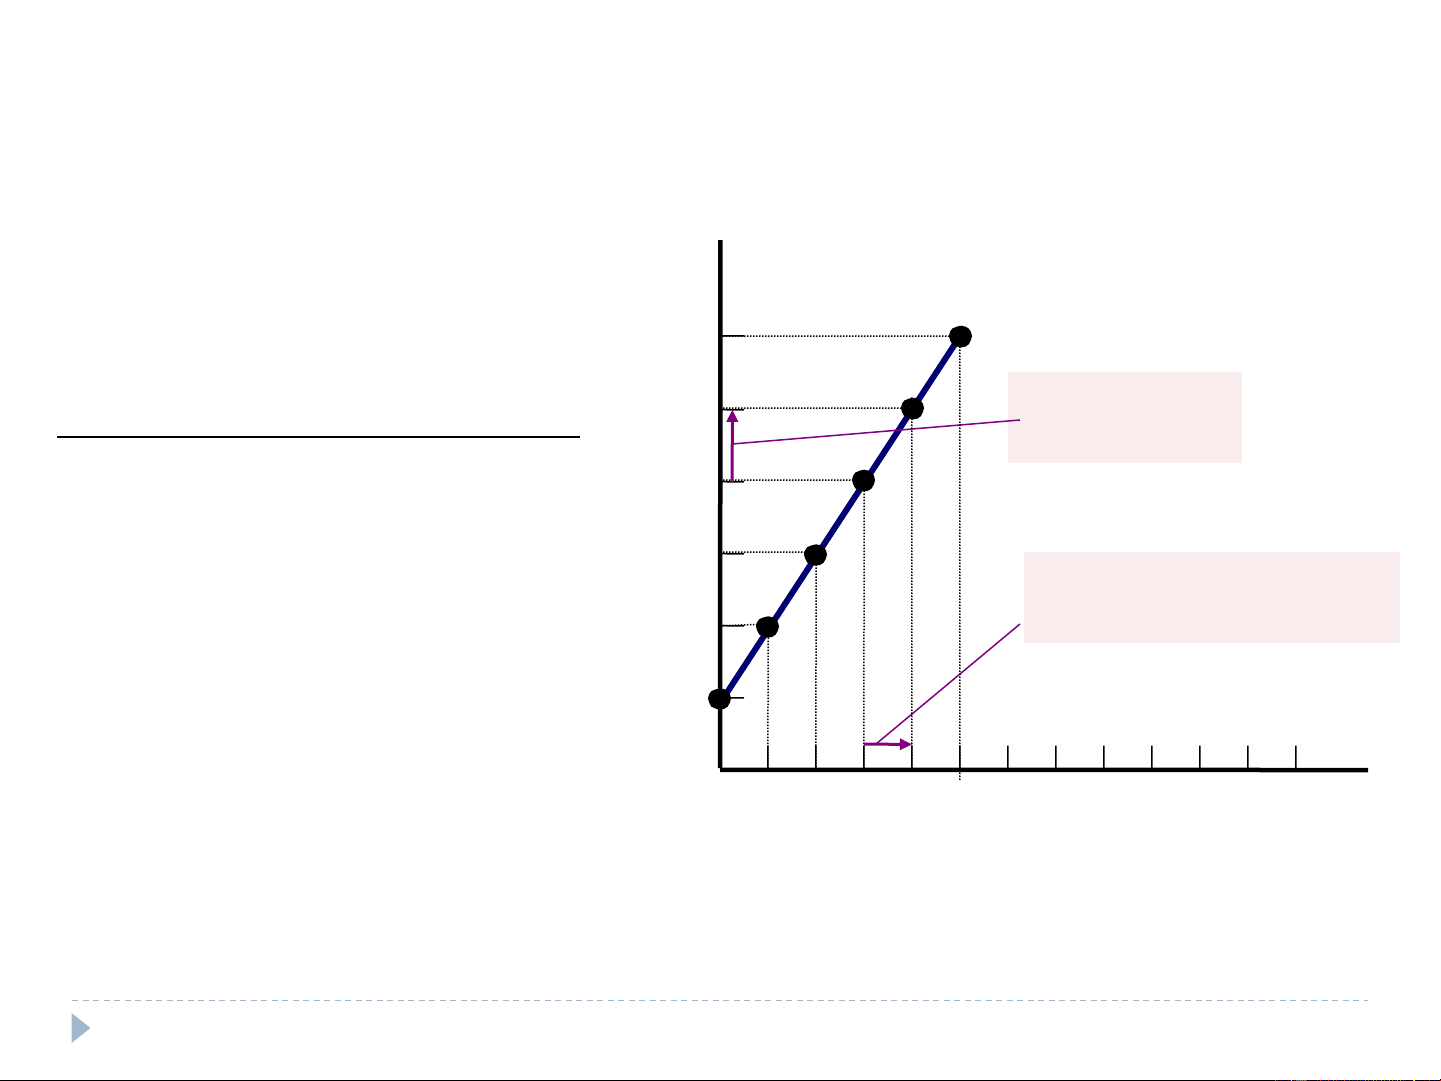
Ben’s supply schedule and supply curve Price of Ice-Cream Cones Supply curve Price of Quantity $3.00 Ice-cream ofCones cone supplied 2.50 1. An increase in price . . . $0.00 0 cones 2.00 0.50 0 1.00 1 1.50 2. . . . increases quantity 1.50 2 1.00 of cones supplied. 2.00 3 2.50 4 0.50 3.00 5 0 1 2 3 4 5 6 7 8 9 10 11 12 Quantity of Ice-Cream Cones
The supply function of Ben for ice-cream Cones is:
QS = g (P) =………………………………………………………… 19 19
Individual Supply and Market Supply
Individual supply: Supply of one seller
Market supply: Sum of the supplies of all sellers for a good or service Market supply curve
Sum - individual supply curves horizontally Price of ice-cream cone Ben Jerry Market $0.00 0 + 0 = 0 0.50 0 0 0 1.00 1 0 1 1.50 2 2 4 2.00 3 4 7 2.50 4 6 10 3.00 5 8 13 20 @KieuMinh.MSc 20