Chapter 3 - Statistics for Business | Trường Đại học Quốc tế, Đại học Quốc gia Thành phố HCM
Chapter 3 - Statistics for Business | Trường Đại học Quốc tế, Đại học Quốc gia Thành phố HCM được sưu tầm và soạn thảo dưới dạng file PDF để gửi tới các bạn sinh viên cùng tham khảo, ôn tập đầy đủ kiến thức, chuẩn bị cho các buổi học thật tốt. Mời bạn đọc đón xem!
Môn: Statistics for Business (BAO8OIU) 43 tài liệu
Trường: Trường Đại học Quốc tế, Đại học Quốc gia Thành phố Hồ Chí Minh 1.9 K tài liệu
Tác giả:

Preview text:
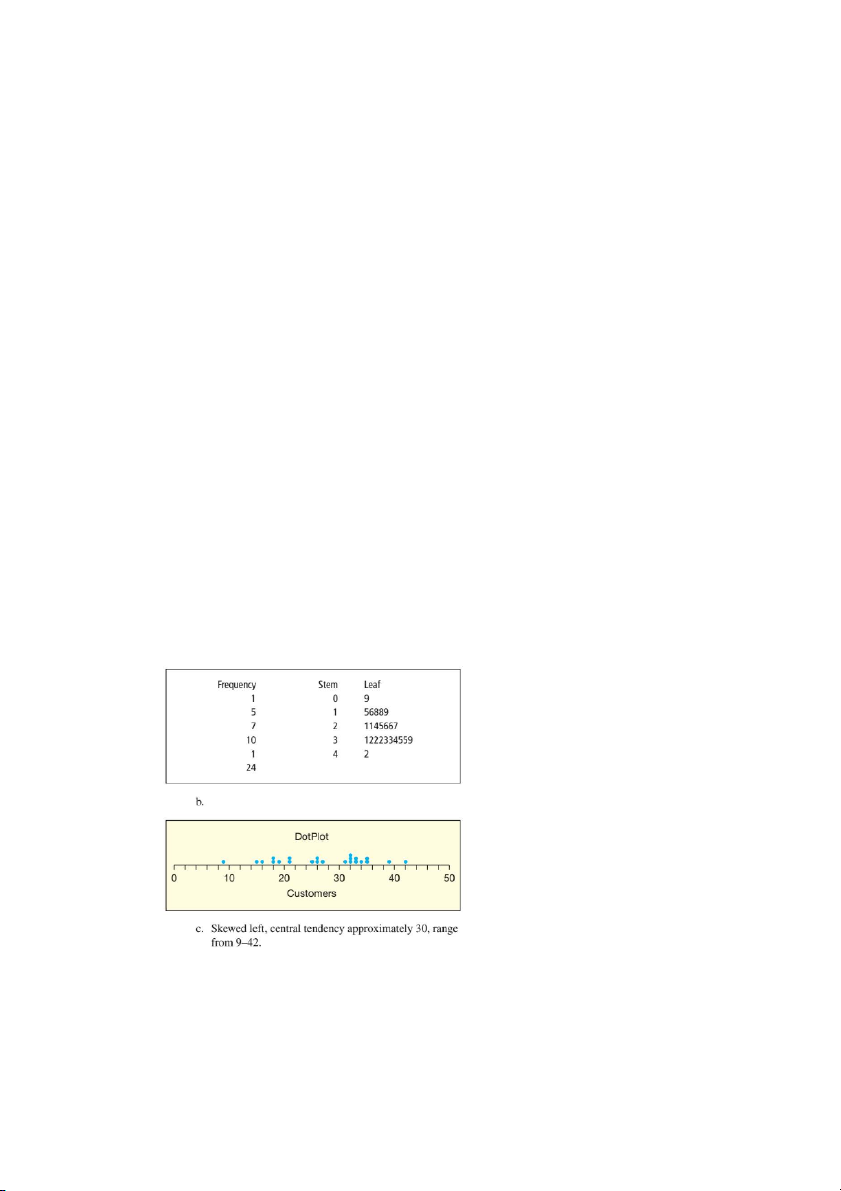
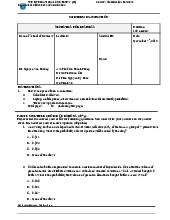
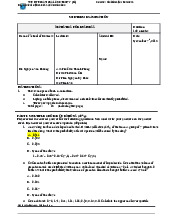
1. (a) Make a stem-and-leaf plot for these 24 observations on the number of customers who
used a downtown CitiBank ATM during the noon hour on 24 consecutive workdays.
(b) Make a dot plot of the ATM data. (c) Describe these two
displays. (Hint: Refer to center, variability, and shape.) CitiBank 39 32 21 26 19 27 32 25 18 26 34 18 31 35 21 33 33 9 16 32 35 42 15 24
2. (a) Make a frequency distribution and histogram for the monthly off-campus rent paid by
30 students. (b) Repeat the exercise, using a different number of bins. Which is preferred? Why? Rents 730 730 730 930 700 570 690 1,030 740 620 720 670 560 740 650 660 850 930 600 620 760 690 710 500 730 800 820 840 720 700
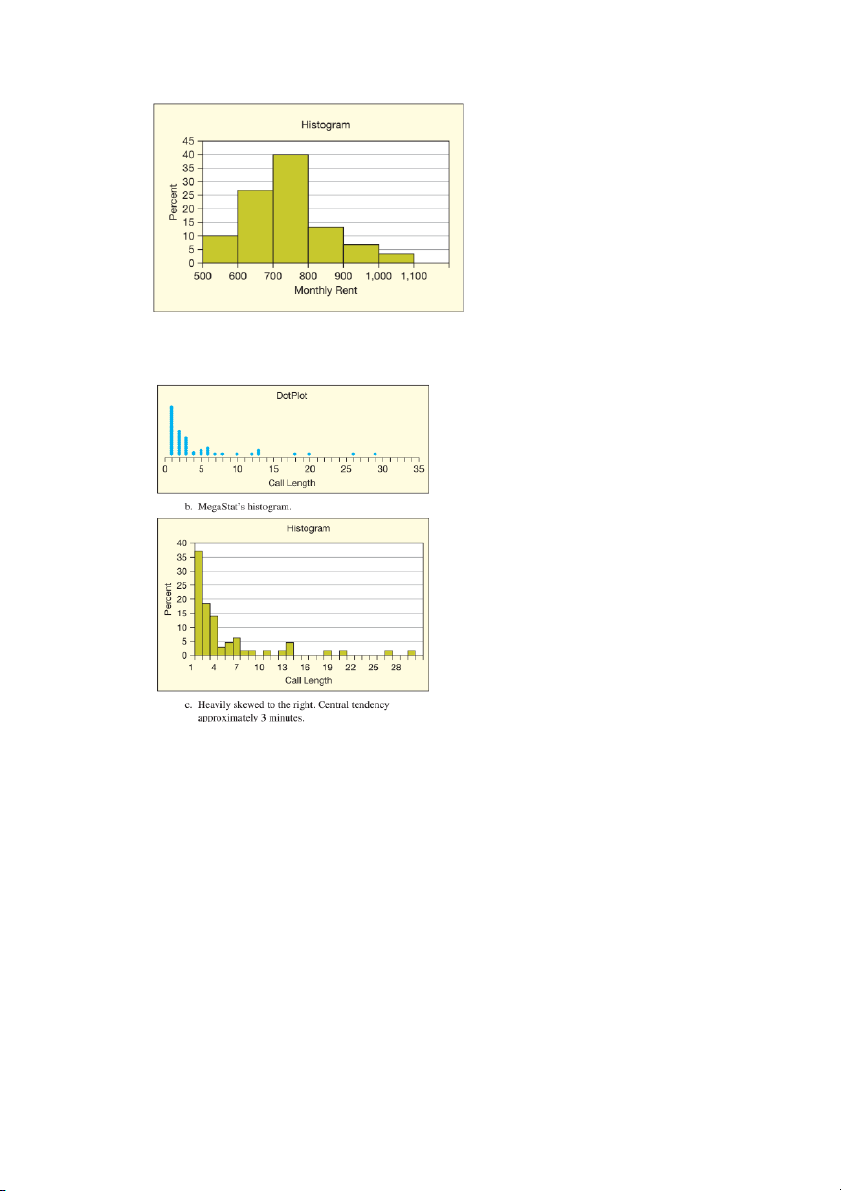
3. An executive’s telephone log showed the following data for the
length of 65 calls initiated during
the last week of July. (a) Prepare a dot plot. (b) Prepare a
frequency distribution and histogram
(you may either specify the bins yourself or use automatic bins). (c) Describe the distribution, based on these displays. CallLength 1 2 10 5 3 3 2 20 1 1 6 3 13 2 2 1 26 3 1 3 1 2 1 7 1 2 3 1 2 12 1 4 2 2 29 1 1 1 8 5 1 4 2 1 1 1 1 6 1 2 3 3 6 1 3 1 1 5 1 18 2 13 13 1 6
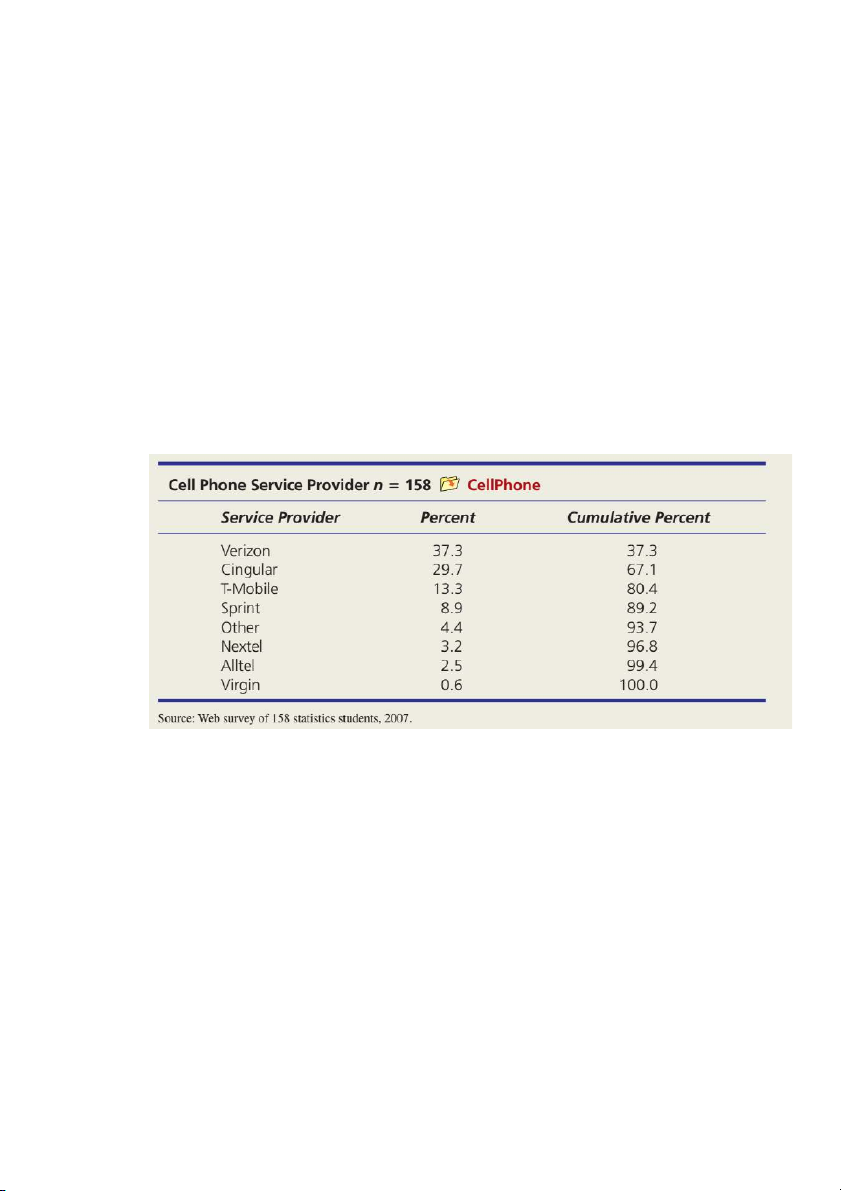
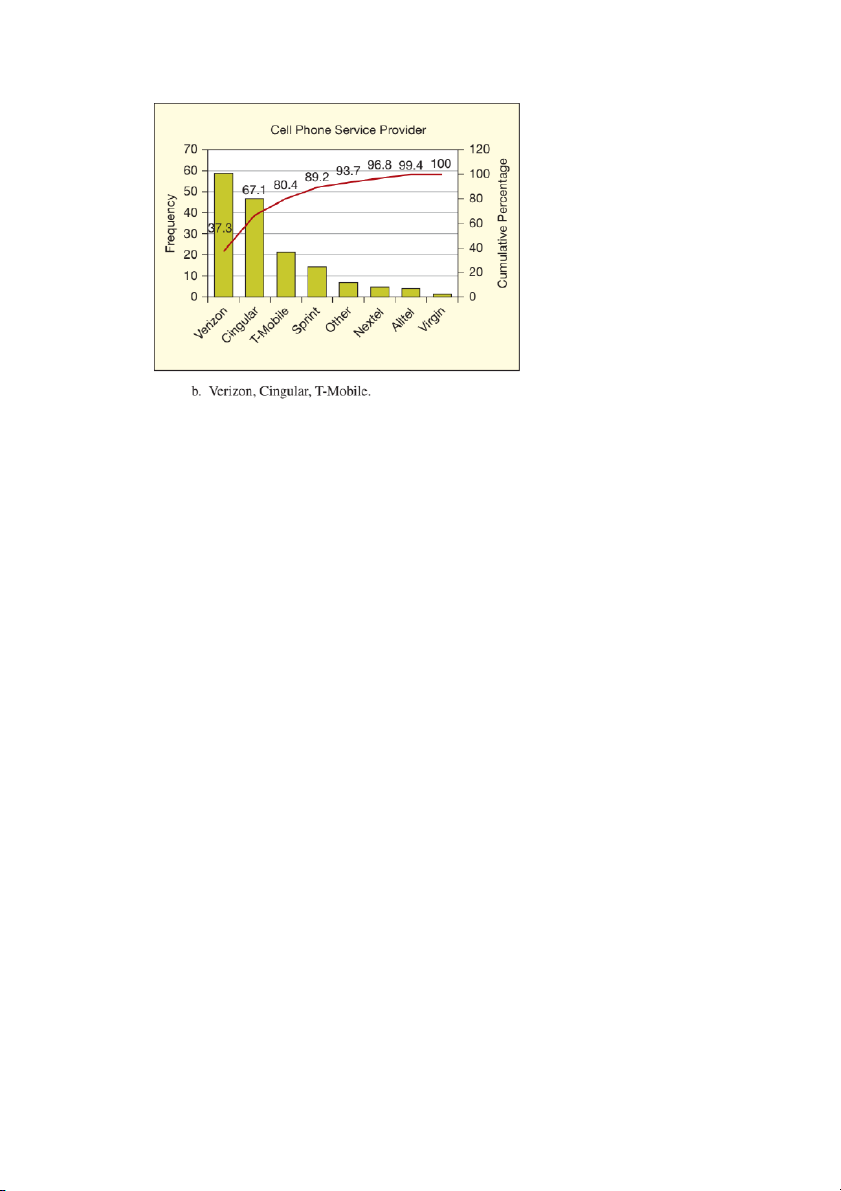
4. (a) Use Excel to prepare a Pareto chart of the following data. (b) Which three service providers
account for approximately 80 percent of all responses? Answer : chapter 3: 1. a.
2. Sturges’ Rule suggests about 6 bins. Slight right skew. 3. Megastat’ s Dotplot 4. A.
Tài liệu liên quan:
-
Đề thi giữa kỳ học phần Statistics for Business năm 2015 | Trường Đại học Quốc tế, Đại học Quốc gia Thành phố Hồ Chí Minh
323 162 -
Đề thi giữa kỳ học phần Statistics for Business có đáp án | Trường Đại học Quốc tế, Đại học Quốc gia Thành phố Hồ Chí Minh
385 193 -
Đề thi giữa kỳ học phần Statistics for Business năm 2019 | Trường Đại học Quốc tế, Đại học Quốc gia Thành phố Hồ Chí Minh
271 136 -
Đề thi giữa kỳ học phần Statistics for Business | Trường Đại học Quốc tế, Đại học Quốc gia Thành phố Hồ Chí Minh
283 142 -
Bài tập tiểu luận nhóm học phần Statistics for Business | Trường Đại học Quốc tế, Đại học Quốc gia Thành phố Hồ Chí Minh
293 147