Confidence Intervals - Statistics for Business | Trường Đại học Quốc tế, Đại học Quốc gia Thành phố HCM
Confidence Intervals - Statistics for Business | Trường Đại học Quốc tế, Đại học Quốc gia Thành phố HCM được sưu tầm và soạn thảo dưới dạng file PDF để gửi tới các bạn sinh viên cùng tham khảo, ôn tập đầy đủ kiến thức, chuẩn bị cho các buổi học thật tốt. Mời bạn đọc đón xem!
Môn: Statistics for Business (BAO8OIU) 43 tài liệu
Trường: Trường Đại học Quốc tế, Đại học Quốc gia Thành phố Hồ Chí Minh 2 K tài liệu
Tác giả:


Preview text:
International University IU
STATISTICS FOR BUSINESS [IUBA] CHAPTER 06 CONFIDENCE INTERVALS
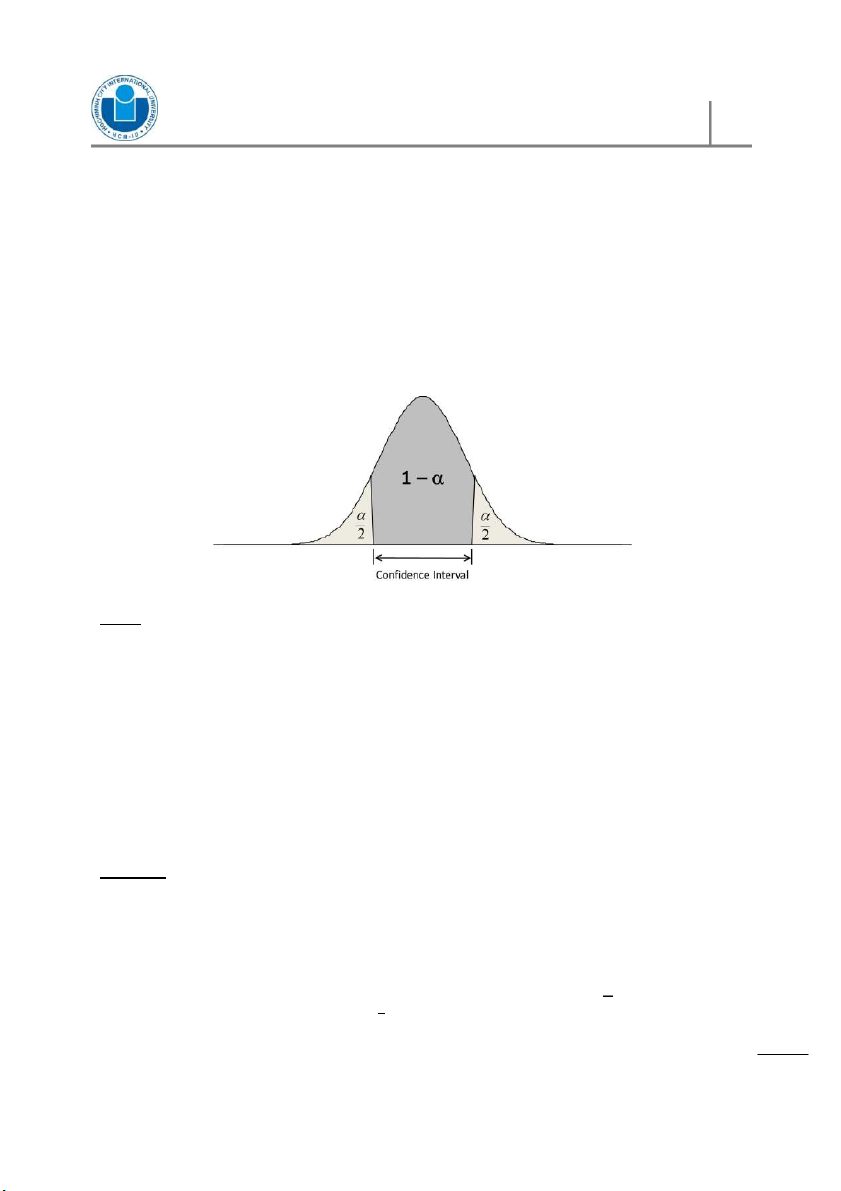
A confidence interval is a range of numbers believed to include an unknown population
parameter. Associated with the interval is a measure of the confidence we have that the
interval does indeed contain the parameter of interest. Note: ls a
When sampling is from the same population, using a fixed sample size, the higher the v er
confidence level, the wider the interval. Int
When sampling is from the same population, using a fixed confidence level, the larger e
the sample size n, the narrower the confidence interval. idenc nf o
PART I – Perform a confidence intervals for population mean : C 6 0 er
Note: The population is normally distributed (or the population is assumed normal) pt ha
Case 01: If the following two conditions are fulfilled: C ss | e
The population from which the sample is selected is normally distributed. sin
The population standard deviation is known (where the sample size is u B r
either small, < 30, or large, ≥ 30)
then we use and standard deviation √ ⁄ . tistics fo a St
Powered by statisticsforbusinessiuba.blogspot.com 1 International University IU
= ± √
Case 02: If the following three conditions are fulfilled:
The population from which the sample is selected is normally distributed.
The population standard deviation is unknown
The sample size is small, < 30.
then we use , where = − 1 standard deviation √
⁄ where is sample standard deviation.
= ± ,√
Case 03: If the following three conditions are fulfilled:
The population from which the sample is selected is normally distributed.
The population standard deviation is unknown.
The sample size is large, ≥ 30. ls a v
then we use er Int e standard deviation √
⁄ where is sample standard deviation. idenc nf
= ± o √ : C 6 0
(Whenever the population is normally distributed and the population standard deviation er
is not known, it would be essential to use the distribution with − 1 degrees of pt
freedom to perform a confidence interval. However, as increases, the t distribution ha C
approaches Z distribution. Thus, for Case 3 that the sample size is large, ≥ 30, the Z s |
distribution could be used in place of the t distribution) ines us B r tistics fo a St
Powered by statisticsforbusinessiuba.blogspot.com 2 International University IU Example 1.1: (Case 01)
- The population is normally distribution.
- The population standard deviation is known (where the sample size is
either small, < 30, or large, ≥ 30). PROBLEM:
A real estate agent needs to estimate the average value of a residential property of a
given size in a certain area. The real estate agent believes that the standard deviation
of the property values is = $5,500.00 and that property values are approximately
normally distributed. A random sample of 16 units gives a sample mean of
$89,673.12. Give a 95% confidence interval for the average value of all properties of this kind. SOLUTION:
= 5,500.00, = 16, = 89,673.12
= 0.95⁄2 = 0.475, = 1.96
Hence, 95% = ± /√
= 89,673.12 ± 1.965,500.00/√16 = [86,978.12, 92,368.12] ls a Example 2.2: (Case 02) v er
- The population is normally distribution. Int
- The population standard deviation is known. e
- The sample size is small, < 30. idenc nf PROBLEM:
The manufacturer of batteries used in small electric appliances wants to estimate the o
average life of a battery. A random sample of 12 batteries yields = 34.2 hours and s : C 6
= 5.9 hours. Give a 95% confidence interval for the average life of a battery. 0 er pt SOLUTION:
= 34.2, = 5.9, = 12 ha C
We assume that the population is normally distributed. s |
= − 1 = 12 − 1 = 11 ines us B
1 − = 0.95, = 0.05, 2 ⁄ = 0.05 2 ⁄ = 0.025 r
, = ,. = 2.201 tistics fo a St
Powered by statisticsforbusinessiuba.blogspot.com 3 International University IU
Hence, 95% = ± , /√
= 34.2 ± 2.2015.9/√12 = [30. 45, 37.45] Example 2.3: (Case 03)
- The population is normally distribution.
- The population standard deviation is known.
- The sample size is large, ≥ 30. PROBLEM:
To aid in planning the development of a tourist shopping area, a state agency wants
to estimate the average dollar amount spent by a tourist in an existing shopping
area. A random sample of 56 tourists gives = $258 and s = $85. Give a 95%
confidence interval for the average amount spent by a tourist at the shopping area. SOLUTION:
= 258, = 85, = 56
We assume that the population is normally distributed.
Since the sample size would be considered to be ‘large enough’, ls
could be used in place of . a v er
= 0.95⁄2 = 0.475, = 1.96 Int e
Hence, 95% = ± /√ idenc nf o = 258 ± 1.9685/√56 : C 6 0 = [235.74, 280.26] er pt ha C s |
PART II – Perform a confidence intervals for population proportion ines
Recall our large-sample rule of thumb: For estimating , a sample is considered large enough us B
when both ∙ and ∙ ( −
) are greater than 5. (We guess the value of when r
determining whether them sample is large enough. As a check, we may also compute and
(1 − ) once the sample is obtained). tistics fo a St
Powered by statisticsforbusinessiuba.blogspot.com 4 International University IU
In order to perform a confidence interval, we always use:
− ; and
standard deviation [(1 − )]⁄ where is sample proportion.
= ± ( − )
Example 2.1: (Case of performing a confidence interval for population proportion) PROBLEM:
A maker of portable exercise equipment, designed for health-conscious people who
travel too frequently to use a regular athletic club, wants to estimate the proportion
of traveling business people who may be interested in the product. A random sample
of 120 traveling business people indicates that 28 may be interested in purchasing
the portable fitness equipment. Give a 95% confidence interval for the proportion of
all traveling business people who may be interested in the product. SOLUTION:
= / = 28/ 120= 7/30, = 120
We assume that the population is normally distributed. ls a v er
= 0.95⁄2 = 0.475, = 1.96 Int e
Hence, 95% = ± [(1 − )]⁄ idenc nf = (7 3
⁄ 0) ± 1.96[(7/30)(23/30)]/120 o : C 6 0 = [0.1513, 0.3153] er pt ha C s | ines us B r tistics fo a St
Powered by statisticsforbusinessiuba.blogspot.com 5 International University IU
PART III – Perform a confidence intervals for population variance
In order to perform a confidence intervals for the population variance, we must learn to use a
new probability distribution: the − . We denote the chi-square distribution by .
The chi-square distribution is the probability distribution of the sum of several
independent, squared standard normal random variables.
As the sum of squares, the chi-square random variable cannot be negative and is therefore
bounded on the left by zero. The resulting distribution is skewed to the right.
The mean of a chi-square distribution is equal to the degrees-of-freedom parameter .
The variance of a chi-square distribution is equal to twice the number of degrees of freedom.
Note: The population is normally distributed (or the population is assumed normal).
In order to perform a confidence interval, we always use ℎ − ( )
( − 1) ( − 1)
= , ls a v er
Example 3.2: (Case of performing a confidence intervals for population variance) Int e PROBLEM:
In an automated process, a machine fills cans of coffee. If the average amount filled is
different from what it should be, the machine may be adjusted to correct the mean. If the idenc
variance of the filling process is too high, however, the machine is out of control and nf o
needs to be repaired. Therefore, from time to time regular checks of the variance of the : C
filling process are made. This is done by randomly sampling filled cans, measuring their 6 0
amounts, and computing the sample variance. A random sample of 30 cans gives an er
estimate s2 = 18,540. Give a 95% confidence interval for the population variance . pt ha C SOLUTION: ss | e sin u B r tistics fo a St
Powered by statisticsforbusinessiuba.blogspot.com 6 International University IU
We assume that the population is normally distributed. = 18,540, = 30
= − 1 = 30 − 1 = 29 1 − = 0.95, = 0.05 ⁄ 2= 0.05 2
⁄ = 0.025, . = 45.7
1 − ⁄2 = 1 − 0.025 = 0.975, = 16.0 .
Hence, 95% = [( − 1)] , [( − 1)]
= [29(18,540)]/45.7, [29(18,540)]/16.0 = [11.765, 33 ,604]
PART III - Determining the minimum sample sizes needed for estimation.
To find the minimum sample size, first we must give answers to the following three questions: ls a
Q1. How close do you want your sample v estimate to be to the unknown er Bound parameter? Int e
Q2. What do you want the confidence level
to be so that the distance between the Confidence level (− ) idenc
estimate and the parameter is less than nf or equal to ? o
Q3. What is your estimate of the variance Population variance : C 6 (or standard deviation) of the 0
Or, population standard deviation population in question? er pt ha C
In the case of the population mean, is the half-width of a (1 − )100% s |
confidence interval for , and therefore ines us B = r √ tistics fo a St
Powered by statisticsforbusinessiuba.blogspot.com 7 International University IU
Minimum required sample size in estimating the population mean is: = /
In the case of the population proportion, is the half-width of a (1 − )100%
confidence interval for , and therefore
= ( − )
Minimum required sample size in estimating the population proportion is: [( − )] = / Example 4.1:
(Case of determining the minimum sample size in estimating population mean) PROBLEM:
A market research firm wants to conduct a survey to estimate the average amount ls
spent on entertainment by each person visiting a popular resort. The people who plan a v
the survey would like to be able to determine the average amount spent by all people er
visiting the resort to within $120, with 95% confidence. From past operation of the Int
resort, an estimate of the population standard deviation is = $400. What is the e minimum required sample size? idenc nf SOLUTION:
The minimum required sample size is o / : C = 6 0 er
We know that = 120, and is estimated at 400 = 160,000. Since we want 95% pt confidence, ha
/ = 1.96. Using the equation, we get C s | (1.96)160,000 = 120 = 42.684 ines us B
Therefore, the minimum required sample size is 43 people (we cannot sample 42.684 r
people, so we go to the next higher integer). tistics fo a St
Powered by statisticsforbusinessiuba.blogspot.com 8 International University IU Example 4.2:
(Case of determining the minimum sample size in estimating population mean) PROBLEM:
The manufacturer of a sports car wants to estimate the proportion of people in a
given income bracket who are interested in the model. The company wants to know
the population proportion to within 0.10 with 99% confidence. Current company
records indicate that the proportion may be around 0.25. What is the minimum
required sample size for this survey? SOLUTION:
The minimum required sample size is [(1 − )] = /
We know that = 0.10, and is estimated at 0.25. Since we want 99% confidence,
/ = 2.576. Using the equation, we get (2.576)(0.25)(0.75) = 0.10 = 124.42
Therefore, the minimum required sample size is 125 people (we cannot sample
124.42 people, so we go to the next higher integer). ls a v er Int e idenc nf o : C 6 0 er pt ha C s | ines us B r tistics fo a St
Powered by statisticsforbusinessiuba.blogspot.com 9
Tài liệu liên quan:
-
Đề thi giữa kỳ học phần Statistics for Business năm 2015 | Trường Đại học Quốc tế, Đại học Quốc gia Thành phố Hồ Chí Minh
337 169 -
Đề thi giữa kỳ học phần Statistics for Business có đáp án | Trường Đại học Quốc tế, Đại học Quốc gia Thành phố Hồ Chí Minh
408 204 -
Đề thi giữa kỳ học phần Statistics for Business năm 2019 | Trường Đại học Quốc tế, Đại học Quốc gia Thành phố Hồ Chí Minh
290 145 -
Đề thi giữa kỳ học phần Statistics for Business | Trường Đại học Quốc tế, Đại học Quốc gia Thành phố Hồ Chí Minh
300 150 -

Bài tập tiểu luận nhóm học phần Statistics for Business | Trường Đại học Quốc tế, Đại học Quốc gia Thành phố Hồ Chí Minh
305 153