Data 8 Fall 2024 Midterm Exam: Foundations of Data Science Insights. Môn Khai phá dữ liệu (UET) | Trường Đại học Công nghệ, Đại học Quốc gia Hà Nội.
Data 8 Fall 2024 Midterm Exam: Foundations of Data Science Insights. Môn Khai phá dữ liệu (UET) | Trường Đại học Công nghệ, Đại học Quốc gia Hà Nội.
Tài liệu gồm 15 trang giúp bạn tham khảo, củng cố kiến thức và ôn tập đạt kết quả cao trong kỳ thi sắp tới. Mời bạn đọc đón xem!
Môn: Khai phá dữ liệu (UET) 7 tài liệu
Trường: Trường Đại học Công nghệ, Đại học Quốc gia Hà Nội 824 tài liệu
Tác giả:


Preview text:
lOMoAR cPSD| 59735516 Data C8Fall 2024
Foundations of Data Science MidtermExam
7:10-9:00pm, Friday, October 18
Berkeley Honor Code [1 point]
“As a member of the UC Berkeley community, I act with honesty, integrity, and respect for others.” Initials: Full Name: Student ID Number: Name of person to your left: Name of person to your right:
GSI/TAs Name (Write N/A if in self-service lab): INSTRUCTIONS
• Do not open the exam until you are instructed to do so.
• Write your initials at the top of each page.
• There are six (6) questions and 16 pages on this exam, including cover page. Read the instructions and
point values carefully for each question, part and subpart.
• Where relevant, you may assume that all necessary Python modules have been imported. • You may
only have with you: a pencil(s), an eraser(s), your student ID, a water bottle, and your midterm reference
sheet, unless you have received pre-approved accommodations otherwise. • If you need to use the
restroom, bring your phone, exam, reference sheet, and student ID to the front of the room. Question Types
For questions with circular bubbles, you should fill in exactly one choice.
⃝ You must choose either this option lOMoAR cPSD| 59735516 Data 8 Fall 2024 Midterm Initials:
⃝ Or this one, but not both!
For questions with square checkboxes, you may fill in multiple choices. □ You could select this choice.
□ You could select this one too!
1 Multiple Choice [32 points]
For each of the following questions, fill in the bubble/square(s) corresponding to the correct answers.
a. (5 points) When working with a new dataset, which of the three facets of data science should you approach first? ⃝ Inference ⃝ Exploration ⃝ Prediction
b. (5 points) Torin performs an A/B test on a dataset and concludes that the A and B groups are different from
one another. What must be true for him to make the claim that being in one group versus the other causes the difference?
⃝ His p-value cutoff must be equal to or lower than 5%.
⃝ His data must be collected in a mechanism/context that allows him to make a causal claim from it.
⃝ He has made a visualization of the distributions between the two groups that shows a clear difference.
⃝ He needs a large enough sample size.
c. (4 points) What allowed John Snow to infer that the water supply was the cause of the frequent cholera
outbreaks in London? Select all that apply.
□ Snow saw that most of the people who caught cholera received water from the Broad St. pump. □
Snow randomly assigned people to drink from the Lambeth and S&V water supplies and recorded
the incidence of cholera among people drinking from each supply.
□ Snow saw that people who either received Lambeth or S&V water were not too different from one
another in any aspect. He recorded the incidence of cholera among people drinking from each supply
and saw a higher rate of cholera among those who drank from the S&V supply. □ None of the above.
d. (4 points) True or False: Jolin rolls a fair, ten-sided die fifteen times. There may be some faces of the die that
do not appear in Jolin’s empirical distribution of the fifteen die rolls. ⃝ True ⃝ False
e. (3 points) Which of the following procedures cross-classifies data in a table with at least two variables? lOMoAR cPSD| 59735516 Data 8 Fall 2024 Midterm Initials: Select all that apply.
□ Creating a two-variable group table □ Creating a pivot table □ Creating a joined table
□ Creating two separate, one-variable group tables
f. (3 points) What will be output to the screen once the following Python expression runs? 3 * 8 + 2 ** 2 - 2 ⃝ 26 ⃝ 25 ⃝ 1 ⃝ 298
⃝ The correct answer is not here.
g. (3 points) How many rows and columns will my table have once the following Python code runs?
my_table = Table().with_columns(‘letters’, make_array(‘a’,‘b’,‘c’),
‘numbers’, make_array(1,2,3))
my_table.select(‘numbers’).where(‘numbers’, are.above(1)) ⃝ 1 row and 2 columns ⃝ 2 rows and 1 column ⃝ 3 rows and 2 columns ⃝ 2 rows and 3 columns
h. (2 points) In a past homework, we discussed a European roulette wheel that has equally sized spaces: one
green, 18 black, and 18 red. On each spin, a white ball lands inside one of these spaces. True or False: If the
wheel is spun a large number of times, the proportion of times that the ball lands inside either a green
space or red space will approach . ⃝ True ⃝ False
i. (2 points) What will be output to the screen once the following Python expression runs?
np.arange(1, 7, 2) + make_array(True, False, True) ⃝ array([2, 3, 6])
⃝ array([‘1True’, ‘3False’,‘5True’])
⃝ An error will occur because the data types do not match. Page 2 lOMoAR cPSD| 59735516 Data 8 Fall 2024 Midterm Initials:
⃝ An error will occur because the array lengths do not match. ⃝ array([2, 7, 3])
j. (1 point) Bowie flips a fair coin four times and gets heads none (zero) of the times. She then decides to test
the hypothesis that the coin is fair against the alternative that it is biased towards the other side of the coin,
tails. Using the number of heads flipped as the test statistic, is Bowie’s result considered statistically significant? ⃝ Yes ⃝ No
⃝ There is not enough information given to determine an answer. lOMoAR cPSD| 59735516 Data 8 Fall 2024 Midterm Initials:
2 Playing with Playlists [19 points]
a. (5 points) Cai links her Spotify account to a music analytics website and is surprised to see she only listens
to 100 songs across 5 genres. The number of songs she listens to by genre is distributed as follows: • 5 Jazz songs • 25 K-pop songs
• 35 OPM (Original Filipino music) songs • 15 R&B songs • 20 Classical songs
(i) (3 points) Cai decides to pick songs randomly without replacement. She gets recommendations
from her friend Ella, who loves OPM and R&B but is very particular about the order of her playlists.
Assuming Cai is still picking from her selection of 100 songs, what is the probability that she will pick
a 3-song playlist in which the first song chosen is R&B, the second is OPM, and the last is R&B? You
may leave your answer as an arithmetic expression.
(ii) (2 points) Cai realizes her friend Ella is neither a K-pop fan nor a Jazz fan! Now selecting songs
randomly with replacement, Cai makes a playlist with 10 songs. What is the probability that at least
one of the songs is something Ella likes (not K-pop or Jazz)? You may leave your answer as an arithmetic expression.
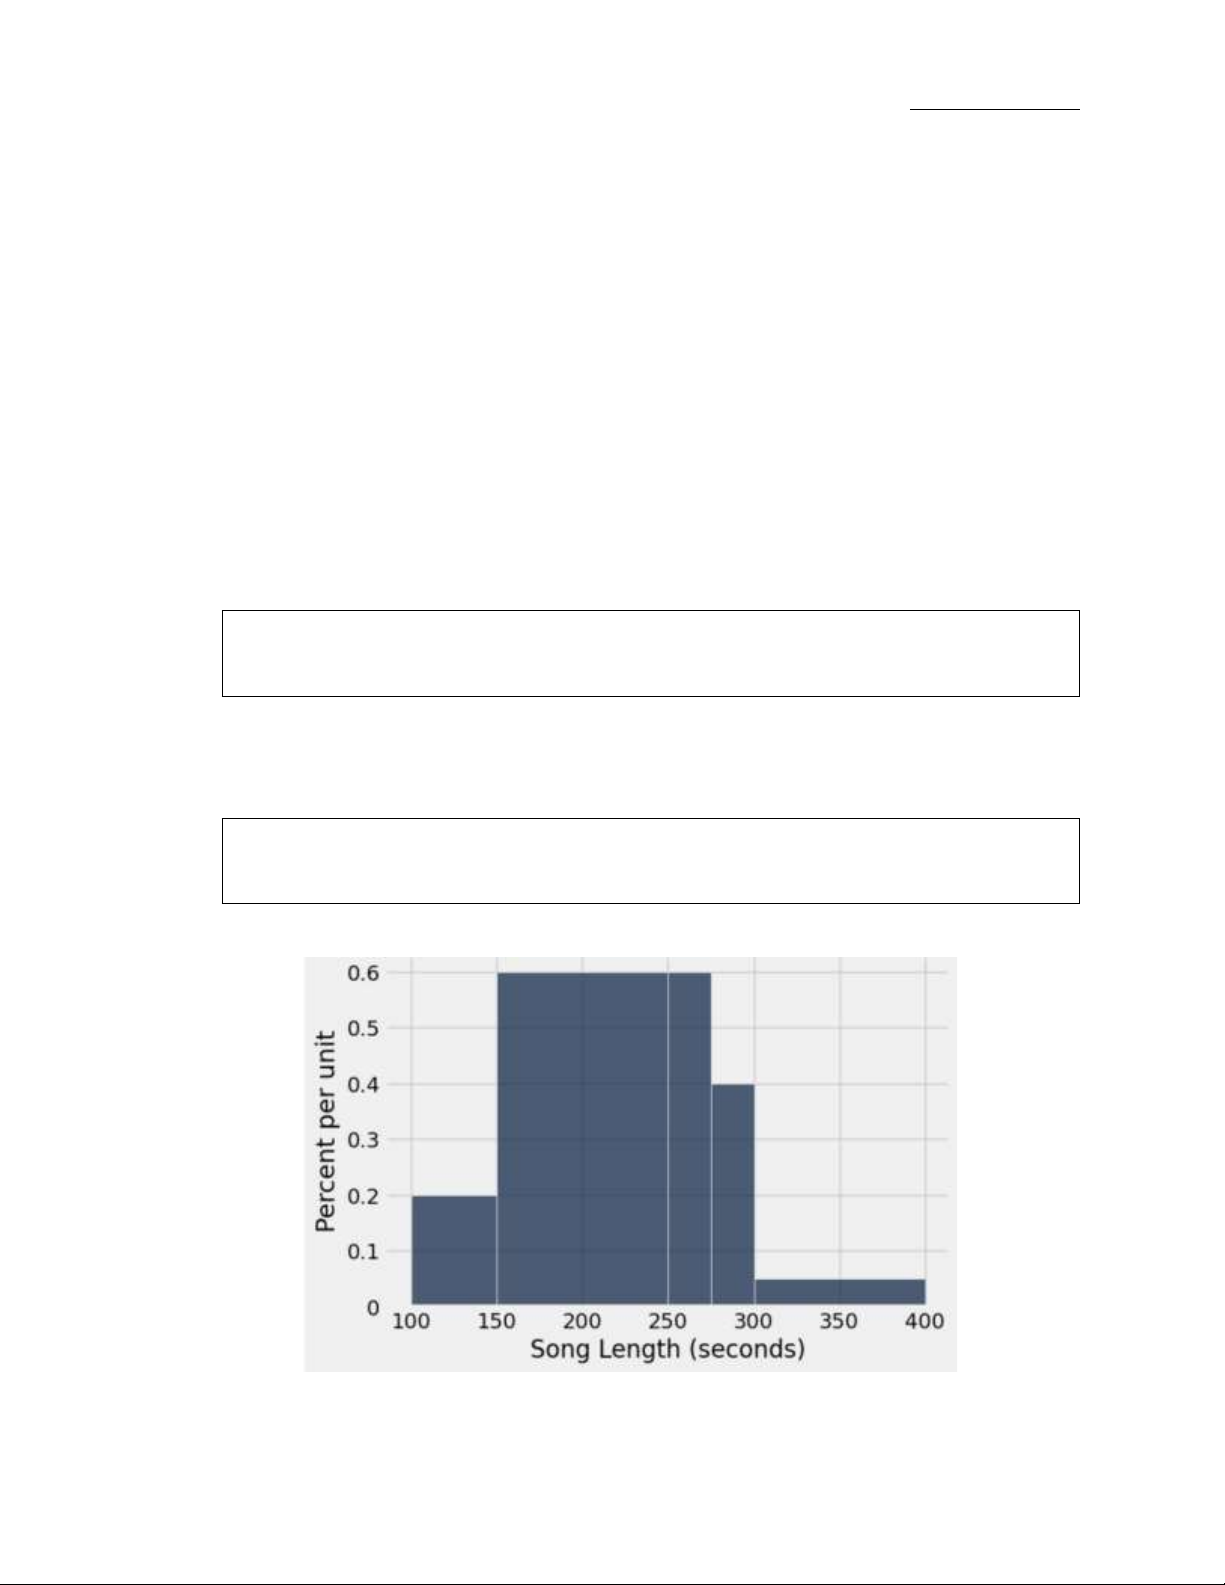
b. (6 points) Cai realizes she plays classical music a lot when she studies. She decides to visualize her classical
songs’ lengths in seconds and creates the following histogram from the 20 classical songs in her playlist: Page 4 lOMoAR cPSD| 59735516 Data 8 Fall 2024 Midterm Initials:
(i) (3 points) Write a new vertical axis label for the histogram based on the variable being visualized.
(ii) (2 points) Based on the histogram that Cai generated using the Table.hist method, which of the
following statements can be concluded? Select all that apply.
□ The percentage of songs in Cai’s 20 classical songs playlist that are less than 150 seconds is
equal to 20 percent. □ The percentage of songs in Cai’s 20 classical songs playlist that are less
than 200 seconds is equal to 40 percent. □ The percentage of songs in Cai’s 20 classical songs
playlist that are less than 250 seconds is equal to 70 percent. □ The percentage of songs in Cai’s
20 classical songs playlist that are longer than 275 seconds is equal to 15 percent.
□ The number of songs in Cai’s playlist that are longer than 250 seconds is equal to 10 songs.
□ The number of songs in Cai’s 20 classical songs playlist that are less than 250 seconds is equal to 14 songs.
(iii) (1 point) Cai wants to recreate the histogram with different bins, but forgets how to do so. Write a
line of code which will access documentation for the Table.hist function in her Jupyter Notebook.
c. (3 points) Bing takes a random sample of 100 different songs in his Spotify library and puts these in a new
playlist. He happens to pick songs only across 5 genres– and the same genres as Cai! His 100 songs are
distributed slightly differently, as follows: • 10 Jazz songs • 30 K-pop songs
• 30 OPM (Original Filipino music) songs • 20 R&B songs • 10 Classical songs
In words, state a test statistic which can be used to test the hypothesis that the distribution of Bing’s songs
in his entire library is the same the distribution of Cai’s 100 songs.
d. (5 points) Cai now creates a new playlist by combining an independent, random sample of classical songs
from the Spotify catalog and an independent, random sample of R&B songs from the Spotify catalog. She
sees that the classical songs sampled are generally longer than the R&B songs sampled. She is a busy
student and doesn’t have the resources to collect all the Spotify data for these music genres, so she wants
to perform a hypothesis test based on these samples to see if the lengths of classical and R&B songs in the population differ. Page 5 lOMoAR cPSD| 59735516 Data 8 Fall 2024 Midterm Initials:
(i) (3 points) Which of the following are valid null hypotheses that Cai can use to test her claim? Select all that apply.
□ The distribution of R&B song lengths in Cai’s playlist is different from the distribution of
classical song lengths in Cai’s playlist.
□ The distribution of all R&B song lengths in the Spotify catalog is the same as the distribution
of all classical song lengths in the catalog, and any observed difference is due to chance.
□ The distribution of classical song lengths in Cai’s playlist is the same as the distribution of
R&B song lengths in Cai’s playlist, and any observed difference is due to chance. □ The
distribution of all R&B song lengths in the Spotify catalog is different from the distribution of
all classical song lengths in the catalog.
(ii) (2 points) Which of the following are valid alternative hypotheses that Cai can use to test her claim? Select all that apply.
□ The distribution of R&B song lengths in Cai’s playlist is different from the distribution of
classical song lengths in the playlist.
□ The distribution of all R&B song lengths in the Spotify catalog is different from the
distribution of all classical song lengths in the Spotify catalog.
□ The distribution of all R&B song lengths in the Spotify catalog is the same as the distribution
of all classical song lengths in the Spotify catalog, and any observed difference is due to chance.
□ The distribution of all R&B songs in the Spotify catalog, on average, contains larger values
than the distribution of all classical song lengths in the Spotify catalog. □ The distribution of all
R&B songs in Cai’s playlist, on average, contains smaller values than the distribution of all
classical song lengths in the Cai’s playlist.
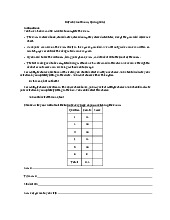
3 Staff Members’ Cupcake Social [15 points]
Sam, Ramisha, and Thomas are planning to hold a cupcake social for Data Science staff members, and have
collected the survey responses for 100 staff members in a table called cupcakes. For this question, assume that
all Data Science staff members in the population have filled out the form. A four-row excerpt of the table is
shown below. It contains the following columns:
• Name (str): The first name of the staff member who filled out the form.
• Attending (bool): Either True if the staff member can attend the social, or False if they cannot
• Preferred Flavor (str): A column containing either the string “Chocolate” or “Vanilla” that indicates the
staff member’s preferred flavor of cupcake. (Assume these are the only two flavor options).
• Num Cupcakes (int): The number of cupcakes the staff member plans to eat at the cupcake social.
Assume that if a student is not attending, Num Cupcakes will always be 0. Name Attending Preferred Flavor Num Cupcakes Aileen False Chocolate 0 Carisma True Chocolate 2 Paul True Vanilla 1 Page 6 lOMoAR cPSD| 59735516 Data 8 Fall 2024 Midterm Initials: Andrew True Vanilla 0 . . (96 rows omitted)
a. (4 points) Write one line of code that evaluates to the total number of cupcakes the staff members plan to eat at the cupcake social. _____(cupcakes._____(_____)) A B C (i ) (2 points)FillinblankA. ( ii ) (1 point)FillinblankB.
( iii ) (1 point)FillinblankC.
b. (3 points) Complete the code below so that the variable majority attending is assigned True if more than 50%
of the staff members who filled out the form plan to attend the cupcake social, and False otherwise.
majority_attending = _________________
c. (3 points) Define a function called flavor to num that takes in a cupcake flavor as a string argument and
returns True if the passed-in string is “Vanilla” and False if it is “Chocolate.”
d. (2 points) Using flavor to num, complete a line of code that will update the cupcakes table to contain a new
column called Vanilla? that contains the value True if the staff member’s preferred flavor is “Vanilla” and
False if it is “Chocolate.” You may assume the flavor to num function in part (c) has been defined properly. Page 7 lOMoAR cPSD| 59735516 Data 8 Fall 2024 Midterm Initials: cupcakes = _________________
e. (2 points) Assume the Vanilla? column has been correctly added to the cupcakes table. Create a new table
(complete the code) called attendance that has two columns: the first column contains the unique values in
the Attending column of the cupcakes table, and the second column contains the proportion of staff
members who prefer vanilla cupcakes.
f. (1 point) Based on the analysis above, Edwin is curious if the distribution of flavor preferences in this
dataset is different for the staff members who plan to attend versus those who don’t. Select the option that
best describes what Edwin should do to answer his question.
⃝ Conduct an A/B test to determine if the two groups (staff members who attended versus those who
didn’t) have the same underlying distribution of flavor preferences.
⃝ Run a randomized controlled experiment to determine if attending has a causal impact on flavor preferences.
⃝ Group the updated cupcakes table by attendance status and take the difference between the
proportions of those that choose Vanilla in each group, amongst the surveyed staff members. 4 Movies [7 points]
The Data 8 staff has been performing data visualizations on films that were released this year. Their data lies in
a table called movies and a four-row excerpt is below. The table contains the following columns:
• Movie (str): The name of the movie.
• Genre (str): The classification of the movie.
• Gross (int): The money made by the movie, in millions of USD.
• Tickets Sold (int): The number of movie tickets sold, in millions. Movie Genre Gross Tickets Sold Inside Out 2 Adventure 653 61 Kung Fu Panda 4 Comedy 193 18 Beetlejuice Beetlejuice Comedy 251 23 Page 8 lOMoAR cPSD| 59735516 Data 8 Fall 2024 Midterm Initials: Bad Boys: Ride & Die Action 192 18 . . (348 rows omitted)
a. (4 points) Conan would like to visualize the number of movies in each genre. Out of the plot types below,
which one is most appropriate? ⃝ Line plot ⃝ Scatter plot ⃝ Bar chart ⃝ Histogram ⃝ Overlaid line plot
⃝ Overlaid scatter ploot plot ⃝ Overlaid bar chart ⃝ Overlaid histogram
b. (2 points) Sahand would like to compare the distributions of tickets sold among different genres of film.
Out of the plot types below, which one is most appropriate? ⃝ Line plot ⃝ Scatter plot ⃝ Bar chart ⃝ Histogram ⃝ Overlaid line plot ⃝ Overlaid scatter plot ⃝ Overlaid bar chart ⃝ Overlaid histogram
c. (1 point) Arfa wants to determine whether there is an association between the amount of money a movie
makes and the number of tickets that it sells. She is deciding between the three visualizations listed below.
Select which one of these three you think is most appropriate. In 2-3 sentences, justify why the other two
plot types you did not choose are less appropriate than the one you chose. ⃝ Bar chart ⃝ Line plot Page 9 lOMoAR cPSD| 59735516 Data 8 Fall 2024 Midterm Initials: Scatterplot
5 It 8n’t my day today [11 points]
Prof Jeremy is sitting in Evans 323 on 4 hours of sleep after grinding Fortnite to get enough V-Bucks to buy the
next Battle Pass. As a result, the code he has been writing today is sloppy. In each of the parts in this question,
you will interact with technically or conceptually incorrect Python code.
a. (4 points) Prof Jeremy tried to simulate ten rolls of a fair, six-sided die. Unfortunately, things went wrong
and an error was produced. Here is the code he used:
die = Table().with_columns(‘Roll’,
np.arange(start = 1, stop = 7))
die.sample(10, with_replacement=False)
Explain the source of the error in one sentence.
b. (2 points) Prof Jeremy flipped what he thinks is a fair coin 100 times and observed 15 heads. He would like
to test the hypothesis that his coin is indeed fair against an alternative that the coin is unfair.
For his test statistic, Jeremy decides to use the absolute difference between the observed and expected
proportion of heads under the null hypothesis. He decides to use a p-value cutoff of 5 percent and simulates
the process of flipping 100 fair coins. Finally, he calculates a p-value based on his simulations. The code he used is below. Page 10 lOMoAR cPSD| 59735516 Data 8 Fall 2024 Midterm Initials:
observed_prop = 0.15 observed_abs_diff = abs(0.15-
0.5) model_proportions = make_array(0.15, 0.85)
num_simulations = 200 distribution_under_null = make_array()
for i in np.arange(num_simulations):
simulated_prop = sample_proportions(100, model_proportions).item(0) simulated_diff =
abs(simulated_prop-0.5) distribution_under_null = np.append(distribution_under_null, simulated_diff)
extreme_stats = distribution_under_null >= observed_abs_diff p_value =
np.count_nonzero(extreme_stats)
Which of the following problems can you identify with Prof Jeremy’s implementation of this code? Select all that apply.
□ In the calculation of the p-value, np.count nonzero(extreme stats) should be divided by num simulations.
□ The 100 inside of the call to sample proportions should be replaced with num simulations.
□ The index in the call to .item() should be 1, not 0.
□ The test statistics are not being simulated according to the null hypothesis.
□ The p-value cutoff is not included anywhere in the calculation of the p-value.
c. (5 points) Finally, Prof Jeremy is feeling a little sporty and wants to learn about NBA players. He loads in the
nba table from a previous lab, which gives statistics on players during the 2023-2024 season. Below is a
four-row excerpt. The table includes the columns:
• Player (str): Player name
• Age (int): Player’s age in years.
• Team (str): A three letter abbreviation for the team which the player is signed to.
• Position (str): An abbreviation for the position the player takes on the court.
• Salary (int): Gives the players’ yearly salaries in millions of US dollars.
• Games (int): The number of games the player played in the 2023-24 season. Player Age Team Position Salary Games Stephen Curry 35 GSW PG 519 74 LeBron James 39 LAL PF 476 71 Joel Embiid 29 PHI C 476 39 Kawhi Leonard 32 LAC SF 456 68 . . (521 rows omitted)
(i) (3 points) Prof Jeremy is attempting to do some table manipulations, but his lack of sleep is catching
up with him. Which of the following lines of Jeremy’s code will result in an error? Select all that apply.
□ warriors = nba.where(‘Team’, GSW) Page 11 lOMoAR cPSD| 59735516 Data 8 Fall 2024 Midterm Initials:
□ np.count nonzero(nba.column(‘Salary’)) □
nba.where(nba.column(‘Salary’), are.above(30))
□ nba.with columns(‘games to age ratio’, ‘Games’ * ‘Age’) □
nba.take(np.arange(5)).column(‘Team’).item(2)
(ii) (2 points) Prof Jeremy wants to be a sports broadcaster one day and is practicing his chops by writing
a function called team announcement which will announce every player on a given team, along with
their age and position, from youngest to oldest. Here is the function he wrote. # 1
def team_announcement(‘team_name’): # 2
team = nba.where(‘Team’, team_name).sort(‘Age’) # 3 ages = team.column(‘Age’) # 4
positions = team.select(‘Position’) # 5
names = team.select(‘Player’) # 6 # 7
for i in np.arange(team.num_rows): # 8
print(‘Playing ’ + positions.item(i) + ‘, age ’ +
ages.item(i) + ‘, here is ’ + names.item(i) + ‘!’)
Which lines of the function will result in errors? Select all that apply. □ line 1 □ line 2 □ line 3 □ line 4 □ line 5 □ line 7 □ line 8 Page 12 lOMoAR cPSD| 59735516 Data 8 Fall 2024 Midterm Initials: 6 Census [9 points]
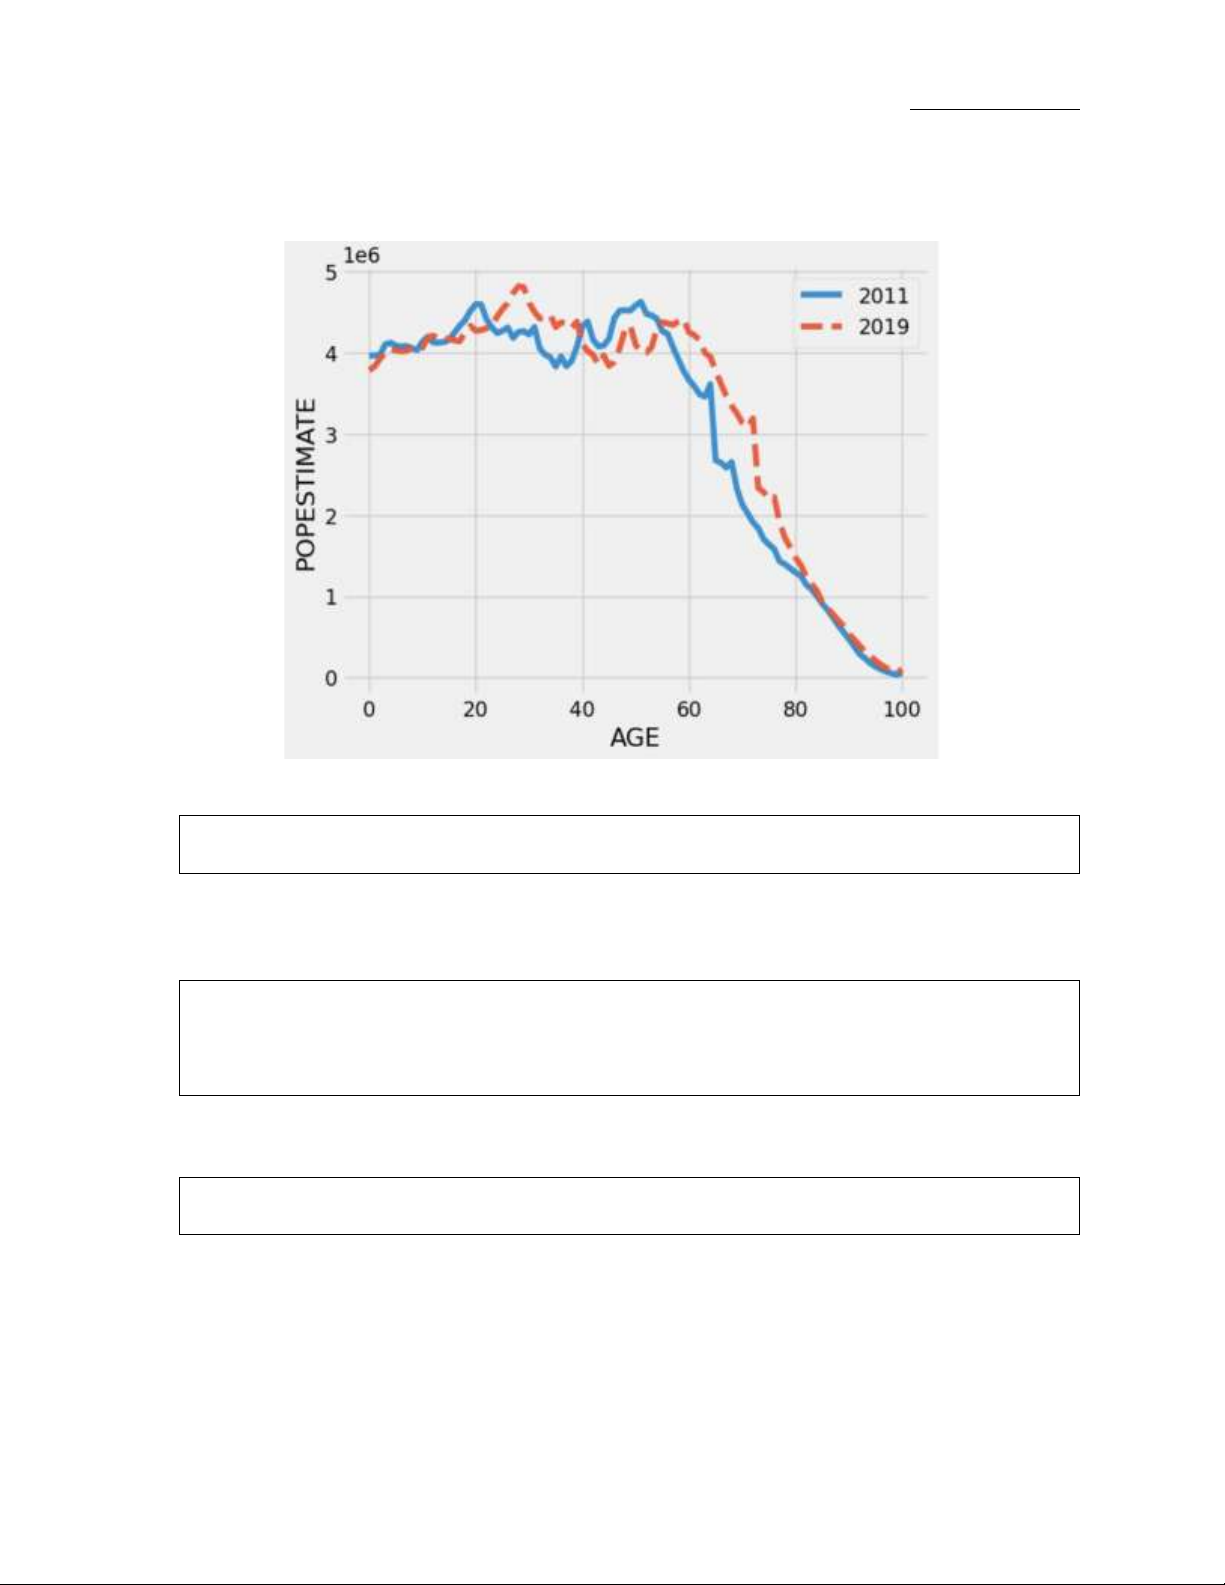
The following is a version of a plot we created in lecture using the US Census data. Look over the plot before
answering the questions below.
a. (4 points) State approximately how many infants (people aged 0) there were in the United States in 2011.
b. (1 point) Give an explanation for the pattern between the 2011 and 2019 lines as age changes in 2-3 sentences.
c. (4 points) Give the plot an effective title based on what we have discussed in lecture.[1cm]
7 Congratulations! [0 points]
You have completed the Midterm Exam. If you have not been told otherwise, you may bring all of
your testing materials (reference sheet and this test paper), as well as your student ID, to the front
of the room. Once you have been checked off, you may leave quietly. Page 13 lOMoAR cPSD| 59735516 Data 8 Fall 2024 Midterm Initials:
• Please make sure that you have written your initials on each page of the exam. You may lose points
on pages where you have not done so.
• Please make sure you have filled in circles and squares completely rather than having used a check
mark, cross or any other mark.
• Double check that you have not skipped over any questions!
Below, you may draw and caption your favorite Data 8 experience or staff member! Page 14
Tài liệu liên quan:
-
Tien Xu Ly Du Lieu P2 - Nhập Môn Khai Phá Dữ Liệu. Môn Khai phá dữ liệu (UET) | Trường Đại học Công nghệ, Đại học Quốc gia Hà Nội.
101 51 -
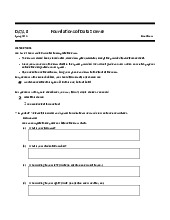
DATA 8 Final Exam Instructions and Guidelines, Spring 2024. Môn Khai phá dữ liệu (UET) | Trường Đại học Công nghệ, Đại học Quốc gia Hà Nội.
118 59 -
DATA 8 Spring 2023 Foundations of Data Science Final Exam Guide. Môn Khai phá dữ liệu (UET) | Trường Đại học Công nghệ, Đại học Quốc gia Hà Nội.
114 57 -
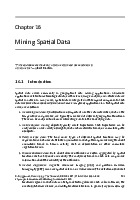
Khai Phá Dữ Liệu Không Gian: Khảo Sát và Ứng Dụng (Chương 16). Môn Khai phá dữ liệu (UET) | Trường Đại học Công nghệ, Đại học Quốc gia Hà Nội.
91 46