DATA 8 Spring 2023 Foundations of Data Science Final Exam Guide. Môn Khai phá dữ liệu (UET) | Trường Đại học Công nghệ, Đại học Quốc gia Hà Nội.
You have 2 hours and 50 minutes to complete the exam.
• The exam is closed book, closed notes, closed computer/calculator, except the provided final reference sheet.
• Mark your answers on the exam itself in the spaces provided. We will not grade answers written on scratch paper or outside the designated answer spaces.
• If you need to use the restroom, bring your phone and exam to the front of the room.
For questions with circular bubbles, you should fill in exactly one choice. You must choose either this option # Or this one, but not both!
For questions with square checkboxes, you may fill in multiple choices. You could select this choice.
2 You could select this one too!
DATA 8 Spring 2023 Foundations of Data Science Final Exam Guide. Môn Khai phá dữ liệu (UET) | Trường Đại học Công nghệ, Đại học Quốc gia Hà Nội.
Tài liệu gồm 17 trang giúp bạn tham khảo, củng cố kiến thức và ôn tập đạt kết quả cao trong kỳ thi sắp tới. Mời bạn đọc đón xem!
Môn: Khai phá dữ liệu (UET) 7 tài liệu
Trường: Trường Đại học Công nghệ, Đại học Quốc gia Hà Nội 824 tài liệu
Tác giả:


Preview text:
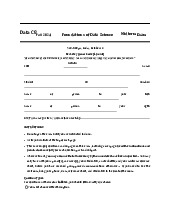
lOMoAR cPSD| 59735516 DATA 8 Foundations of Data Science Spring 2023 Final Exam INSTRUCTIONS
You have 2 hours and 50 minutes to complete the exam.
• The exam is closed book, closed notes, closed computer/calculator, except the provided final reference sheet.
• Mark your answers on the exam itself in the spaces provided. We will not grade answers written on scratch paper or
outside the designated answer spaces.
• If you need to use the restroom, bring your phone and exam to the front of the room.
For questions with circular bubbles, you should fill in exactly one choice. You
must choose either this option # Or this one, but not both!
For questions with square checkboxes, you may fill in multiple choices. You could select this choice.
2 You could select this one too!
**Important**: Please fill in circles and squares to indicate answers and cross out or erase mistakes. Preliminaries
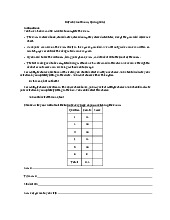
You can complete these questions before the exam starts. (a) What is your full name?
(b) What is your student ID number? (c)
Who is sitting to your left? (Write no one if no one is next to you.)
(d) Who is sitting to your right? (Write no one if no one is next to you.) lOMoAR cPSD| 59735516 2 1. (28.0 points) True or False
(a) (2.0 pt) The height of each bar in a histogram represents the proportion of data within the corresponding bin. True # False
(b) (2.0 pt) According to the Case Study lecture, the pixel of an image is typically considered a categorical variable
when building machine learning models. True # False (c)
(2.0 pt) A classifier is considered to be overfitting if it performs very well on the test set. True # False
(d) (2.0 pt) If you are a subject in an experiment, knowing whether you are in the treatment or control group can be
considered a confounding variable. True # False (e)
(2.0 pt) For any distribution, the percentage of data that lies beyond two standard deviations on
either side of the mean is less than 30%. True # False (f)
(2.0 pt) For any regression line, the SD of the residuals is equal to the root mean squared error. True # False (g)
(2.0 pt) We sample a table with replacement to shuffle labels for A/B testing. True # False (h)
(2.0 pt) According to the Central Limit Theorem, if a sample is drawn at random from the population
with replacement, then the probability distribution of the sample average is normal, regardless of the sample size. True # False (i)
(2.0 pt) DJ Patil covered climate change in depth during his guest lecture. True # False lOMoAR cPSD| 59735516 3 (j)
(2.0 pt) The median of a set of 15 integers will always be an integer. True # False (k)
(2.0 pt) Suppose a hypothesis test is proposed and we already know that the null hypothesis is true.
If 100 researchers each independently collect a large random sample of the same size to carry out an experiment
and they all use 5% as their p-value cutoff, we should expect around 95% of them to fail to reject the null. True # False (l)
(2.0 pt) Suppose you fit a regression line to two data sets: (A) the original data set; and (B) the dataset with a few
outliers (with respect to the y-axis) removed. The line for (A) will have a larger slope (in absolute value) than the line for (B).
Assume both data sets are standardized just prior to fitting the lines. True # False
(m) (2.0 pt) If we use linear regression to predict y-values based on our x-values, the median of our residuals will always be zero. True # False (n)
(2.0 pt) Given a function error(a, b) which computes some error based on its input arguments, a
valid output from the call minimize(error) could be an array containing two elements: 4 and 20. True # False 2. (32.0 points) Hawaii
Armond and Belinda are studying the characteristics of the guests who stay at their hotel in Hawaii. To get a
sense of this, they plan to randomly sample guest bookings from the hotel’s database. (a) (14.0 points)
Their initial project is to analyze guest spend, the amount spent per guest booking in dollars.
i. (2.0 pt) Suppose Armond wants to randomly sample guest bookings to create a 68% confidence interval for
the population mean of guest spend, and he knows that the population SD is 500 dollars. What is the minimum
sample size he needs to create a confidence interval that has a width of 50 dollars? lOMoAR cPSD| 59735516 4
# There is not enough information to answer ii. (2.0 pt) Suppose Armond wants to randomly sample guest
bookings to create a 95% confidence interval for the population median of guest spend, and he knows that the population SD is 500 dollars.
What is the minimum sample size he needs to create a confidence interval that has a width of 40 dollars? 2500 1600 # 800 400 # # 100 20 # 10
# There is not enough information to answer
iii. (3.0 pt) Suppose that Belinda creates her own random sample of 100 guest bookings. She observes a sample
average of 4000 dollars for guest spend and she also knows that the population SD is 500 dollars.
What is her 99.7% confidence interval for the true population mean of guest spend (in dollars)? (3990, 4010) (3985, 4015) (3950, 4050) (39 # 00, 4100) (38 # 50, 4150) (35 # 00, 4500) (30 # 00, 5000) #
# There is not enough information to answer iv. (4.0 pt) Armond suspects that the spend at the
Hawaii hotel is lower than the spend at their sister hotel in Sicily, which has an average guest spend of 7000
dollars across all of its bookings.
Based on a 95% confidence interval for the population mean guest spend time of (5500, 7500) dollars, if his
p-value cutoff is 5%, what should he conclude? Select all that apply.
The data are consistent with the hypothesis that the distribution of guest spend is the same for both the
Hawaii hotel and the Siciliy hotel. T
2 he data are consistent with the hypothesis that the guest spend is higher on average at the Sicily hotel than at the Hawaii hotel. 2
The data are consistent with the hypothesis that the guest spend is higher on average at the Hawaii hotel than at the Sicily hotel. 2 lOMoAR cPSD| 59735516 5
2 There is not enough information to make any of these conclusions.
v. (3.0 pt) Suppose that Belinda creates ten different random samples, each of 100 guest bookings, and constructs
a 90% confidence interval for the true population mean of guest spend using each sample.
What is the chance that at least one of the intervals contains the population mean? (b) (4.0 points)
Note: This section does not depend on the previous parts.
Armond thinks it could be a good idea to predict guest spend from how far away they live from the hotel.
He collects a random sample of guest bookings and creates a table with two columns:
• Spend: (float) the amount spent (in dollars) by a guest during their stay
• Distance: (float) the number of miles the guest traveled to get to the hotel Suppose that:
• the 'Spend' column has a mean of 5,000 and a standard deviation of 500
• the 'Distance' column has a mean of 4,000 and a standard deviation of 1,000
• the correlation between the 'Spend' and 'Distance' columns is 0.8
i. (2.0 pt) Armonds fits a regression line using the table above to predict 'Spend' from 'Distance'.
What is the intercept of this regression line? 21,000 12,000 # 6,600 # 3,400 # # # -4,000 -11,000
# # None of the above ii. (2.0 pt) For a guest from Berkeley, who would have to travel 2,000 miles to get
to Hawaii, what would this regression line predict as their spend? 5,800 4,200 4,000 2, # 500 # 2,000 # # None of the above (c) (6.0 points)
Note: This section does not depend on the previous parts.
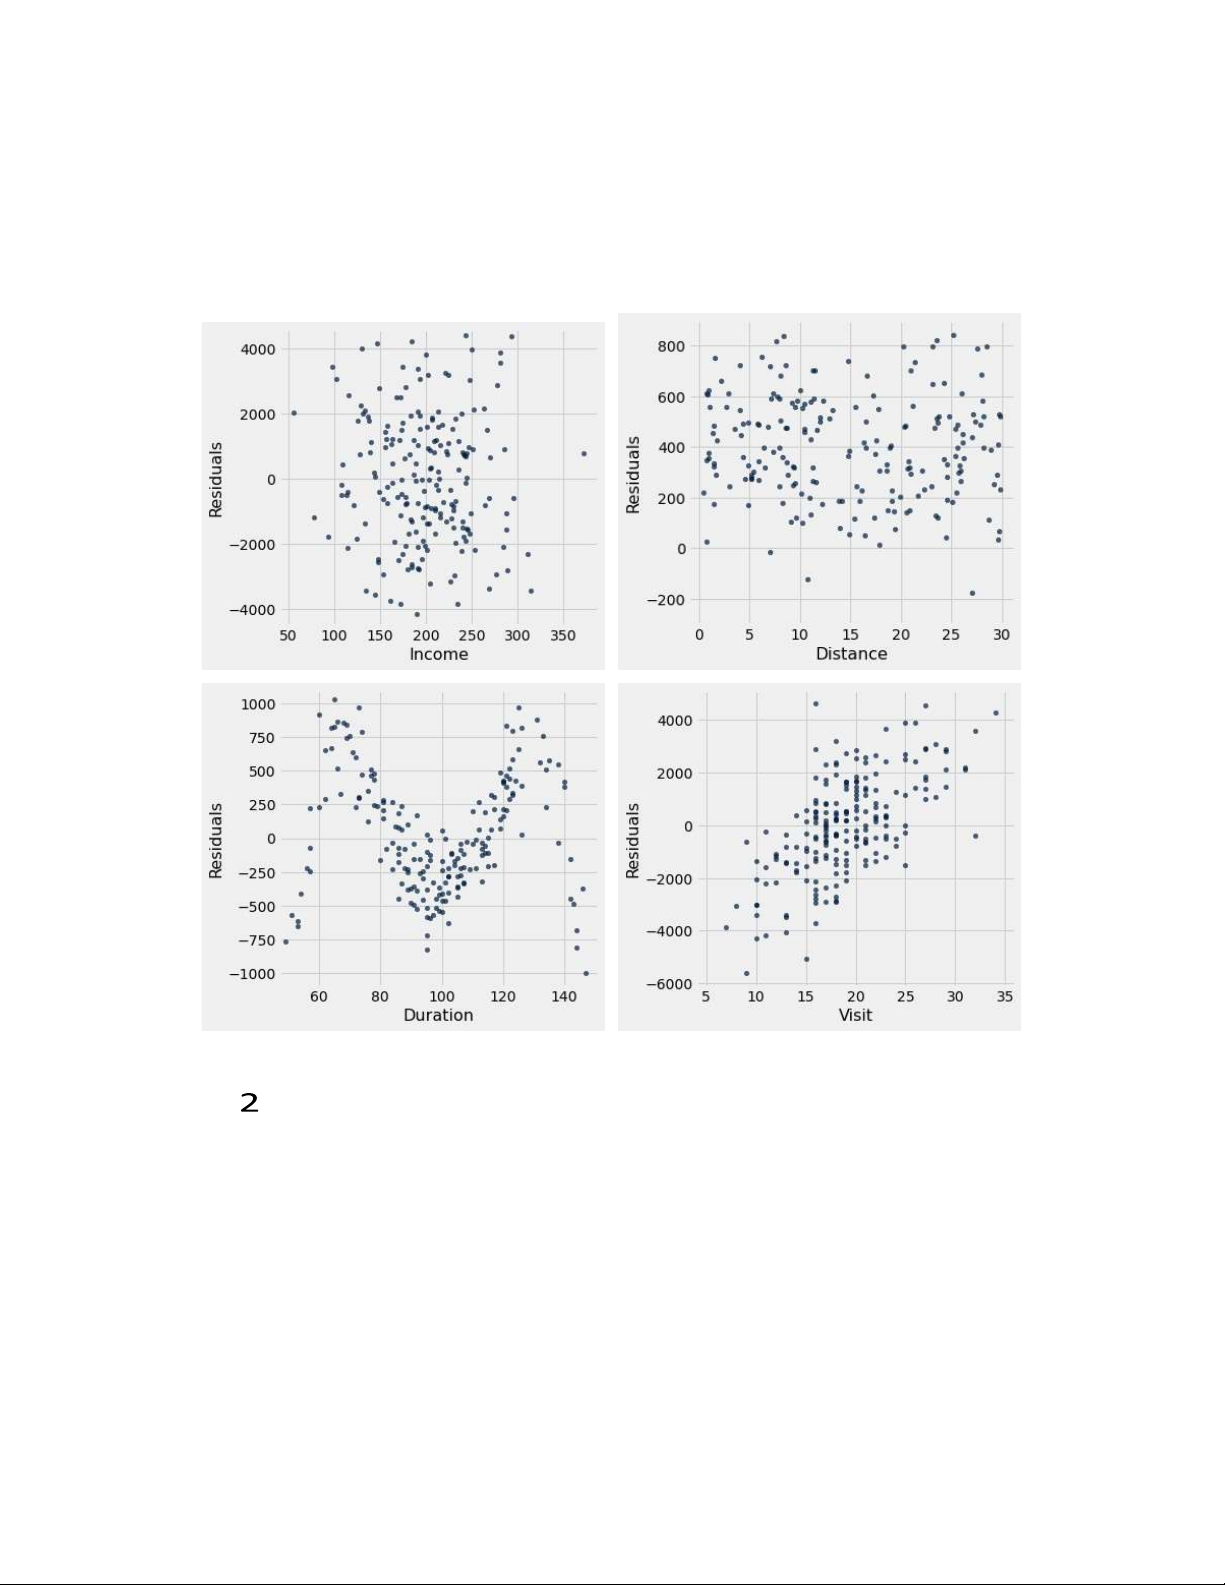
Belinda decides to predict the guest spend (in dollars) from each of the following four different variables using
least squares linear regression: lOMoAR cPSD| 59735516 6
• Income: (float) the guest’s household income (in thousands of USD)
• Distance: (float) the distance (in thousands of miles) of the guest’s home from the hotel
• Duration: (int) the number of days the guest stayed at the hotel for that booking
• Visit: (int) the guest’s visit number (e.g. a value of 10 implies the booking was the guest’s 10th visit to the hotel)
To assess her predictions from each variable, she creates the following residual plots:
i. (2.0 pt) Which of the plots above indicate that the variable is linearly associated with guest spend? Select all that apply. Income Distance Du 2 ration Vis 2 it 2 2 None of the above.
ii. (2.0 pt) Belinda suspects she may have made a mistake in her code when plotting the residuals.
Which of the plots above are impossible residual plots?
Select all that apply. Income lOMoAR cPSD| 59735516 7 Distance 2 Duration Vis 2 it 2 2 None of the above.
iii. (2.0 pt) For which of the above plots should Belinda try a nonlinear equation for regression? Select all that apply. Income Distance Du 2 ration Vis 2 it 2 2 None of the above. lOMoAR cPSD| 59735516 8 (d) (8.0 points)
Note: This section does not depend on the previous parts.
Belinda notices that guests’ nationality seems to differ quite a bit depending on whether they request a late check out.
She creates a table with the following columns:
• 'Nationality': (string) the country where the guests reside (e.g. 'Italy', 'France') • 'Late Checkout': (string)
whether the guests requested a late check out ('Yes' or 'No'). She decides to conduct a hypothesis test to
determine whether the observed difference between guests who request a late checkout and those who do not is due to chance. i.
(2.0 pt) Which of the following is a null hypothesis that Belinda could use for her test? Select all that apply.
The 'Late Checkout' distribution is the same among guests of all nationalities. 2
guests. The 'Late Checkout' distribution is more varied among domestic guests compared to 2 international 2 who do not.
The 'Nationality' distribution is the same between guests who request a late checkout and guest 2 who do
not. The 'Nationality' is more diverse among guests who request a late checkout compared to guest
The 'Nationality' distribution is different between guests who request a late checkout and guest who do not. 2 2 None of the above
ii. (2.0 pt) Which of the following could be used as a test statistic for this hypothesis test? Select all that apply. 2
and guests who do not. The difference in standard deviation of 'Nationality' between guests who
request a late checkout 2 international guests. The total variation distance between the 'Late Checkout'
distributions of domestic guests and 2 who do not. The difference of means in 'Nationality' between guests
who request a late checkout and guest 2 late checkout and guest who do not. The total variation distance
bewtween the 'Nationality' distributions of guests who request a
The absolute difference of means in 'Nationality' between guests who request a late checkout and guests who do not. 2 2 None of the above
iii. (2.0 pt) Which of the following approaches could be used to create simulations under the null hypothesis? Select all that apply.
Sampling all of the rows of the table without replacement Sh
2 uffling just the 'Nationality' column 2 lOMoAR cPSD| 59735516 9
Shuffling just the 'Late Checkout' column
Calling sample_proportions and passing in the observed 'Nationality' distribution as an argument
2 Calling sample_proportions and passing in the observed 'Late Checkout' distribution as an argument 2
2 None of the above iv. (2.0 pt) Suppose the 5th percentile of the simulated test statistics is 0.1 and 2
Belinda is using a 5% cutoff. Which of the following conclusions can she make?
The data are consistent with the null hypothesis. T
# he data are consistent with the alternative hypothesis. W
# e cannot make a conclusion because we do not what the alternative hypothesis is. W
# e cannot make a conclusion because we do not what the observed test statistic is. # # None of the above lOMoAR cPSD| 59735516 10 3. (18.0 points) Will Frank Be on Time?
In the year 2031, Rebecca and Sarah are excited to see Frank Ocean perform at a festival.
Based on historical data, they know there’s a 30% chance he will be on time, a 60% chance he will be late, and a 10%
chance he doesn’t show up at all.
Thankfully, they have found a website, willfrankbeontime.com, that attempts to predict the outcome of Frank Ocean’s
arrival. It returns one of the following:
• 'yes', if Frank will show up on time
• 'no', if Frank will show up late or will not show up at all
If he is on time, the website returns 'yes' 85% of the time. If he is late, the website returns 'yes' 11% of the time. If he
does not show up, the website returns 'yes' 8% of the time.
Hint: it will help to draw a tree diagram.
(a) (2.0 pt) What is the probability that Frank will be on time or show up late?
Please leave your answer as an expression.
(b) (2.0 pt) If we define “negative” as Frank being late or not showing up, and we define “positive” as Frank being on
time, what is the false negative rate of the website? Please leave your answer as an expression.
(c) (2.0 pt) What is the probability that Frank is on time and the website returns 'no'?
Please leave your answer as an expression.
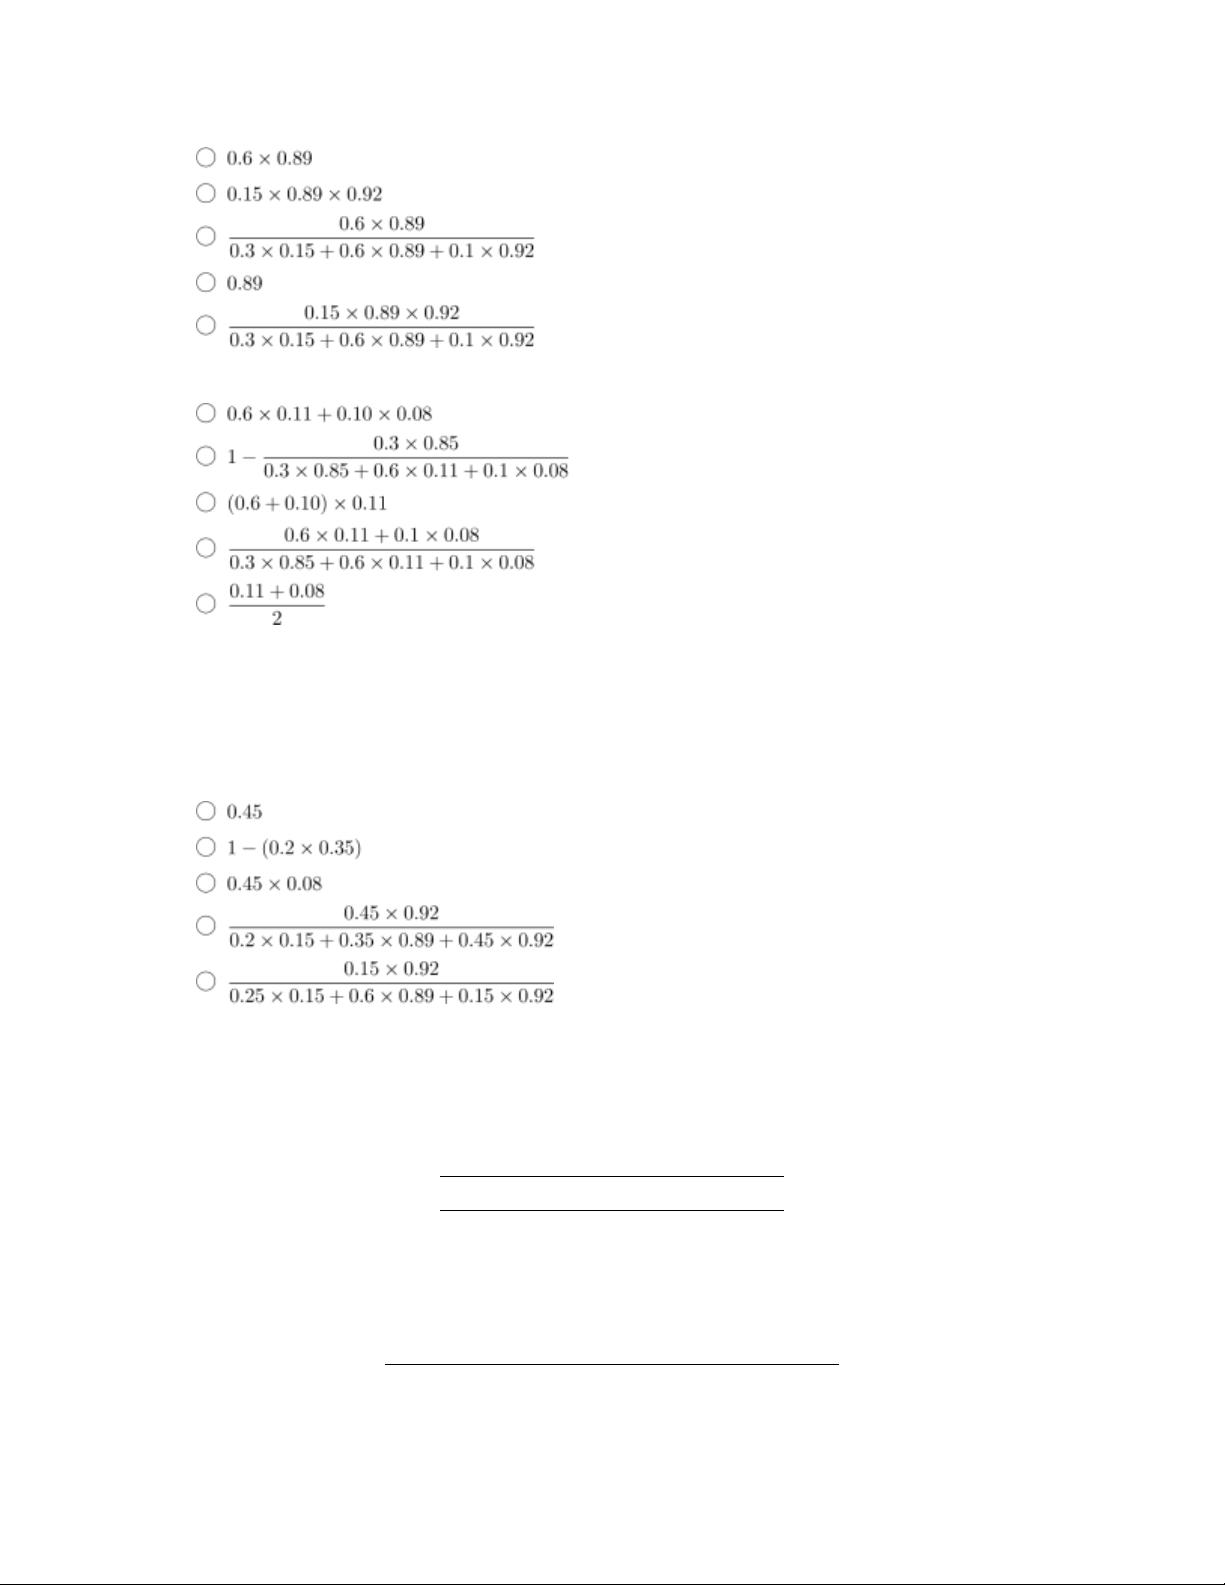
(d) (3.0 pt) Suppose the website returns “yes”. Which of the following represents the probability that Frank was on
time, given that the website returned 'yes'?
(e) (3.0 pt) Suppose Frank shows up late. What is the probability that the website correctly predicted that he was not on time? lOMoAR cPSD| 59735516 11
(f) (3.0 pt) What is the probability that the website returns 'yes' and Frank Ocean is late or does not show up?
(g) (3.0 pt) Suppose that the morning of a performance, the weather forecast isn’t looking too great, so Sarah &
Rebecca think that there’s a 20% chance Frank is on time, 35% chance he is late, and 45% chance he does not show up.
Suppose Sarah & Rebecca then consult the website and it returns 'no'.
Given this new information, what is Sarah & Rebecca’s subjective probability that Frank does not show up? 4. (38.0 points) To Buy or Not to Buy?
Siobhan and Roman are trying to understand the performance of Waystar, a media organization that owns multiple businesses.
They put together a table called performance, which contains randomly sampled public information about the
performance of Waystar’s businesses over the last 40 years. Here are the first few rows: Name Year Revenue Profit Buy Vaulter 2022 120.9 70.2 1 Adventure Parks 2020 59.2 25.8 0 ATN 2021 71.7 58.7 1 Brightstar Cruises 2020 42.3 28.9 0 Adventure Parks 2019 52.8 26.3 0 ... (158 rows omitted) lOMoAR cPSD| 59735516 12
The table contains the following columns:
• Name: (string) the name of the business
• Year: (int) the year of the financial performance
• Revenue: (float) the business’s revenue (in millions of USD)
• Profit: (float) the business’s profit (in millions of USD)
• Buy: (int) whether Wall Street analysts recommend buying the business’s stock (1 is “yes”, 0 is “no”) (a) (10.0 points)
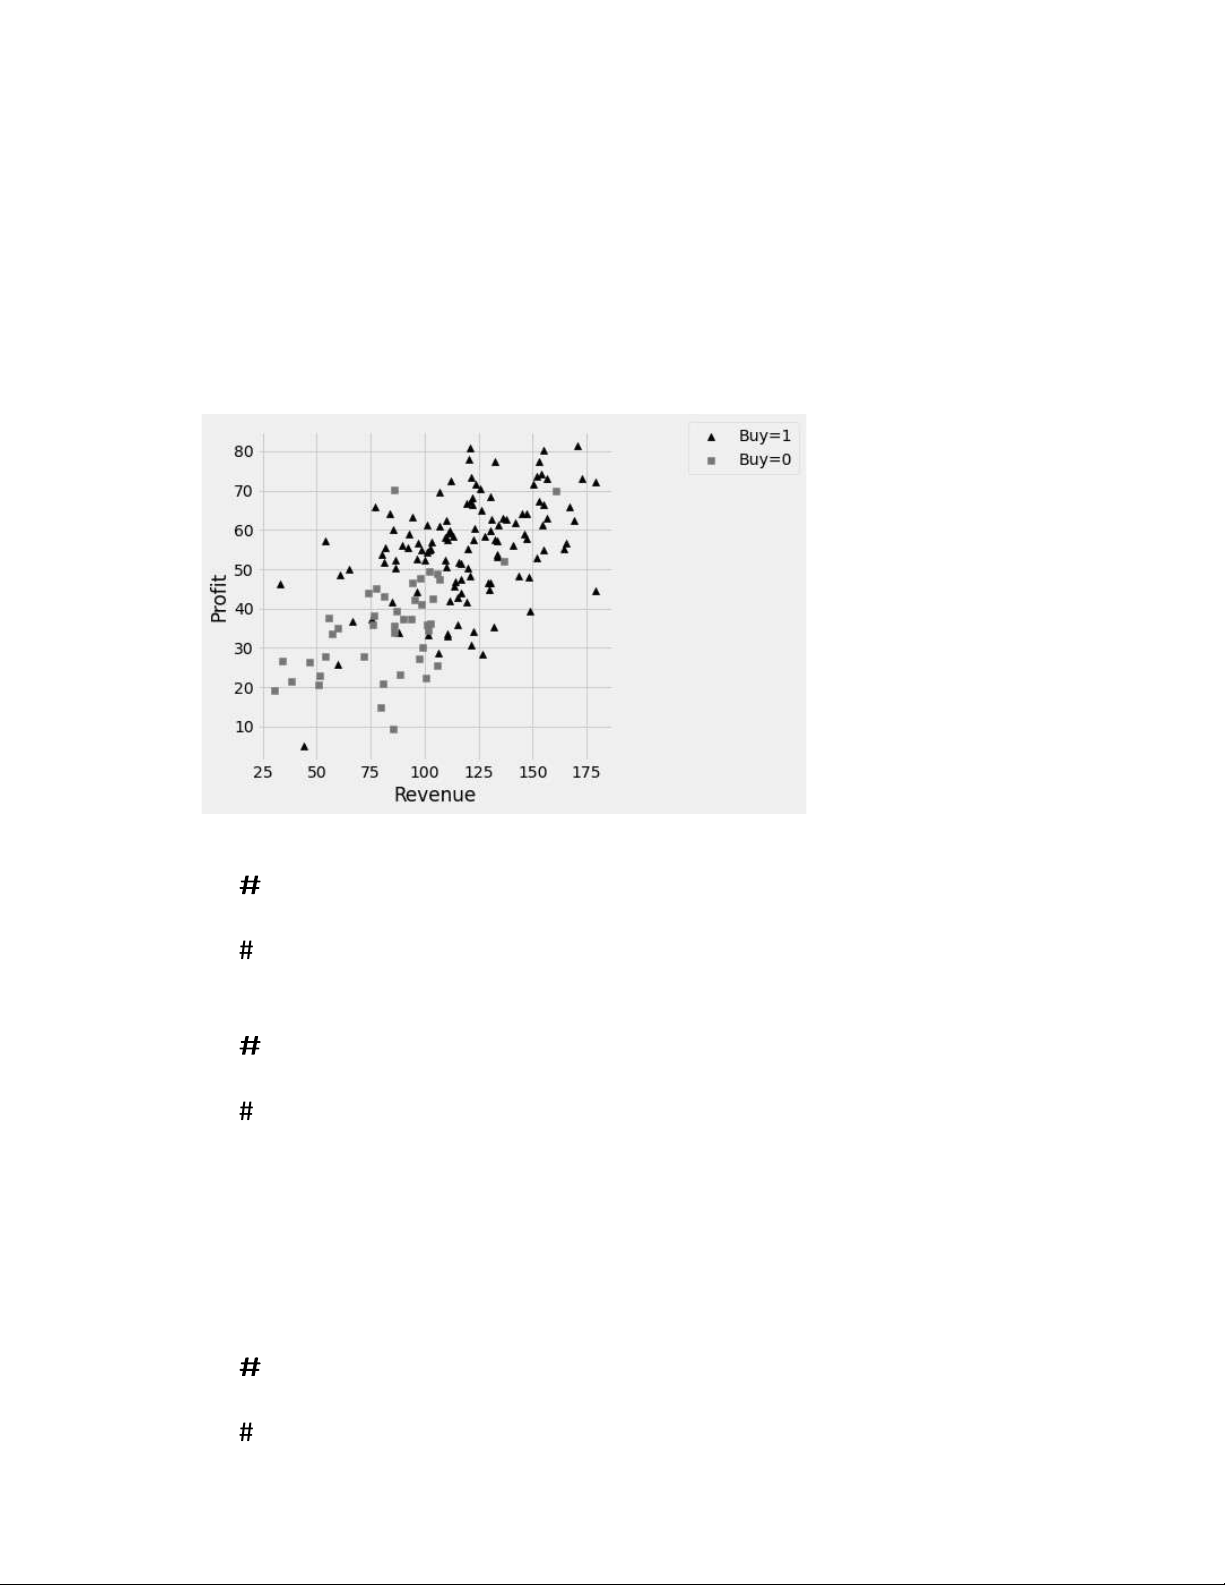
Roman uses the table to make the following scatterplot in an attempt to classify whether a business will receive a
'Buy' recommendation from Wall Street analysts.
i. (2.0 pt) Suppose that in 2023, a Waystar business has Revenue of 75 and Profit of 70. If
Roman uses a 3-nearest neighbor classifier, what will the prediction be? 1 0 #
# Not enough information to tell.
ii. (2.0 pt) Suppose that in 2023, a Waystar business has Revenue of 70 and Profit of 45. If
Roman uses a 5-nearest neighbor classifier, what will the prediction be? 1 0 #
# Not enough information to tell. iii. (2.0 pt) Suppose that instead of using a k-nearest neighbor classfier,
Roman wants to use a d-distance classifer.
With this classifier, instead of considering the k closest neighbors, all neighbors within a distance d are considered.
Suppose that in 2023, a Waystar business has Revenue of 55 and Profit of 43.
If Roman decides to try d = 10, what will the prediction be? 1 0 # lOMoAR cPSD| 59735516 13
# Not enough information to tell. iv. (4.0 pt) Suppose Siobhan wants to find the best possible value of d that
will minimize the prediction error of Roman’s d-distance classifier.
She creates the following names her code: •
train: a table that contains a random sample of 100 rows from performance •
test: a table that contains the rows from performance that are not in train •
classify: a function that takes in train, test, and d (the distance considered by the classifier), and
returns a prediction for the example’s 'Buy' recommendation She then writes the following code: def error(d):
num_errors = 0 for example in test.rows: num_errors = num_errors + (classify(train, example, d) == example.column('Buy'))
return num_errors / test.num_rows best_d = minimize(error)
Which of the following statements will occur when the above code is run? Select all that apply.
best_d will contain the value of d that provides the highest accuracy on the test set
2 best_d will contain the value of d that provides the highest accuracy on the training set The
last line of code will result in an error because d must be an integer best_d will contain the 2
minimum possible error that can be achieved on the test set best_d will contain the minimum
possible error that can be achieved on the training set 2 None of the above. (b) (15.0 points)
Note: This section does not depend on the previous parts.
Suppose that instead of classifying whether a business will get a 'Buy' recommendation, Roman would like to use
nearest neighbors to predict a business’s probability of getting a 'Buy' recommendation.
We will use the following method:
i. Find the k nearest neighbors of the business with respect to 'Revenue' and 'Profit'.
ii. For each of the k nearest neighbors, define their weight as follows. Let dr be the difference between the
neighbor’s revenue and the unclassified businesses’s revenue. Let dp be the difference between the
neighbor’s profit and the unclassified businesses’s profit. Calculate the neighbor’s weight as weight =
i. Among the k nearest neighbors, find the weighted proportion that received a 'Buy' rating. For example, if k =
3 and the 3 nearest neighbors have 'Buy' values of 0, 0, & 1 with weights 0.9, 0.3, & 0.2, respectively, then the
weighted proportion that received a ‘Buy’ recommendation is z}|{ 0 .9 ∗ z}|{ 0+ z}|{ 0 .3 ∗ z}|{ 0+ z}|{ 0 .2 ∗ z}|{ 1
0 .9+0 . 3+0 . 2 | { z } sum of weights lOMoAR cPSD| 59735516 14
In order to estimate the 'Buy' probability of a new business using the scheme above, Roman defines a function
knn_prob that takes the following arguments:
• train: A three-column table in which the first column is labeled 'Revenue', the second column is labeled 'Profit',
and the third column is labeled 'Buy'. Each row of the table represents a business in the training set.
• business: An array of length two containing the business revenue and profit (in that order) of the business to predict on.
• k: The value of k to use for k-nearest-neighbors.
The function returns the weighted proportion that received a 'Buy' recommendation among the k-
nearestneighbors, according to the scheme proposed above. Here is the function, partially completed: def knn_prob(train, business, k):
revenue_diffs = train.column('Revenue') - __________ (a)
profit_diffs = train.column('Profit') - __________ (b)
train_dist = train.with_column('Distance', __________) (c)
nn = train_dist.sort(__________).take(__________) (d) (e)
weights = 1/(1 + __________) (f)
return np.sum(__________) / np.sum(weights) (g) i. (2.0 pt) Fill in blank (a). ii. (2.0 pt) Fill in blank (b).
iii. (3.0 pt) Fill in blank (c).
iv. (2.0 pt) Fill in blank (d). v. (2.0 pt) Fill in blank (e). lOMoAR cPSD| 59735516 15
vi. (2.0 pt) Fill in blank (f).
vii. (2.0 pt) Fill in blank (g). (c) (13.0 points)
Note: You may use the knn_prob function from the previous question for this section.
Suppose Siobhan wants to understand the variability in Roman’s nearest neighbor regression predictions.
She wants to construct a confidence interval for the probability of getting a 'Buy' recommendation by
bootstrapping the sample data.
Siobhan defines a function prob_interval that takes the following arguments:
• train: A three-column table in which the first column is labeled 'Revenue', the second column is labeled 'Profit',
and the third column is labeled Buy. Each row of the table represents a business in the training set.
• business: An array of length two containing the business revenue and profit (in that order) of the business to predict on.
• k: The value of k to use for k-nearest-neighbors.
• conf : The confidence level of the interval (e.g. 95 for a 95% interval)
The function returns a confidence interval for the probability of that business getting a 'Buy' rating (as an array).
Here is the function, partially completed:
def prob_interval(train, business, k, conf): probs = _________ (a) for i in np.arange(10000):
boot_data = train._________ (b)
probs = np.append(probs, _________) (c) left = _________ (d) right = _________ (e)
return make_array(left, right) i. (2.0 pt) Fill in blank (a).
ii. (2.0 pt) Fill in blank (b).
iii. (3.0 pt) Fill in blank (c). lOMoAR cPSD| 59735516 16
iv. (3.0 pt) Fill in blank (d).
v. (3.0 pt) Fill in blank (e). lOMoAR cPSD| 59735516 17 3. (0.0 points) Optional
(a) Based on the problems in this exam, which show does Prof. Sahai most strongly recommend watching? The White Lotus Y # ellowstone Su # ccession # Beef # Ted Lasso
(b) If there was any question on the exam that you thought was ambiguous and required clarification to be
answerable, please identify the question (including the title of the section, e.g., Experiments) and state your
assumptions. Be warned: We only plan to consider this information if we agree that the question was erroneous
or ambiguous and we consider your assumption reasonable.
(c) Draw a picture or share a few words describing your experience in Data 8!
Tài liệu liên quan:
-
Tien Xu Ly Du Lieu P2 - Nhập Môn Khai Phá Dữ Liệu. Môn Khai phá dữ liệu (UET) | Trường Đại học Công nghệ, Đại học Quốc gia Hà Nội.
101 51 -
DATA 8 Final Exam Instructions and Guidelines, Spring 2024. Môn Khai phá dữ liệu (UET) | Trường Đại học Công nghệ, Đại học Quốc gia Hà Nội.
118 59 -
Data 8 Fall 2024 Midterm Exam: Foundations of Data Science Insights. Môn Khai phá dữ liệu (UET) | Trường Đại học Công nghệ, Đại học Quốc gia Hà Nội.
126 63 -
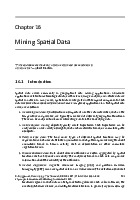
Khai Phá Dữ Liệu Không Gian: Khảo Sát và Ứng Dụng (Chương 16). Môn Khai phá dữ liệu (UET) | Trường Đại học Công nghệ, Đại học Quốc gia Hà Nội.
91 46