Final report - Channel management - Tài liệu tham khảo | Đại học Hoa Sen
Final report - Channel management - Tài liệu tham khảo | Đại học Hoa Sen và thông tin bổ ích giúp sinh viên tham khảo, ôn luyện và phục vụ nhu cầu học tập của mình cụ thể là có định hướng, ôn tập, nắm vững kiến thức môn học và làm bài tốt trong những bài kiểm tra, bài tiểu luận, bài tập kết thúc học phần, từ đó học tập tốt và có kết quả
Môn: Marketing (MK191P1) 310 tài liệu
Trường: Trường Đại học Hoa Sen 5.3 K tài liệu
Tác giả:


Preview text:
PROPOSED DESIGN OF MARKETING CHANNEL FOR
Standard Electric Supply Corporation Group Name: Exclusive
1. Nguyễễn Minh Nh (GL) ư 2. Nguyễễn Minh Ph ng ươ (M)
3. Nguyễễn Ng c Quỳnh ọ (M) 4. Tr ng T ươ uyễết Nhi (M)
Semester: 20.2A (2020-2021)
Course title: Marketing Channel Management (Qu n tr ả K ị ênh Marketing) TABLE OF CONTENTS I.
Determination of existing marketing strategy (Exercise 1)
1) Brief story of the company in the case
2) Determination of Current Marketing strategy
3) Determination of Current Marketing mix II.
Segmenting and targeting end-users (Exercise 2)
1) Survey of end-user’s service output demanded (SD)
2) End-user Segmentation and evaluation 3) End-user targeting III.
Determination of service gaps (Exercise 3)
1) Determining service supplied (SS) of the existing channel
2) Matching channel routes with targeted segments
3) Determination of service gaps IV.
Proposed new marketing channels
1) Selecting the new channel routes
2) Identifying new service gaps
3) Proposing marketing activities to close the service gaps 4) Verifying your proposals
5) Drawing the new channel structure V. Conclusion: VI.
Annex: Contribution of group members:
PART I: DETERMINATION OF EXISTING MARKETING STRATEGY
1) Brief story of the company in the case:
Standard Electric Supply Corporation (SESC) is a firm that has been in business for
over 30 years, however, it is only well-known in the industrial field, not with the
consumer for its products. The reason for that is because their main products are
mostly machines and tools.
After several years of research, they released their first automatic dishwasher with a
50% reduction in service and repair calls relative to competitive products.
Despite the fact that they have been in business for over 30 years, they are not
considered a wealthy firm, which is why they wanted to get into the consumer products
market. This means they want to diversify their product, enlarge their business. This
will surely help them to increase their profit. What are their strengths?
They consider their dishwasher to be superior to those currently in the market
They are interested in diversifying their products and their business. With this
interest, they’ll have to have a proper plan for diversification.
They have some resources that are not being used in its regular operations,
which will be useful for diversification.
However, their established intermediaries are still concerned and still not accepted this
new product as part of their regular distribution.
=> They plan to convince the distributors as well as set up their own distribution
system which allows them to sell their new type of products.
The first problem to be considered is the establishment of suitable physical facilities:
Firstly, they have to determine the number of outlets that will be required and
the area that will need covering. Table 1 shows us the number of cities in the
United States which are categorized by size of population in 1970.
Secondly, based on the data from table 2 and the fact that SESC wants to create
nationwide distribution for the new dishwasher, they’ve hypothetically
determined the number of outlets needed to achieve their goals which will have
to be at least 11,500 outlets. Population Number of cities Under 10,000 4,761 10,000 – 25,000 1,385 25,000 – 50,000 520 50,000 - 100,000 240 100,000 – 500,000 130 500,000 – 1,000,000 20 Over 1,000,000 6
Table 1: Number of cities in the US categorized by the size of population – 1970 Number of outlets per Total outlets for city City size city classification Under 10,000 1 4,142 10,000 – 25,000 2 2,000 25,000 – 50,000 6 1,550 50,000 - 100,000 8 1,300 100,000 – 500,000 16 1,350 500,000 – 1,000,000 24 800 Over 1,000,000 50 450 Total 11,592
Table 2: Hypothetical representation required by Standard Electric Suplly Corporation
However, this will be impossible for the company to establish all of these outlets
profitably. Then, the company will have to find out the answer for these question such
as how to achieve representative distribution that will successfully launch the product
into normal retail outlets and how to convince their intermediaries to distribute this
new product (will they have to feel the impact of competition from the products before
recognize the value of stocking it, or will a report of successful sales performance be sufficient?)
The second problem to be considered is production. After the operation, a certain level
of output must be maintained to provide the outlets. They also have to keep close
coordination between production and sales in order to avoid inventory and storage
costs that would create both costs and risk.
Thirdly, transportation and credit terms must also be included. SESC wanted to retain
title to the machines throughout the entire marketing process until final sales to
consumers so the trade credit won’t be required but they need to be considered about consumer credit.
2) Determination of Current Marketing strategy: a) Segmentation:
Segmentation bases for B2C Firms Segmentation Content bases Demographic Gender: all gender Income: low to medium Geographic
Countries: The United State Psychographic Lifestyle:
1. Activities: People that have meals at home regularly and enjoy parties.
2. Interest: People that love to cook, convenience and want to save time in cleaning
3. Opinion: People that want to protect the environment by saving electric and water. Behavioral
No information mentioned in our case b) Targeting:
The target market of our firm consists of people with all gender which have low to
medium income and currenly located in the US. They have interest in cooking and
usually have meals or parties at home. They also love useful and convenient product
that will help them save their time in cleaning. Moreover, they are evironmetal-friendly
people that want to protect our world by saving electric and water. c) Differentiation
Describe the competitors
Our product’s price is from 245$ so we estimated that the price of out competitor’s
product would be from 245$ up to 300$. Therefore, to find out exactly who, we have a
quick search on Amazon.com for the dishwasher with the price we set which is from
245-300$, then come to the conclusion that we got 2 competitors such as below:
- Whynter is a small manufacturing company that was founded in Santa Fe Springs,
California in 2006. Whynter CDW-6831WES Energy Star 6 place setting LED, White
Countertop Portable Dishwasher. Whynter produces a wide array of products
including portable air conditioners, ice cream makers, cigar coolers, freezers,... The
company has been growing at an impressive rate mainly due to the quality of its air products.
- SPT founded in Taiwan in 1985. SPT SD-2225DS Compact Countertop Diswasher The
company specializes in manufacturing home and kitchen appliances.. In 1993, it
expanded worldwide to areas such as China, Japan and the US under the name Sunpentown International.
Select the differentiation base of the firm:
Differentiation bases Product Services Channels People Image attributes Criteria 1 Important.
The difference 9 7 7 6 6
delivers a highly valued benefit to target buyers.
2 Distinctive. Competitors do not 8 7 8 7 6
offer the difference, or the company can offer it in a more distinctive way.
3 Superior. The difference is 8 8 8 6 8 superior to other ways that
customers might obtain the same benefit.
4 Communicable. The difference is 5 7 7 7 7 communicable and visible to buyers.
5 Preemptive. Competitors cannot 7 6 6 7 6
easily copy the difference.
6 Affordable. Buyers can afford to 9 7 8 8 6 pay for the difference.
7 Profitable. The company can 8 7 7 6 7 introduce the difference profitably Total points 54 49 51 47 46
3) Determination of Current Marketing mix: Product:
This product can expect a 50 percent reduction in service and repair calls
relative to competitive products.
This product is a 2 cycle machine which help saving energy.
Price: This product has affordable price which only cost about 245$, nearly
similar to other competitors in the market. Place: Own Manufacture company End-user store
Promotion: We have professional trained personal selling from our own
company stores which can provide information about the product to our customer.
PART II: Segmenting and targeting end-users 1) End-user survey:
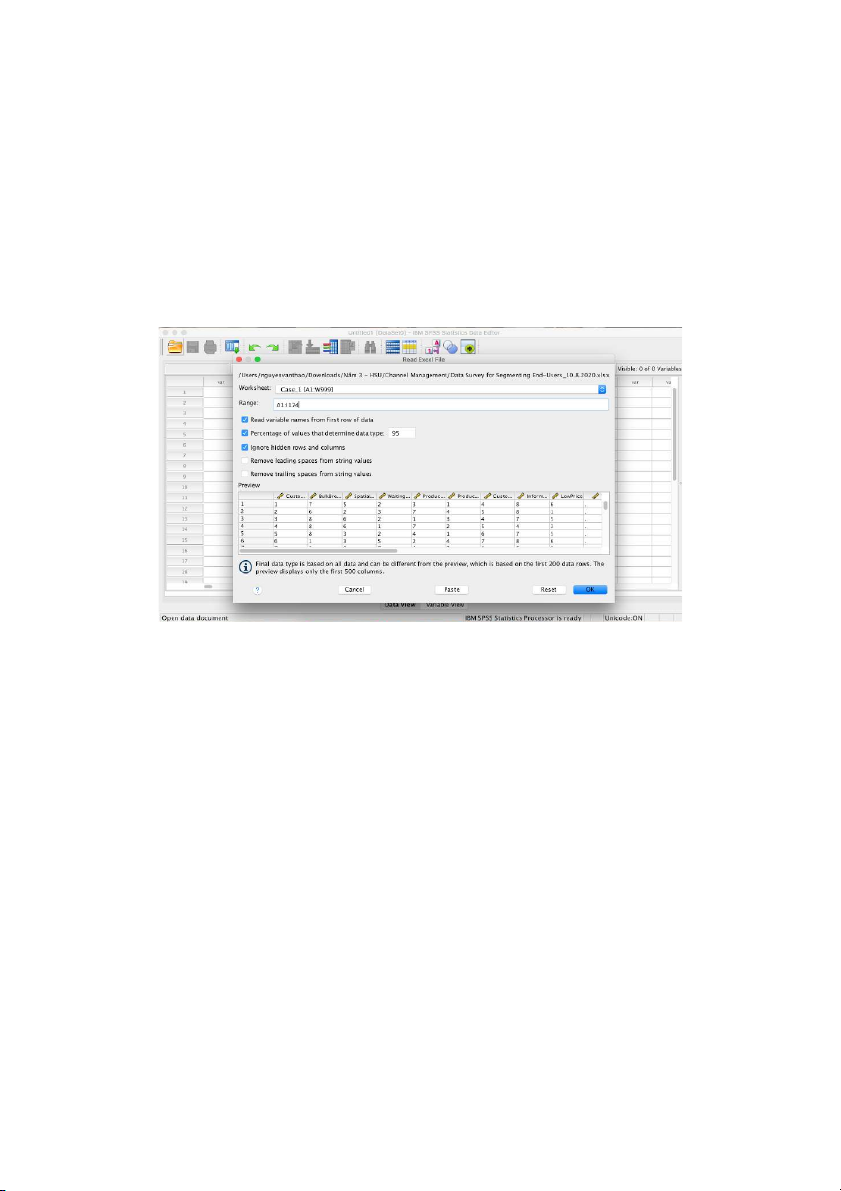
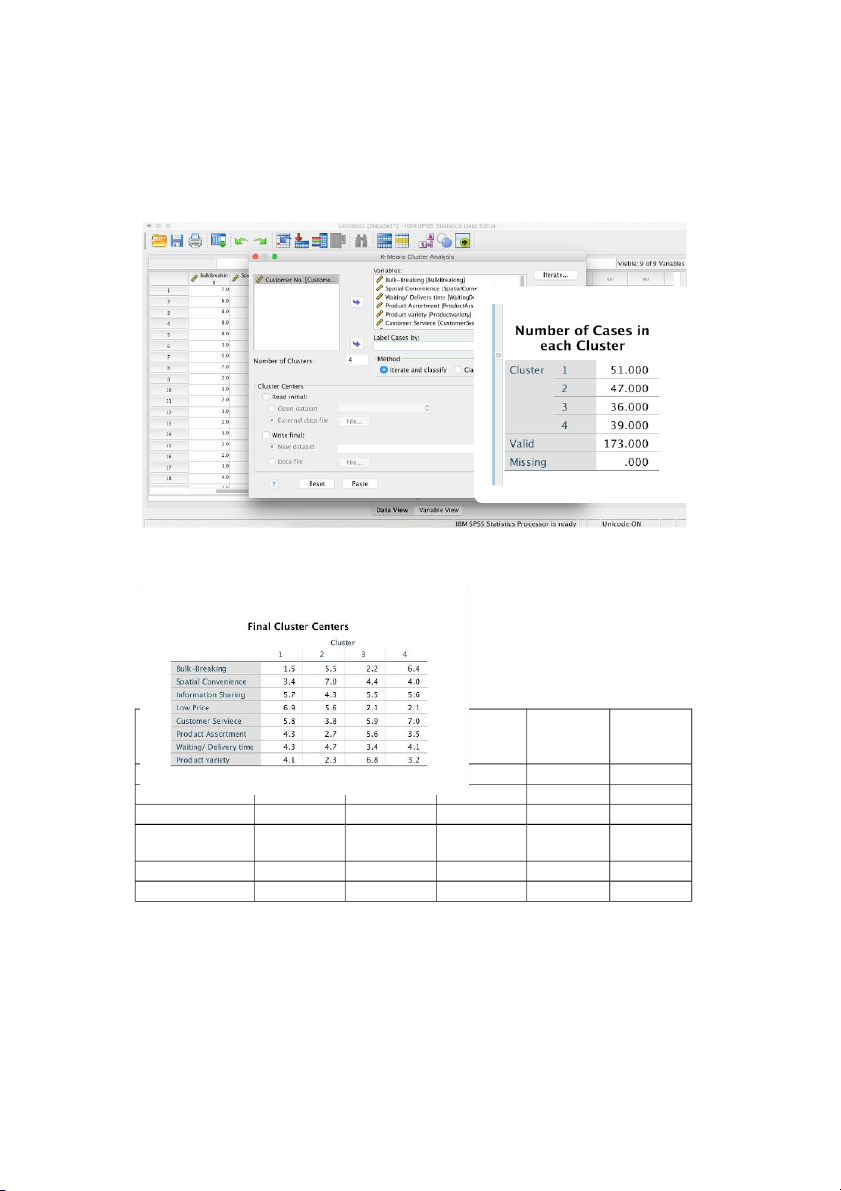
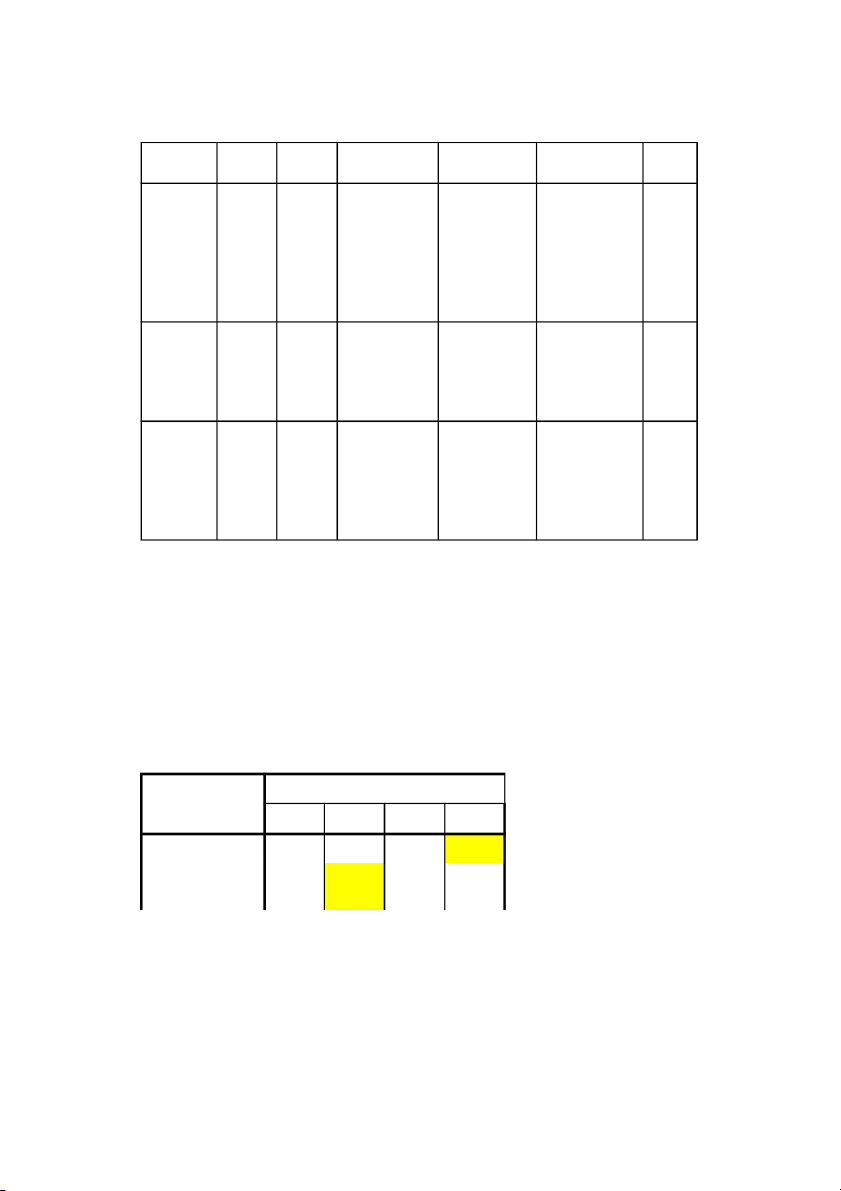
After downloading the excel file of end-user survey, we choose case 1 and set the range from A1 to I174 (A1:I174)
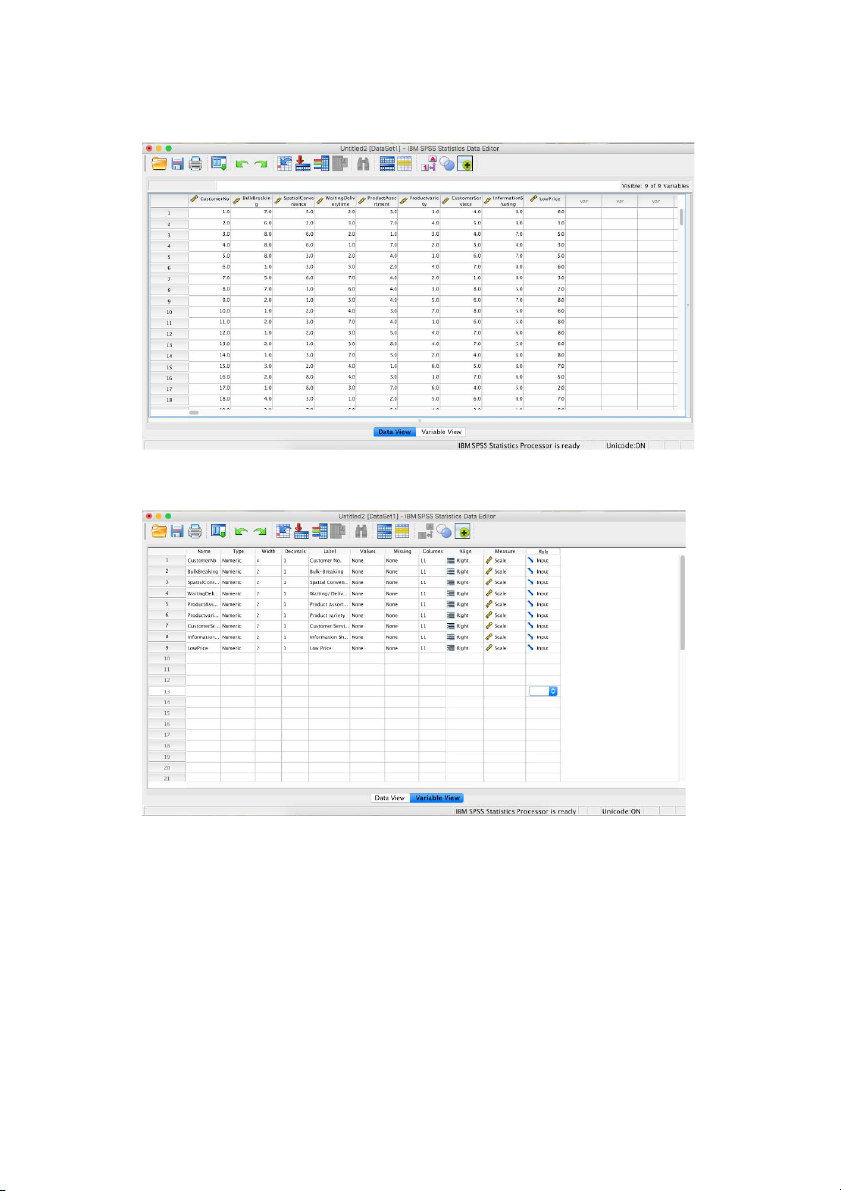
After that, we have a data view table as below:
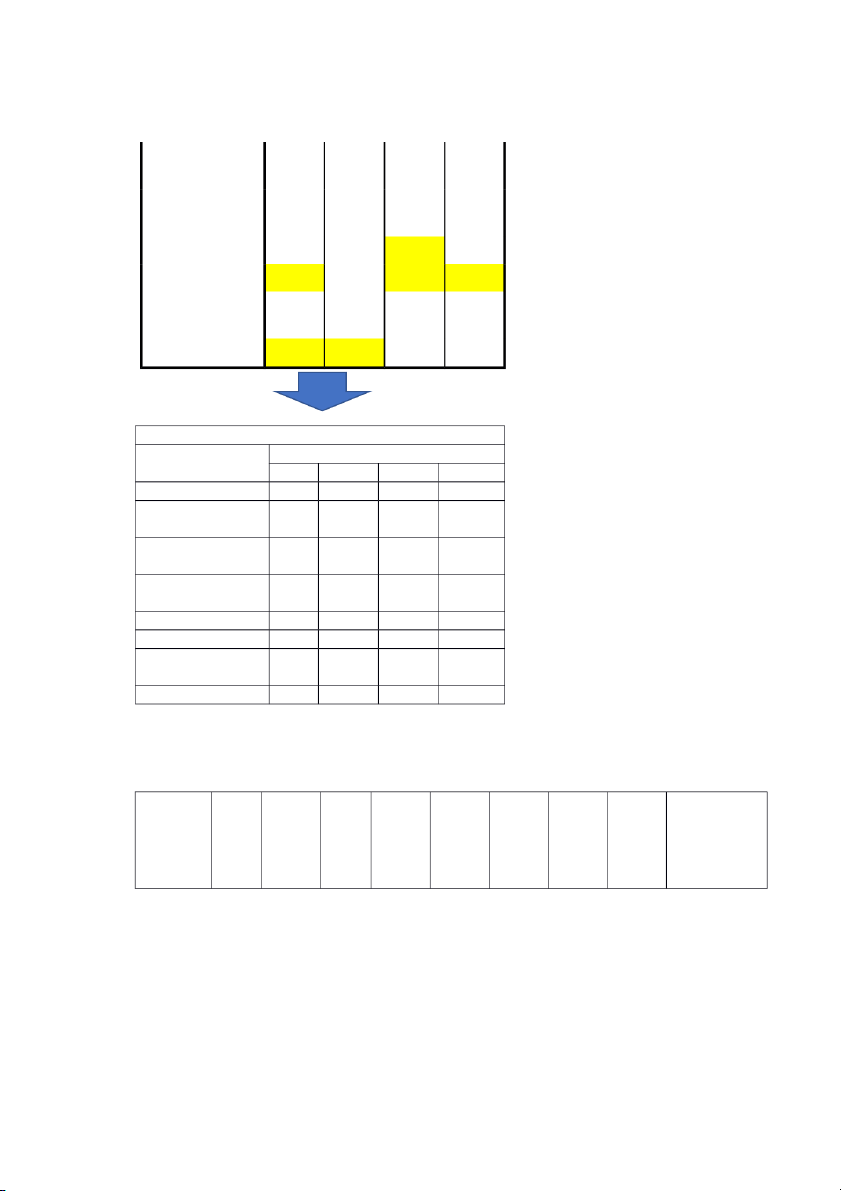
With the variable view table, we change decimal from 0 into 1 at the measure section.
Continuosly, we choose Analysis → Classify
→ Kmean cluster then get a table as below.
In this table, we put every section from the left to the Varibles section except Customer
No, then change Number of cluster into 4.
After pressing the OK button, we get the data consist 2 table as below which are Final
Cluster Center and Number of Cases in each Cluster. 2) Evaluation of end- user segmentation and targeting results: Neither 4 - Agree 5- Fully agree agree agree 5 Accessible? 4 Substantial? 4 Differentiable 3 ? Actionable? 4 Total 20 a) Measurable:
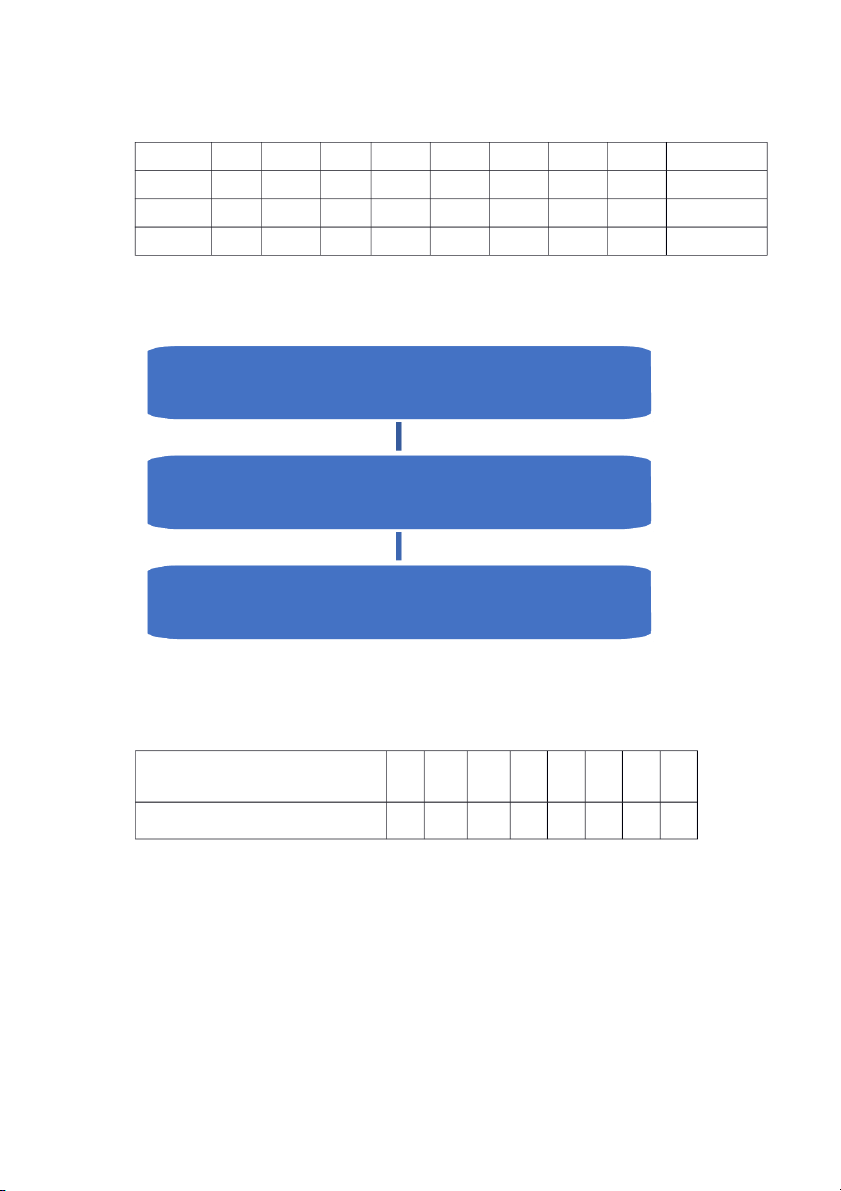
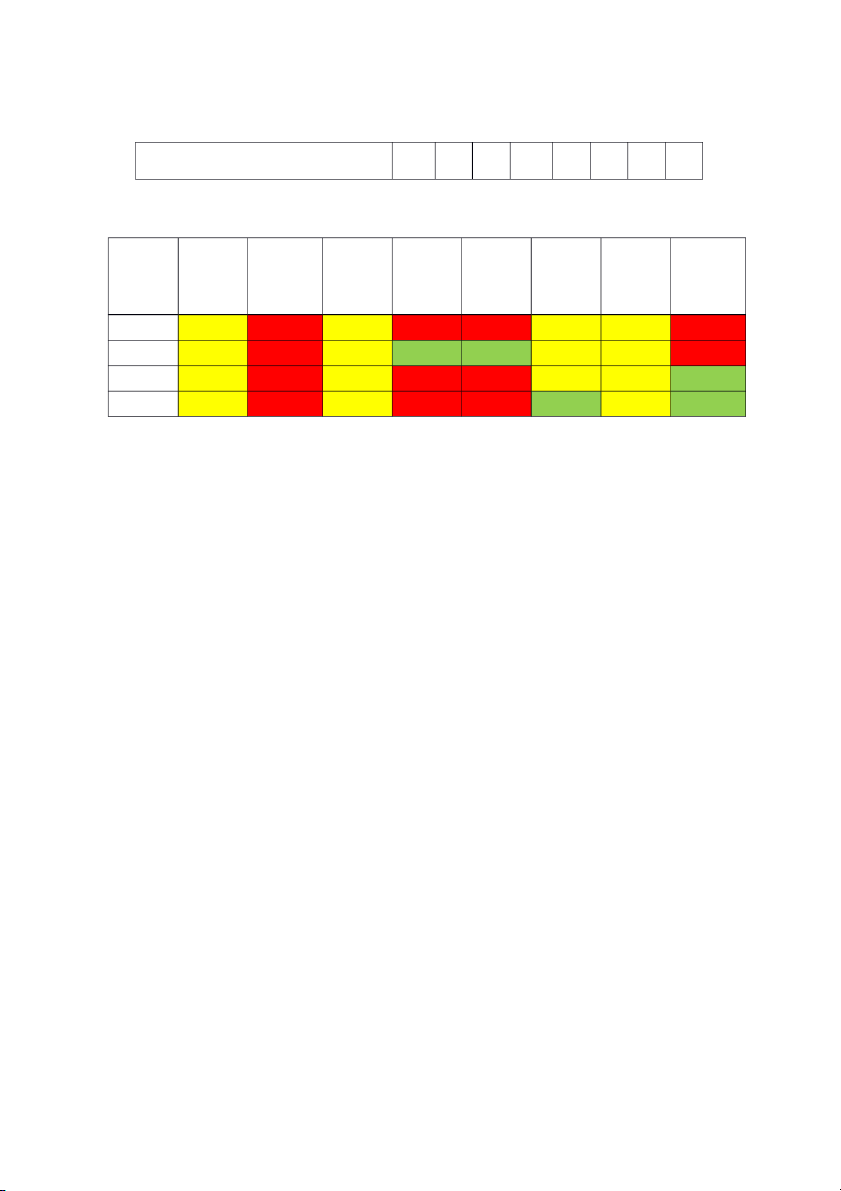
Example: The result from Cluster analysis (from SPSS output) 1 51.000 2 47.000 Cluster 3 36.000 4 39.000 Valid 173.000
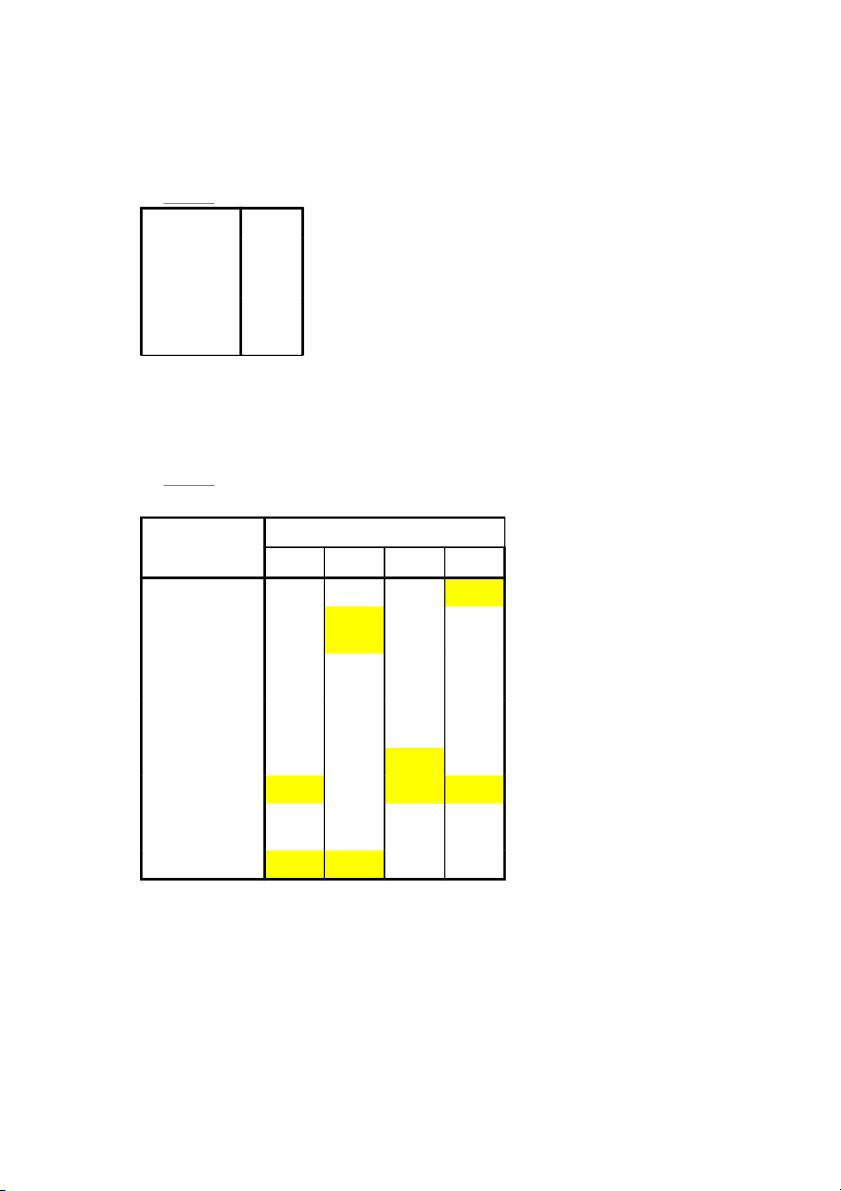
Our customers are segmented into 4 segments, each segment is assigned 1.25 points,
and we can measure the size of individual segments, so we grade 5 (1.25 x 4 segments) in the above table. b) Accessible The mark :
et segments can be effectively reached and served.
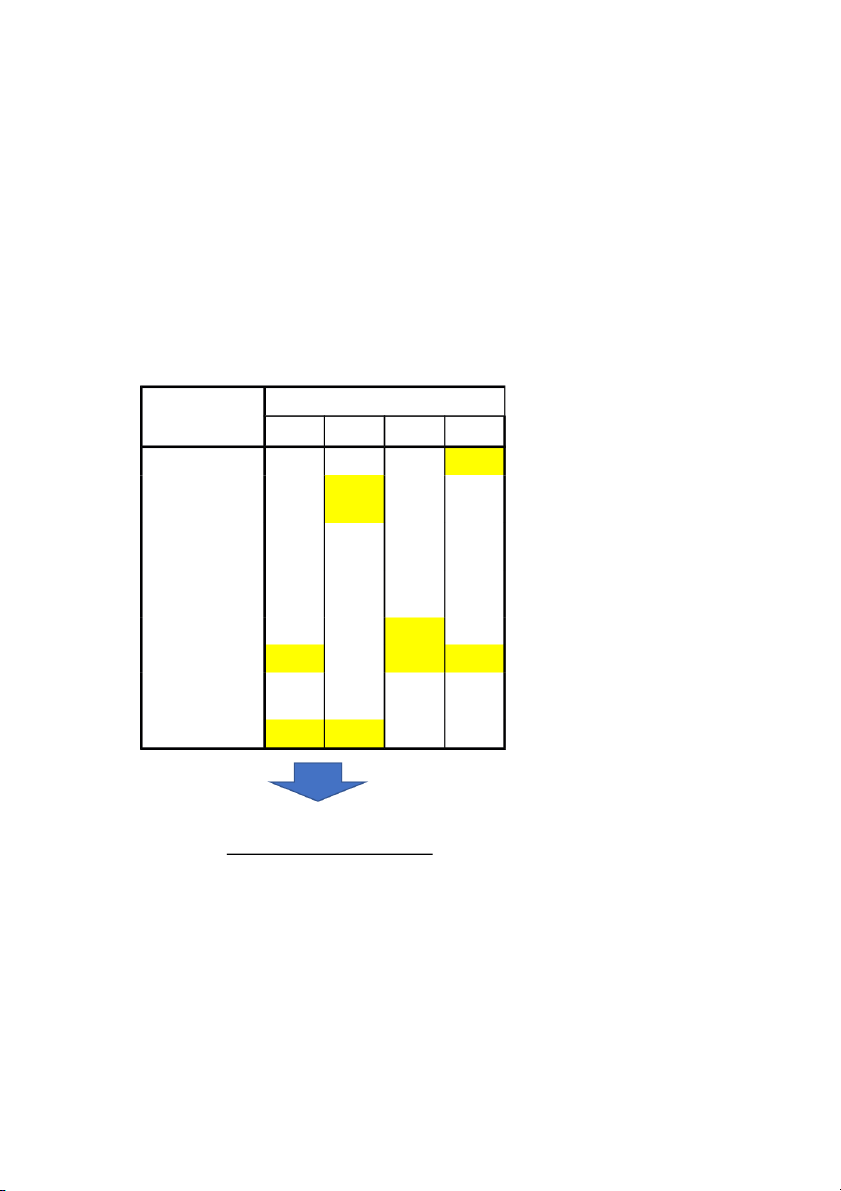
Example: The results from cluster analysis Final Cluster Centers Cluster 1 2 3 4 Bulk-Breaking 1.5 5.5 2.2 6.4 Spatial 3.4 7.0 4.4 4.0 Convenience Waiting/ Delivery 4.3 4.7 3.4 4.1 time Product 4.3 2.7 5.6 3.5 Assortment Product variety 4.1 2.3 6.8 3.2 Customer Serviece 5.8 3.8 5.9 7.0 Information 5.7 4.3 5.5 5.6 Sharing Low Price 6.9 5.6 2.1 2.1
We chose to serve 4 segments. It means for each segment we reached and served
effectively we will allocate 1.25 point. Based on information in our case, we come to
the conclusion about final point of the 4 segments which is illustrated in the table above
c) Substantial: Our case doesn’t have any information about out proceed but after
consulting about firm, we can see that our firm have a large scale. Therefore, we
assume that out firm can satify the 4 segments.ifferentiable. d) Differentiable. Final Cluster Centers Cluster 1 2 3 4 Bulk-Breaking 1.5 5.5 2.2 6.4 Spatial 3.4 7.0 4.4 4.0 Convenience Waiting/ Delivery 4.3 4.7 3.4 4.1 time Product 4.3 2.7 5.6 3.5 Assortment Product variety 4.1 2.3 6.8 3.2 Customer Serviece 5.8 3.8 5.9 7.0 Information 5.7 4.3 5.5 5.6 Sharing Low Price 6.9 5.6 2.1 2.1 Differentiable ratings 1st 2nd Ratings cluster cluster 1 2 0.4 3 0.4 4 0.4 2 3 0.8 4 0.8 3 4 0.4 Total 3.2
e) Actionable: Effective programs can be designed for attracting and serving the segments.
Based on our case, we come to the conlusion as below -
Because cluster 1 only satify customer service and low price, we point it 1,25. -
Cluster 3 only satify customer service but not product variety so we point it 0,6
Actionable: 1,25x3 + 0.6= 4.35 point 3)
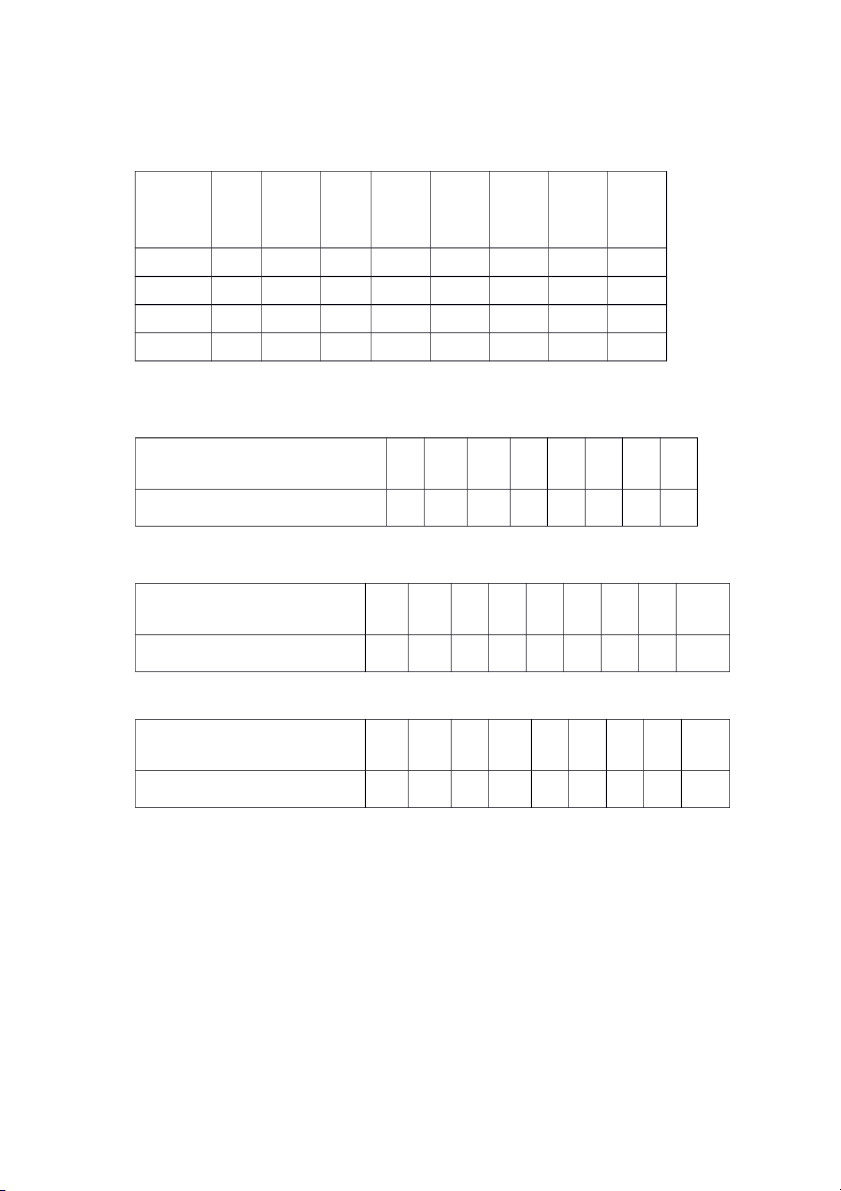
End-user analysis - evaluation of segment attractiveness:
Evaluation of segment attractiveness:
Segments Market Market Competition Company’s Company’s Total size growth intensity objectives capabilities points (1) (2) (3) (4) (5) (6) Segment 10 3
3 (has a lot 9 (satisfy 9 (can provide 34 1 competitor low price enough due to having market) machine and low price) conponent for products) Segment 8 8
7 (has a few 7 (capable 6 (is under 36 2 competitor of consideration
due to the distributing) of opening advantage of more great distributors) distribution) Segment 5 7 2 (has many 5 (no 6 (capable of 21 3 disavantage information develop new
due to poor mentioned in products) diversity) our case) Segment 6 9
8 (has great 7 (unsure if 7 37 4 advantage personal due to 50% selling is off in service suitable) call)
Segment 4 has the highest point
Segment 2 has the second highest point
Segment 1 has nearly lowest point
And segment 3 has the lowest point
PART III: DETERMINATION OF SERVICE GAPS
1) Channel analysis-service demand: Final Cluster Centers Cluster 1 2 3 4 Bulk-Breaking 1.5 5.5 2.2 6.4 Spatial 3.4 7.0 4.4 4.0 Convenience Waiting/ Delivery 4.3 4.7 3.4 4.1 time Product 4.3 2.7 5.6 3.5 Assortment Product variety 4.1 2.3 6.8 3.2 Customer Serviece 5.8 3.8 5.9 7.0 Information 5.7 4.3 5.5 5.6 Sharing Low Price 6.9 5.6 2.1 2.1 Final Cluster Centers Cluster 1 2 3 4 Bulk-Breaking L M L H Spatial M H M M Convenience Waiting/ Delivery M M M M time Product M L M M Assortment Product variety M L H M Customer Serviece M M M H Information M M M M Sharing Low Price H M L L
Transpose columns into rows as follows:
Table 1: Service outputs demanded by End-users Segment BB SC DT PA PV CS IS LP Channel Name/ route for this (1) (2) (3) (4) (5) (6) (7) (8) segment (A) (B) 1 L M M M M M M H 2 M H M L L M L M 3 L M M M H M M L 4 H M M M M H M L
2) Channel analysis-service supply (SS):
The existing channel system our firm: Manufacture Own store (physical retailer) End-user
Based on the Table 2, we can describe the level of service outputs supplied by the firm as follows:
Table 2: Service outputs provided (SS = Service Supplied) by each channel route: Channel routes BB SC WT PA PV CS IS LP (B) (1) (2) (3) (4) (5) (6) (7) (8) M own store (ph → ysical retailer) H L H L L H H L →E/U
3) Matching routes with segments:
Table 3.1: Service outputs demanded (SD) by End-users per segment Segment BB SC DT PA PV CS IS LP Name/ (1) (2) (3) (4) (5) (6) (7) (8) (A) 1 L M M M M M M H 2 M H M L L M L M 3 L M M M H M M L 4 H M M M M H M L
Table 3.2: Service outputs provided (SS = Service Supplied) by each channel route Channel routes BB SC WT PA PV CS IS LP (B) (1) (2) (3) (4) (5) (6) (7) (8) M own store (ph → ysical retailer) H L H L L H H L →E/U
Determine the chanel route for segment 1 Channel routes BB SC WT PA PV CS IS LP Total (B) (1) (2) (3) (4) (5) (6) (7) (8) M own store (ph → ysical retailer) 1 1 1 1 1 1 1 1 8 →E/U
Determine the chanel route for segment 2 Channel routes BB SC WT PA PV CS IS LP Total (B) (1) (2) (3) (4) (5) (6) (7) (8) M own store (ph → ysical retailer) 1 1 1 0 0 1 1 1 6 →E/U
Determine the chanel route for segment 3 Channel routes BB SC WT PA PV CS IS LP Total (B) (1) (2) (3) (4) (5) (6) (7) (8) M own store (ph → ysical retailer) 1 1 1 1 1 1 1 0 7 →E/U
Determine the chanel route for segment 4 Channel routes BB SC WT PA PV CS IS LP Total (B) (1) (2) (3) (4) (5) (6) (7) (8) M own store (ph → ysical retailer) 0 1 1 1 1 0 1 0 5 →E/U Summary of the result Channel routes seg. 1 seg. 2 seg. 3 seg. 4 M own stor →
e (physical retailer) E/U → 8 6 7 5
Conclusion: Because we’re currenly having 1 channel route, we will use this
route for segment 1, 2, 3 and 4
4) Determination of sevice gap:
Table 4.1: Service outputs demanded (SD) by End-users per segment Segment BB SC DT PA PV CS IS LP Name/ (1) (2) (3) (4) (5) (6) (7) (8) (A) 1 L M M M M M M H 2 M H M L L M L M 3 L M M M H M M L 4 H M M M M H M L
Table 4.2: Service outputs provided (SS = Service Supplied) by each channel route Channel routes BB SC WT PA PV CS IS LP (B) (1) (2) (3) (4) (5) (6) (7) (8) M own stor → e (physical retailer) H L H L L H H L →E/U
Table 4.3: Comparing SS and SD for each cells Segment BB SC DT PA PV CS IS LP Name/ (1) (2) (3) (4) (5) (6) (7) (8) (A) 1 L(SS>SD) M (SS M(SS>SD) M(SS M(SS M(SS>SD) M(SS>SD) H(SS 2 M(SS>SD) H(SS M(SS>SD) L(SS=SD) L(SS=SD) M(SS>SD) L(SS>SD) M(SS 3 L(SS>SD) M(SS M(SS>SD) M(SS H(SS M(SS>SD) M(SS>SD) L(SS=SD) 4 H(SS=SD) M(SS M(SS>SD) M(SS M(SS H(SS=SD) M(SS>SD) L(SS=SD
PART IV: PROPOSED NEW MARKETING CHANNELS
1) Deciding whether to add new channel routes:
Based on the service gaps identified in the exercise 3, we know that the channel
route create the Spacial Convenience more than required by end-user. Those
gaps cannot satisfy the end-users of the 4 segments.
Moreover, this channel also create Higher Price than required by end-user of
segment 1, 2 and Product Assortment and Product Variety than required by end-
user of segment 1, 3 & 4.
Additional, due to the determination point in the exercise 3 which come to the
conclusion of finding another route for segment 1 and 3, they will lead to many service gaps.
Therefore, to resolve these problem, we find another channel route that might fit
best for our firm. We replace the channel M o
→ wn store (physical retailer) E/U →
by a channel M->Outsourced store (physical retailer) E/U → . Because
due to our case, if we want to create a nationwide distribution, we have to have
at least 11,500 own outlets which will be impossble to establish profitably.
Therefore, it would be easier for our firm to distribute our products to oursource
store but not just our own store.
Our firm also have our own website, which mean we can also make use of the channel M own w →
ebsite (online retailer) E/U → .
Table 1: Service outputs provided (SS = Service Supplied) by new channel routes: Channel routes BB SC DT PA PV CS IS LP (B) (1) (2) (3) (4) (5) (6) (7) (8) 2. M own we → bsite M H M L L M M L (online retailer) E/U → 6. M Outsourc → ed store H M H H H M M M
(physical retailer) →E/U
2) Compare the Service demanded (SD) with the new channel routes (SS)
Table 2: Service outputs demanded (SD) by End-users per segment after
replacement of new channels
Tài liệu liên quan:
-
Phân tích kỹ thuật Phân tích kỹ thuật không giống với phân tích cơ bản - Tài liệu tham khảo | Đại học Hoa Sen
270 135 -
Article 1 - Impact of social media in India - Tài liệu tham khảo | Đại học Hoa Sen
401 201 -
Nhượng quyền kinh doanh - báo cáo cuối kì - Tài liệu tham khảo | Đại học Hoa Sen
309 155 -
Article 1 - Impact of social media in India - Tài liệu tham khảo | Đại học Hoa Sen
348 174 -
On Lê Vũ for skylines - Exhibition introduction writing sample - Tài liệu tham khảo | Đại học Hoa Sen
297 149