Flood Monitoring & Early Warning System Using IoT | Iot và ứng dụng | Học viện Công nghệ Bưu chính Viễn thông
Flooding is one of the most severe natural disasters occurring in many regions around the world, and Vietn no exception. To mitigate its impacts, flood monitoring and early warning are essential. By integrating Inter of Things (IoT) technology, people can receive accurate, real-time information about flood conditions. Thi project presents a real-time flood monitoring and early warning system using wireless sensor nodes deployed flood-prone areas. The system is integrated with the Blynk mobile application and a web-based mappin platform (web mapIOT). Tài liệu được sưu tầm và soạn thảo dưới dạng file PDF để gửi tới các bạn cùng tham khảo, ôn tập đầy đủ kiến thức, chuẩn bị cho các buổi học thật tốt. Mời bạn đọc đón xem!
Môn: IoT và ứng dụng 143 tài liệu
Trường: Học viện Công Nghệ Bưu Chính Viễn Thông 1.8 K tài liệu
Tác giả:

Preview text:
The 3 nd
Thematic Workshop on IoT Solutions for Smart Cities (SCIOT3-2025)
FLOOD MONITORING AND EARLY WARNING SYSTEM USING IOT
Le Van Ha1*, Bui Duc Huy1, Hoang Thai An1, Tran Duc Hoang Lan1, Nguyen Trung Hieu1
1Faculty of Information Technology, Posts and Telecommunications Institute of Technology, 96A Tran Phu
Street, Mo Lao Ward, Ha Dong District, Hanoi
*Email: Hamom19052004@gmail.com Abstract:
Flooding is one of the most severe natural disasters occurring in many regions around the world, and Vietn
no exception. To mitigate its impacts, flood monitoring and early warning are essential. By integrating Inter
of Things (IoT) technology, people can receive accurate, real-time information about flood conditions. Thi
project presents a real-time flood monitoring and early warning system using wireless sensor nodes deployed
flood-prone areas. The system is integrated with the Blynk mobile application and a web-based mappin
platform (web mapIOT). The wireless sensor nodes detect water levels and issue early warnings when flood
occurs. At the monitoring site, an alarm buzzer is automatically activated when the water level reache
predefined danger threshold. Simultaneously, data is transmitted to the Blynk application, allowing users to trac
conditions and receive urgent push notifications. The web mapIOT visually displays flooded areas and th
corresponding warning levels. Initial test results show that the prototype can effectively monitor, detect, an
provide timely alerts and notifications to users. This project presents a real-time flood monitoring and early
warning system using wireless sensor nodes deployed in flood-prone areas. The system is integrated with
the Blynk mobile application and a web-based mapping platform (web mapIOT). Unlike previous
solutions, a key strength of this system is the intuitive map visualization and the integration of a smart
navigation algorithm to suggest safe routes, offering comprehensive community-level monitoring and
intelligent decision support.
Keywords: Flood monitoring, Early warning system, Internet of Things (IoT), Disaster risk reduction, Blynk, mapIOT INTRODUCTION
and Blynk to send alert notifications. However,
a common gap is that these systems often focus
Flooding is one of the most common and
solely on mobile application interfaces and
devastating natural disasters in Vietnam. lack the capability for intuitive map
Traditional early warning systems are oftenvisualization to provide a comprehensive
costly, slow, and unable to provide sufficiently
geographical overview of flooding across a
detailed (hyper-local) information for residents wider area.
in high-risk areas to evacuate in a timely
manner. To address this issue, the project
Furthermore, while risk warning studies in
presents a low-cost and efficient prototype of
Vaietnam, such as the pilot study on coastal flood
flood monitoring and early warning systemrisk by T. G. Nguyen et al. [5], focus on
based on Internet of Things (IoT) technology. building risk warning systems based on general
The system uses wireless sensor nodes (ESP32
geographical data, they typically do not
and ultrasonic sensors) to continuously collectintegrate low-cost IoT solutions for collecting
water-level data. Research on IoT technologyreal-time (hyper-local) water-level data from
has increasingly become essential in solvingspecific sensor stations
problems across various fields, such as water-
quality monitoring, weather monitoring, and To overcome these limitations, our project especially flood monitoring
presents a low-cost and efficient prototype. A
key strength of the system is its multi-platform
Despite numerous studies applying IoT to flood
warning capability: sending urgent push
monitoring, existing solutions still face certainnotifications and real-time data to users’
limitations. The work by N. H. Giang and N. C.
smartphones via the Blynk application and
Minh developed an IoT-based water-level transmitting data to a web-based mapIOT
monitoring model [1]. Similarly, the study by
platform, allowing intuitive visualization of
Noar and Kamal [3] also used ultrasonic sensors
flooded locations for both the community and 1 The 3 nd
Thematic Workshop on IoT Solutions for Smart Cities (SCIOT3-2025)
authorities. The objective of the system is to
modes, enabling future enhancements such as
provide accurate, interactive, and timely water-battery- or solar-powered operation.
level information, enabling residents to be
proactive in monitoring flood conditions and reducing disaster risks.
1.2. Data Flow EXPERIMENTS
The data is processed through the following flow:
The system is developed using wireless sensor
The ESP32 station reads the water-level data
nodes deployed in high-risk flood-prone areas.and sends it to the Blynk server.
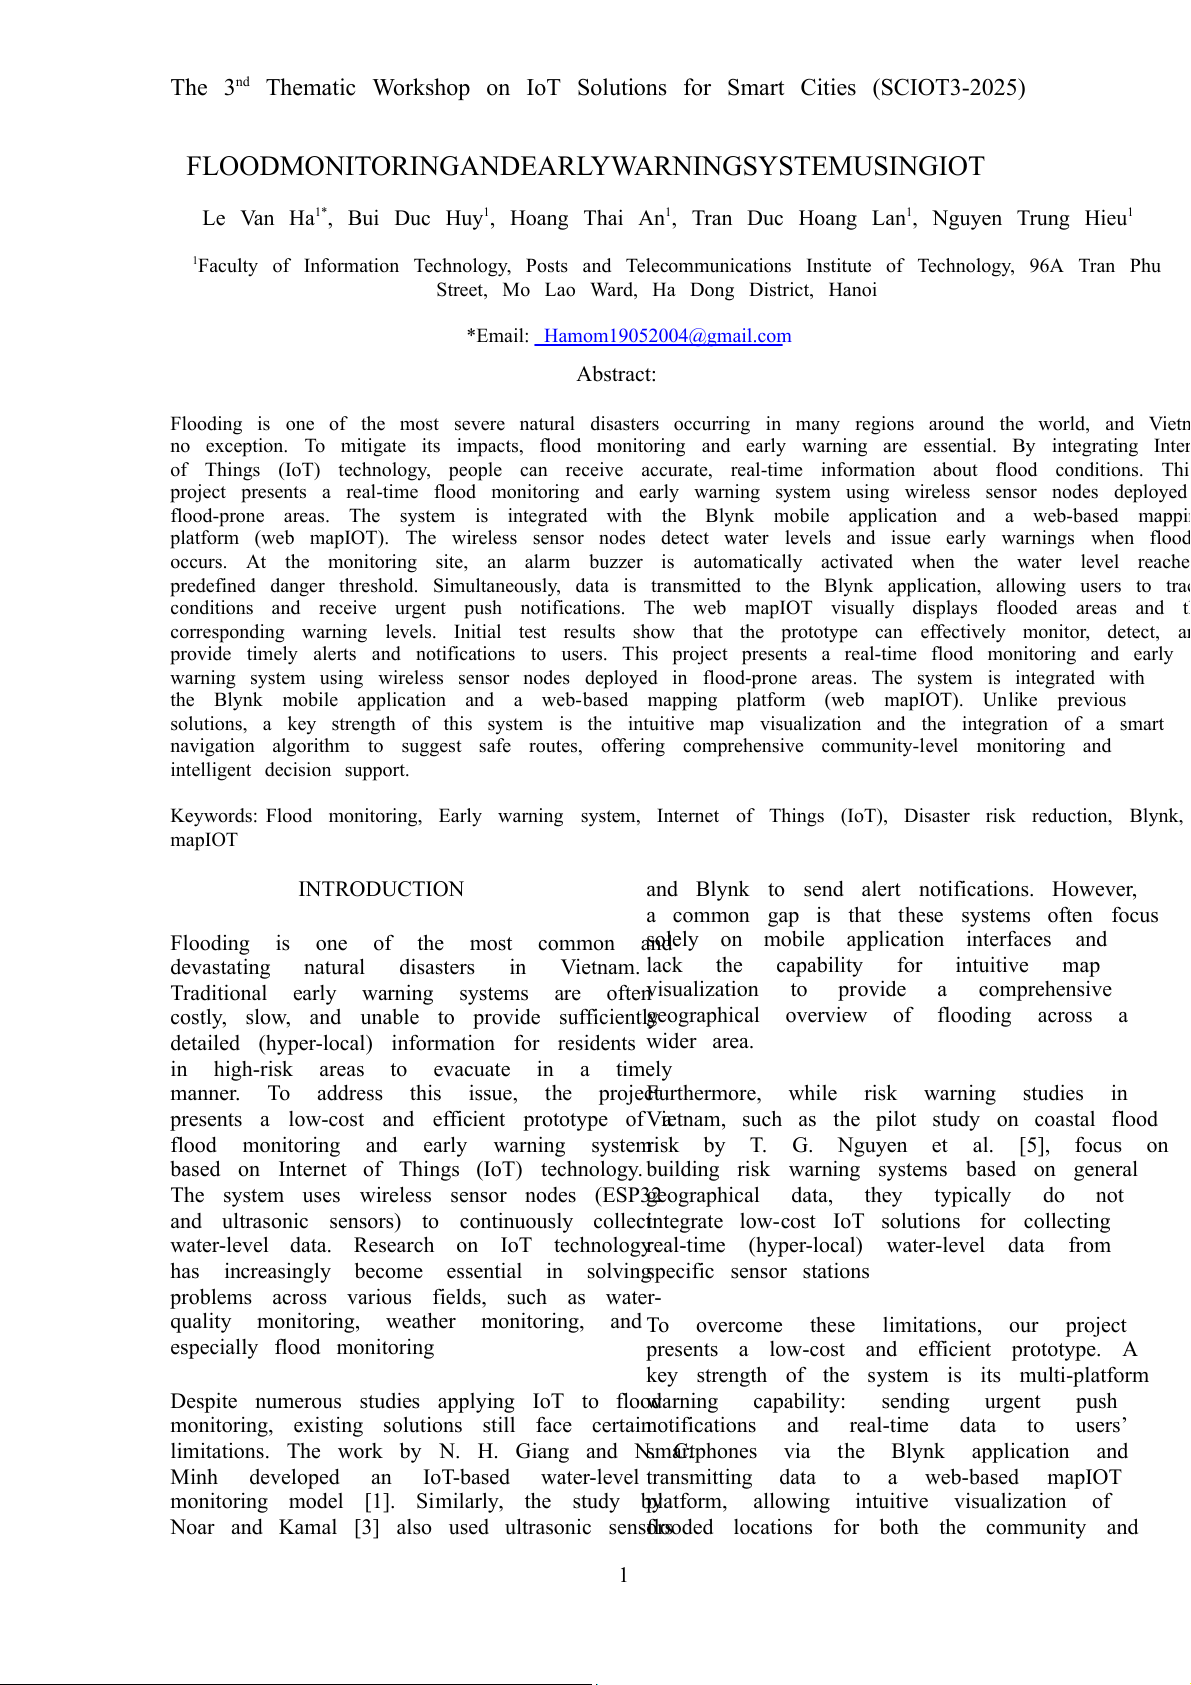
The overall architecture consists of three main
components: an on-site sensor station, aBlynk (using Webhooks or API features) is then
personal alert platform (Blynk mobile configured to forward notifications or data to a
application)[3], and a community monitoring Web Map IoT server for visualizing flood alert platform (web mapIOT). data on a map.
1.3. Hardware Components
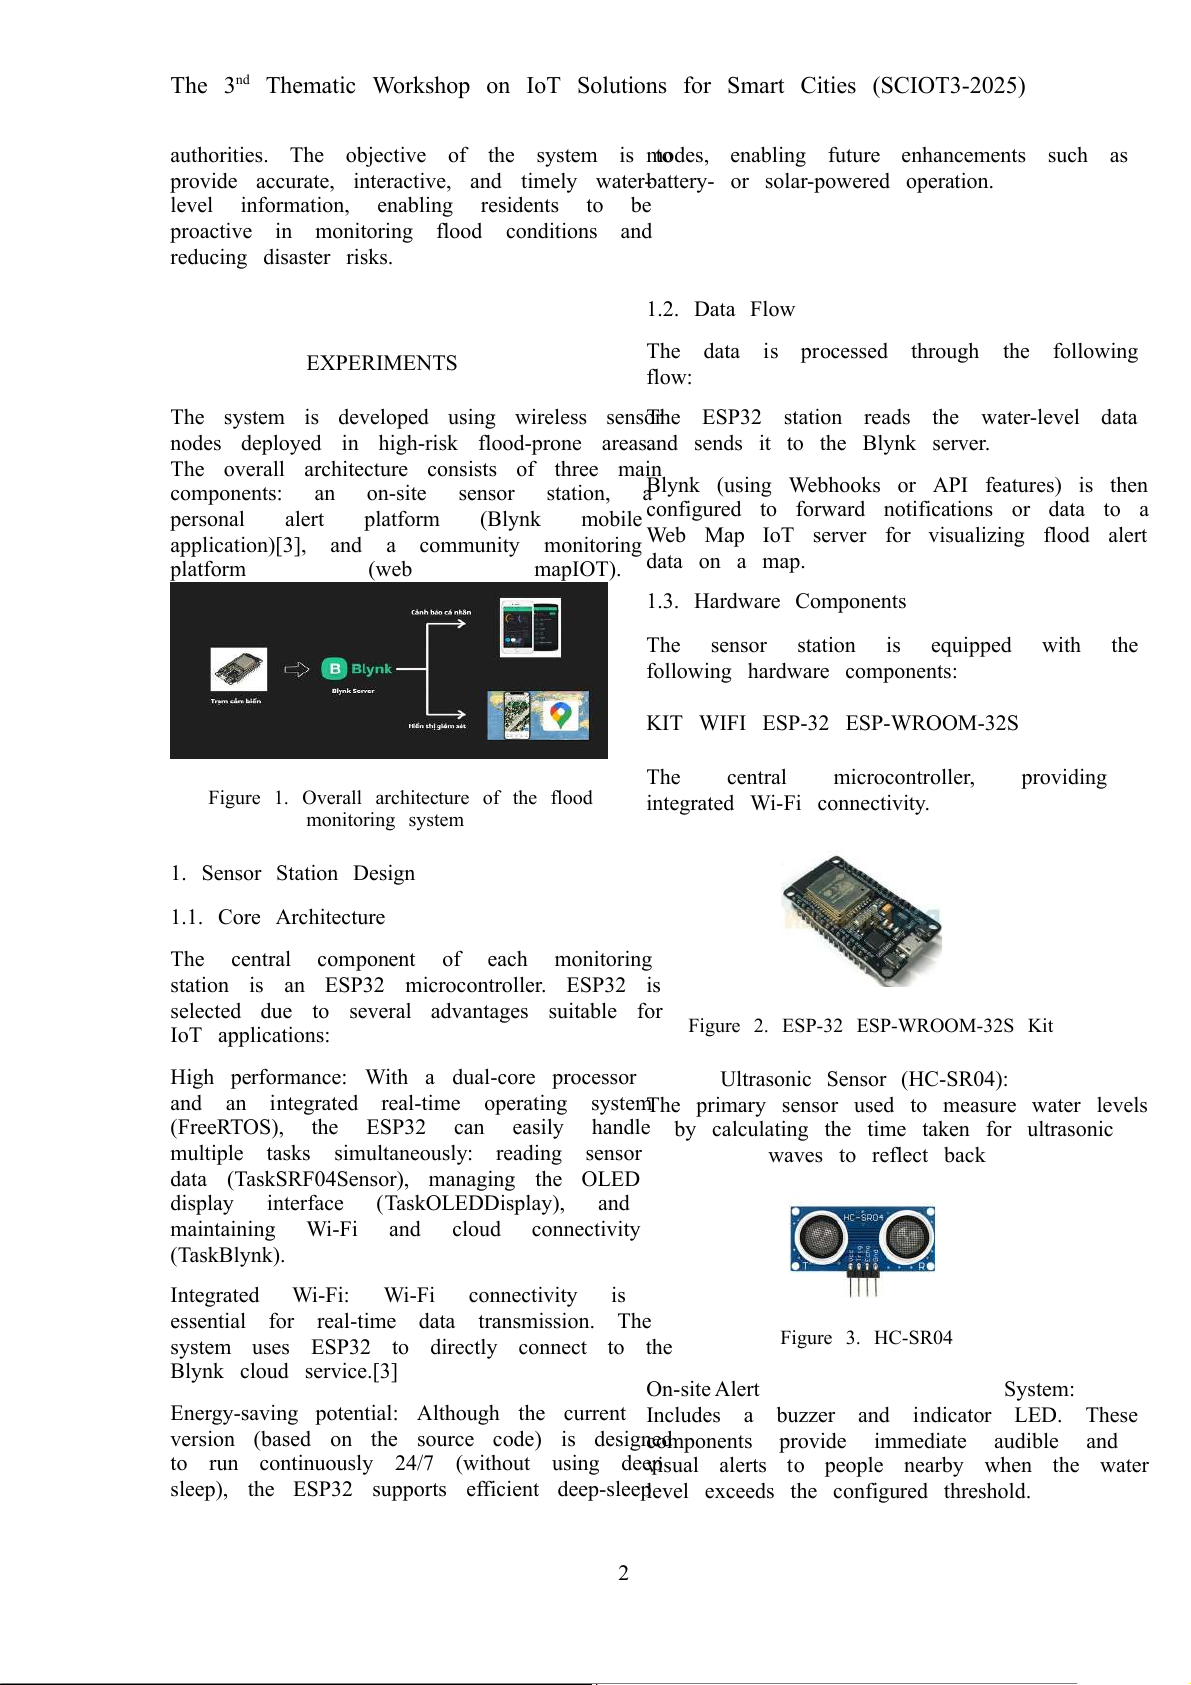
The sensor station is equipped with the following hardware components: KIT WIFI ESP-32 ESP-WROOM-32S
The central microcontroller, providing
Figure 1. Overall architecture of the flood integrated Wi-Fi connectivity. monitoring system
1. Sensor Station Design
1.1. Core Architecture
The central component of each monitoring
station is an ESP32 microcontroller. ESP32 is
selected due to several advantages suitable for IoT applications:
Figure 2. ESP-32 ESP-WROOM-32S Kit
High performance: With a dual-core processor
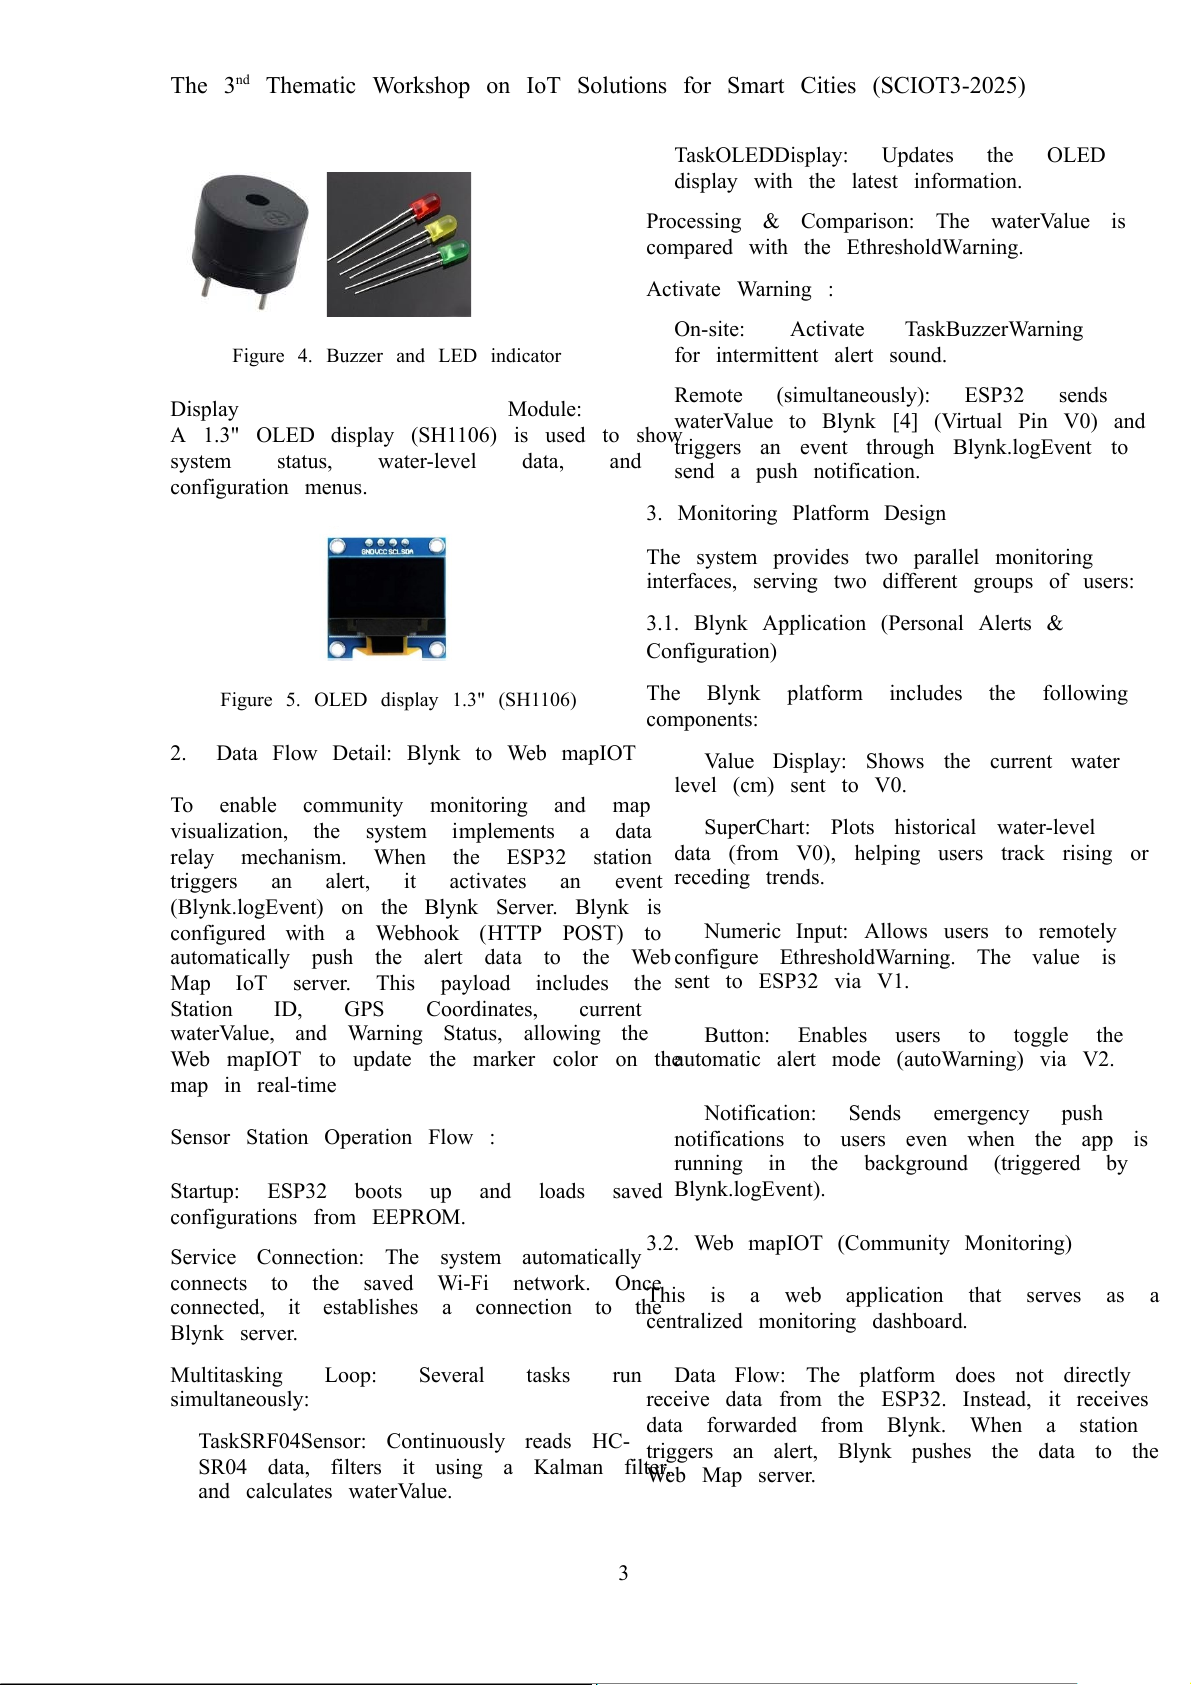
Ultrasonic Sensor (HC-SR04):
and an integrated real-time operating systemThe primary sensor used to measure water levels
(FreeRTOS), the ESP32 can easily handle by calculating the time taken for ultrasonic
multiple tasks simultaneously: reading sensor waves to reflect back
data (TaskSRF04Sensor), managing the OLED
display interface (TaskOLEDDisplay), and
maintaining Wi-Fi and cloud connectivity (TaskBlynk).
Integrated Wi-Fi: Wi-Fi connectivity is
essential for real-time data transmission. The
system uses ESP32 to directly connect to the
Figure 3. HC-SR04 Blynk cloud service.[3] On-site Alert System:
Energy-saving potential: Although the current Includes a buzzer and indicator LED. These
version (based on the source code) is designed
components provide immediate audible and
to run continuously 24/7 (without using deep
visual alerts to people nearby when the water
sleep), the ESP32 supports efficient deep-sleeplevel exceeds the configured threshold. 2 The 3 nd
Thematic Workshop on IoT Solutions for Smart Cities (SCIOT3-2025)
TaskOLEDDisplay: Updates the OLED
display with the latest information.
Processing & Comparison: The waterValue is
compared with the EthresholdWarning. Activate Warning : On-site: Activate TaskBuzzerWarning
Figure 4. Buzzer and LED indicator for intermittent alert sound.
Remote (simultaneously): ESP32 sends Display Module:
waterValue to Blynk [4] (Virtual Pin V0) and
A 1.3" OLED display (SH1106) is used to showtriggers an event through Blynk.logEvent to
system status, water-level data, and send a push notification. configuration menus.
3. Monitoring Platform Design
The system provides two parallel monitoring
interfaces, serving two different groups of users:
3.1. Blynk Application (Personal Alerts & Configuration)
Figure 5. OLED display 1.3" (SH1106)
The Blynk platform includes the following components:
2. Data Flow Detail: Blynk to Web mapIOT
Value Display: Shows the current water level (cm) sent to V0.
To enable community monitoring and map
visualization, the system implements a data
SuperChart: Plots historical water-level
relay mechanism. When the ESP32 station data (from V0), helping users track rising or
triggers an alert, it activates an event receding trends.
(Blynk.logEvent) on the Blynk Server. Blynk is
configured with a Webhook (HTTP POST) to
Numeric Input: Allows users to remotely
automatically push the alert data to the Web configure EthresholdWarning. The value is
Map IoT server. This payload includes the sent to ESP32 via V1.
Station ID, GPS Coordinates, current
waterValue, and Warning Status, allowing the
Button: Enables users to toggle the
Web mapIOT to update the marker color on theautomatic alert mode (autoWarning) via V2. map in real-time
Notification: Sends emergency push
Sensor Station Operation Flow :
notifications to users even when the app is
running in the background (triggered by
Startup: ESP32 boots up and loads saved Blynk.logEvent). configurations from EEPROM.
3.2. Web mapIOT (Community Monitoring)
Service Connection: The system automatically
connects to the saved Wi-Fi network. Once
connected, it establishes a connection to the
This is a web application that serves as a Blynk server.
centralized monitoring dashboard.
Multitasking Loop: Several tasks run
Data Flow: The platform does not directly simultaneously:
receive data from the ESP32. Instead, it receives
data forwarded from Blynk. When a station
TaskSRF04Sensor: Continuously reads HC- triggers an alert, Blynk pushes the data to the
SR04 data, filters it using a Kalman filter, Web Map server. and calculates waterValue. 3 The 3 nd
Thematic Workshop on IoT Solutions for Smart Cities (SCIOT3-2025)
Map Interface: Uses map APIs (e.g.,
Google Maps) to display the locations of all sensor stations.[5]
Data Visualization: Each station is
represented by a marker whose color
changes in real-time (Green → Yellow → Red)
based on the warning status received from Blynk.
Detail View: When users click on a station, a
pop-up window displays detailed information,
including the exact water level and its historical data.
Figure 6: Simulated system pinout diagram
Smart Navigation: The system integrates
GPS to track the user's real-time location and
Table 1: Expected Warning Levels
allows destination selection. It features a routing
algorithm that automatically suggests paths to Warning Level Water Level
bypass areas marked as Warning or Danger, Threshold
helping users avoid flooded routes. (waterValue) Weather Integration: The interface Severe Flooding > 20 cm
incorporates real-time weather forecast records (Red)
to display rainfall metrics. This allows users to Mild Flooding 5 cm – 19 cm
correlate current water levels with rain intensity
for better preparedness. [6] (Yellow) Safe Zone (Green) < 5 cm
The establishment of warning thresholds (Table
1) is based on an assessment of urban traffic
safety risks and the operational capacity of
common vehicles in the deployment area.
RESULTS AND DISCUSSION Specifically:
The experimental setup utilized an ESP-32 ESP-
Safe Zone ( <5cm): A water level below
WROOM-32S microcontroller integrated with
5cm is considered negligible standing
an HC-SR04 ultrasonic sensor and local alert
water and does not impede vehicle
components (buzzer and LED indicator). The
traffic or pedestrian movement.
system was tested against expected warning levels (Table 1)
Mild Flooding (5cm – 19cm) This
threshold begins at 5cm and extends to the level where small vehicles
(motorcycles) face a high risk of engine
failure (hydro-locking/flooded exhaust),
and drivers begin to have difficulty maintaining a safe speed.
Severe Flooding (> 20cm) The 20cm
water level is considered a danger
threshold1. At this level, the risk to both passenger cars and two-wheeled
vehicles increases significantly 2, 4 The 3 nd
Thematic Workshop on IoT Solutions for Smart Cities (SCIOT3-2025)
leading to the activation of the on-site
alert (buzzer) 3and emergency push
notifications4. The Web Map IOT
platform will mark this area as Danger and the routing algorithm will automatically avoid this route
Figure 9: The notification is displayed on the LED screen
Figure 8 shows the notifications sent to the
user’s email when the water level reaches a
critical level. This allows users to know the
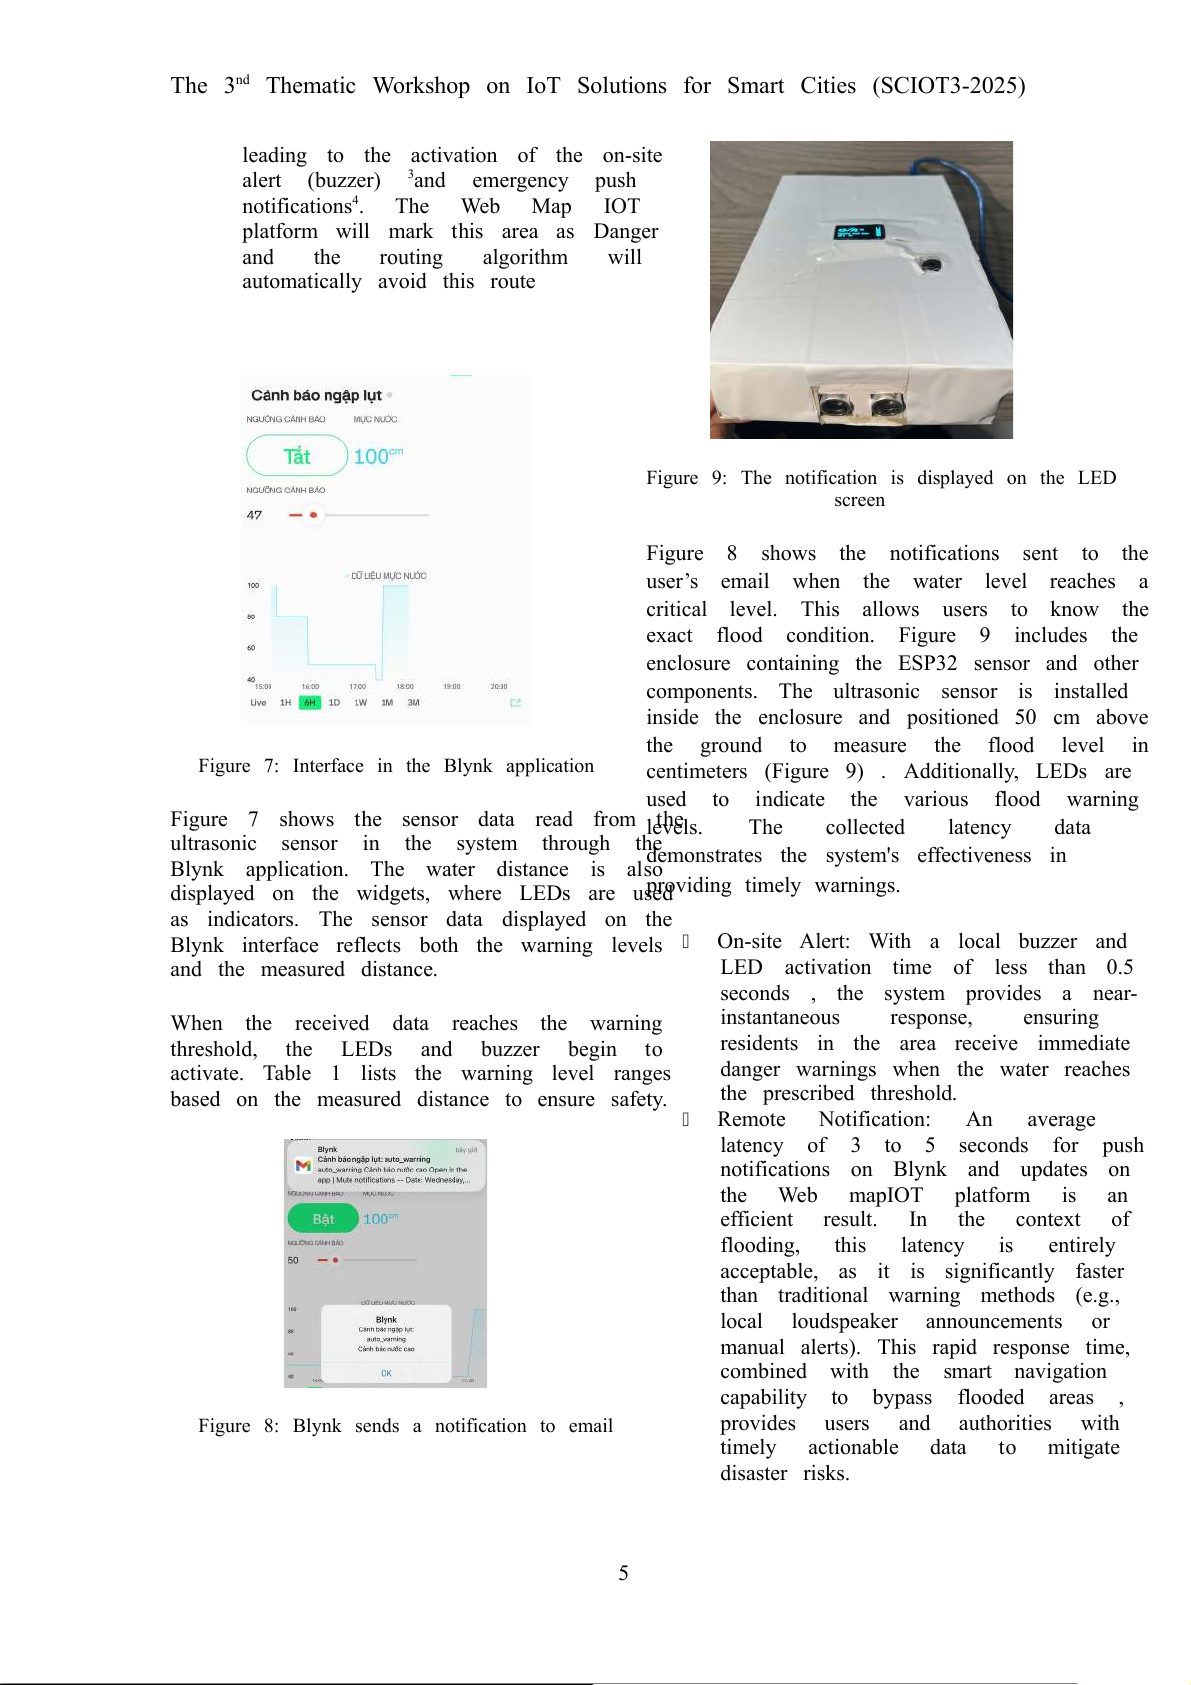
exact flood condition. Figure 9 includes the
enclosure containing the ESP32 sensor and other
components. The ultrasonic sensor is installed
inside the enclosure and positioned 50 cm above
the ground to measure the flood level in
Figure 7: Interface in the Blynk application
centimeters (Figure 9) . Additionally, LEDs are
used to indicate the various flood warning
Figure 7 shows the sensor data read from the levels. The collected latency data
ultrasonic sensor in the system through the demonstrates
Blynk application. The water distance is also the system's effectiveness in
displayed on the widgets, where LEDs are used providing timely warnings.
as indicators. The sensor data displayed on the
Blynk interface reflects both the warning levels
On-site Alert: With a local buzzer and and the measured distance.
LED activation time of less than 0.5
seconds , the system provides a near-
When the received data reaches the warning
instantaneous response, ensuring
threshold, the LEDs and buzzer begin to
residents in the area receive immediate
activate. Table 1 lists the warning level ranges
danger warnings when the water reaches
based on the measured distance to ensure safety. the prescribed threshold.
Remote Notification: An average
latency of 3 to 5 seconds for push
notifications on Blynk and updates on the Web mapIOT platform is an
efficient result. In the context of
flooding, this latency is entirely
acceptable, as it is significantly faster
than traditional warning methods (e.g.,
local loudspeaker announcements or
manual alerts). This rapid response time,
combined with the smart navigation
capability to bypass flooded areas ,
Figure 8: Blynk sends a notification to email
provides users and authorities with
timely actionable data to mitigate disaster risks. 5 The 3 nd
Thematic Workshop on IoT Solutions for Smart Cities (SCIOT3-2025)
and, importantly, supports energy-saving
deep-sleep modes. Furthermore, the system's
ability to remotely configure the warning
threshold via the Blynk Numeric Input
widget enhances operational flexibility,
surpassing the static configurations often
found in similar sensor network deployments.
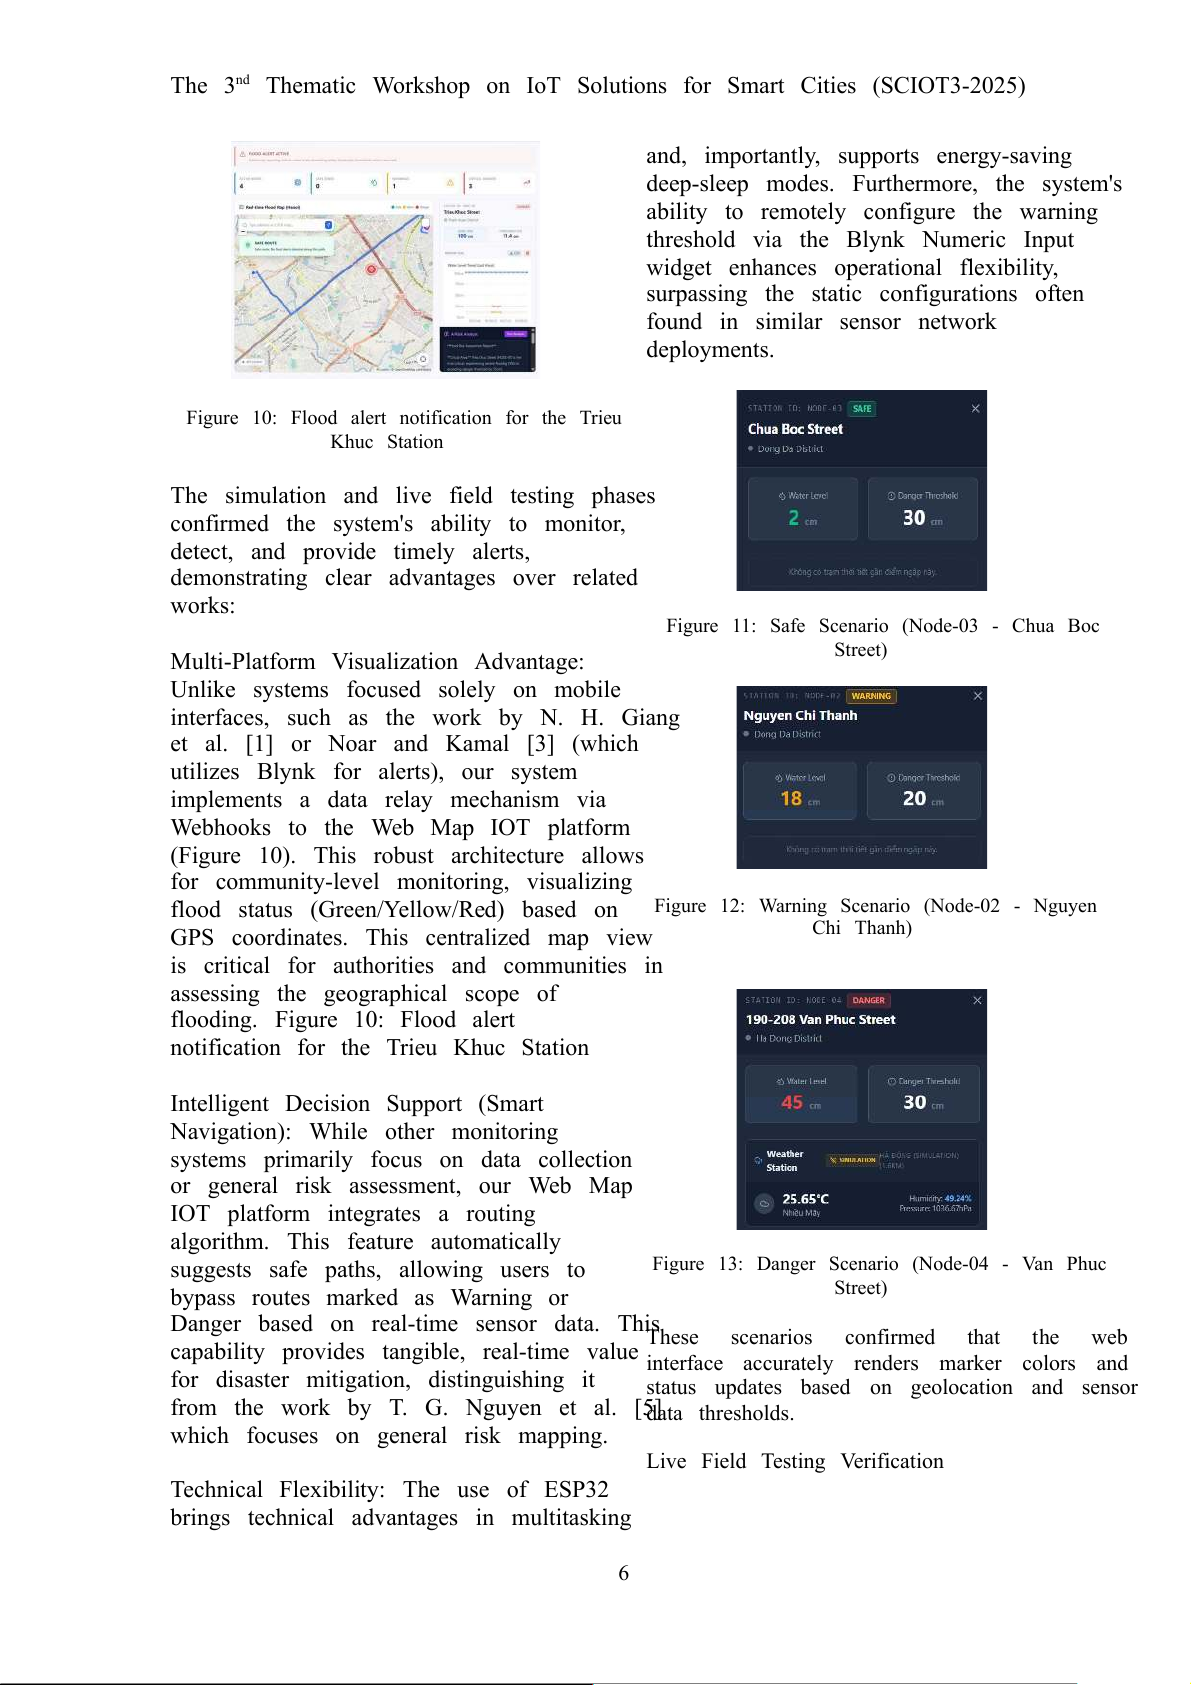
Figure 10: Flood alert notification for the Trieu Khuc Station
The simulation and live field testing phases
confirmed the system's ability to monitor,
detect, and provide timely alerts,
demonstrating clear advantages over related works:
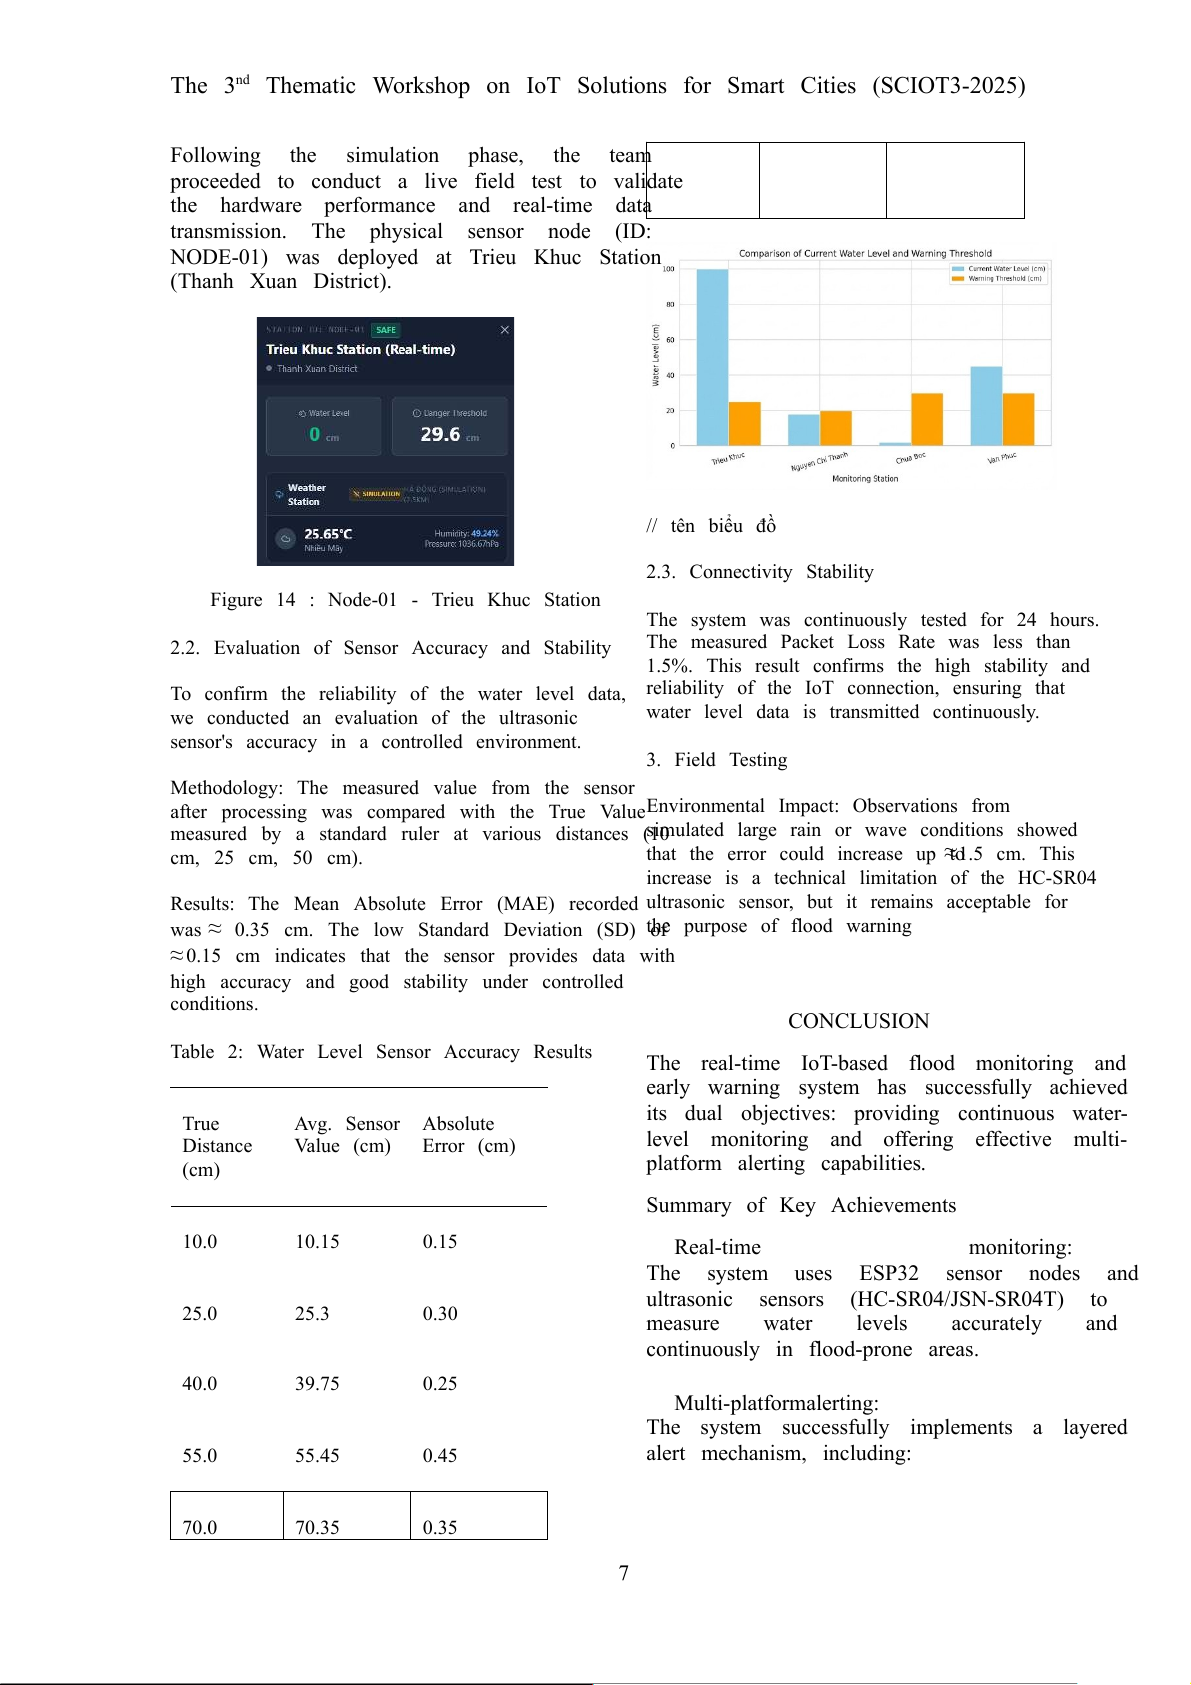
Figure 11: Safe Scenario (Node-03 - Chua Boc
Multi-Platform Visualization Advantage: Street)
Unlike systems focused solely on mobile
interfaces, such as the work by N. H. Giang
et al. [1] or Noar and Kamal [3] (which
utilizes Blynk for alerts), our system
implements a data relay mechanism via
Webhooks to the Web Map IOT platform
(Figure 10). This robust architecture allows
for community-level monitoring, visualizing
flood status (Green/Yellow/Red) based on Figure 12: Warning Scenario (Node-02 - Nguyen
GPS coordinates. This centralized map view Chi Thanh)
is critical for authorities and communities in
assessing the geographical scope of
flooding. Figure 10: Flood alert
notification for the Trieu Khuc Station
Intelligent Decision Support (Smart
Navigation): While other monitoring
systems primarily focus on data collection
or general risk assessment, our Web Map
IOT platform integrates a routing
algorithm. This feature automatically
suggests safe paths, allowing users to
Figure 13: Danger Scenario (Node-04 - Van Phuc
bypass routes marked as Warning or Street)
Danger based on real-time sensor data. This
These scenarios confirmed that the web
capability provides tangible, real-time value interface accurately renders marker colors and
for disaster mitigation, distinguishing it
status updates based on geolocation and sensor
from the work by T. G. Nguyen et al. [5] data thresholds.
which focuses on general risk mapping.
Live Field Testing Verification
Technical Flexibility: The use of ESP32
brings technical advantages in multitasking 6 The 3 nd
Thematic Workshop on IoT Solutions for Smart Cities (SCIOT3-2025)
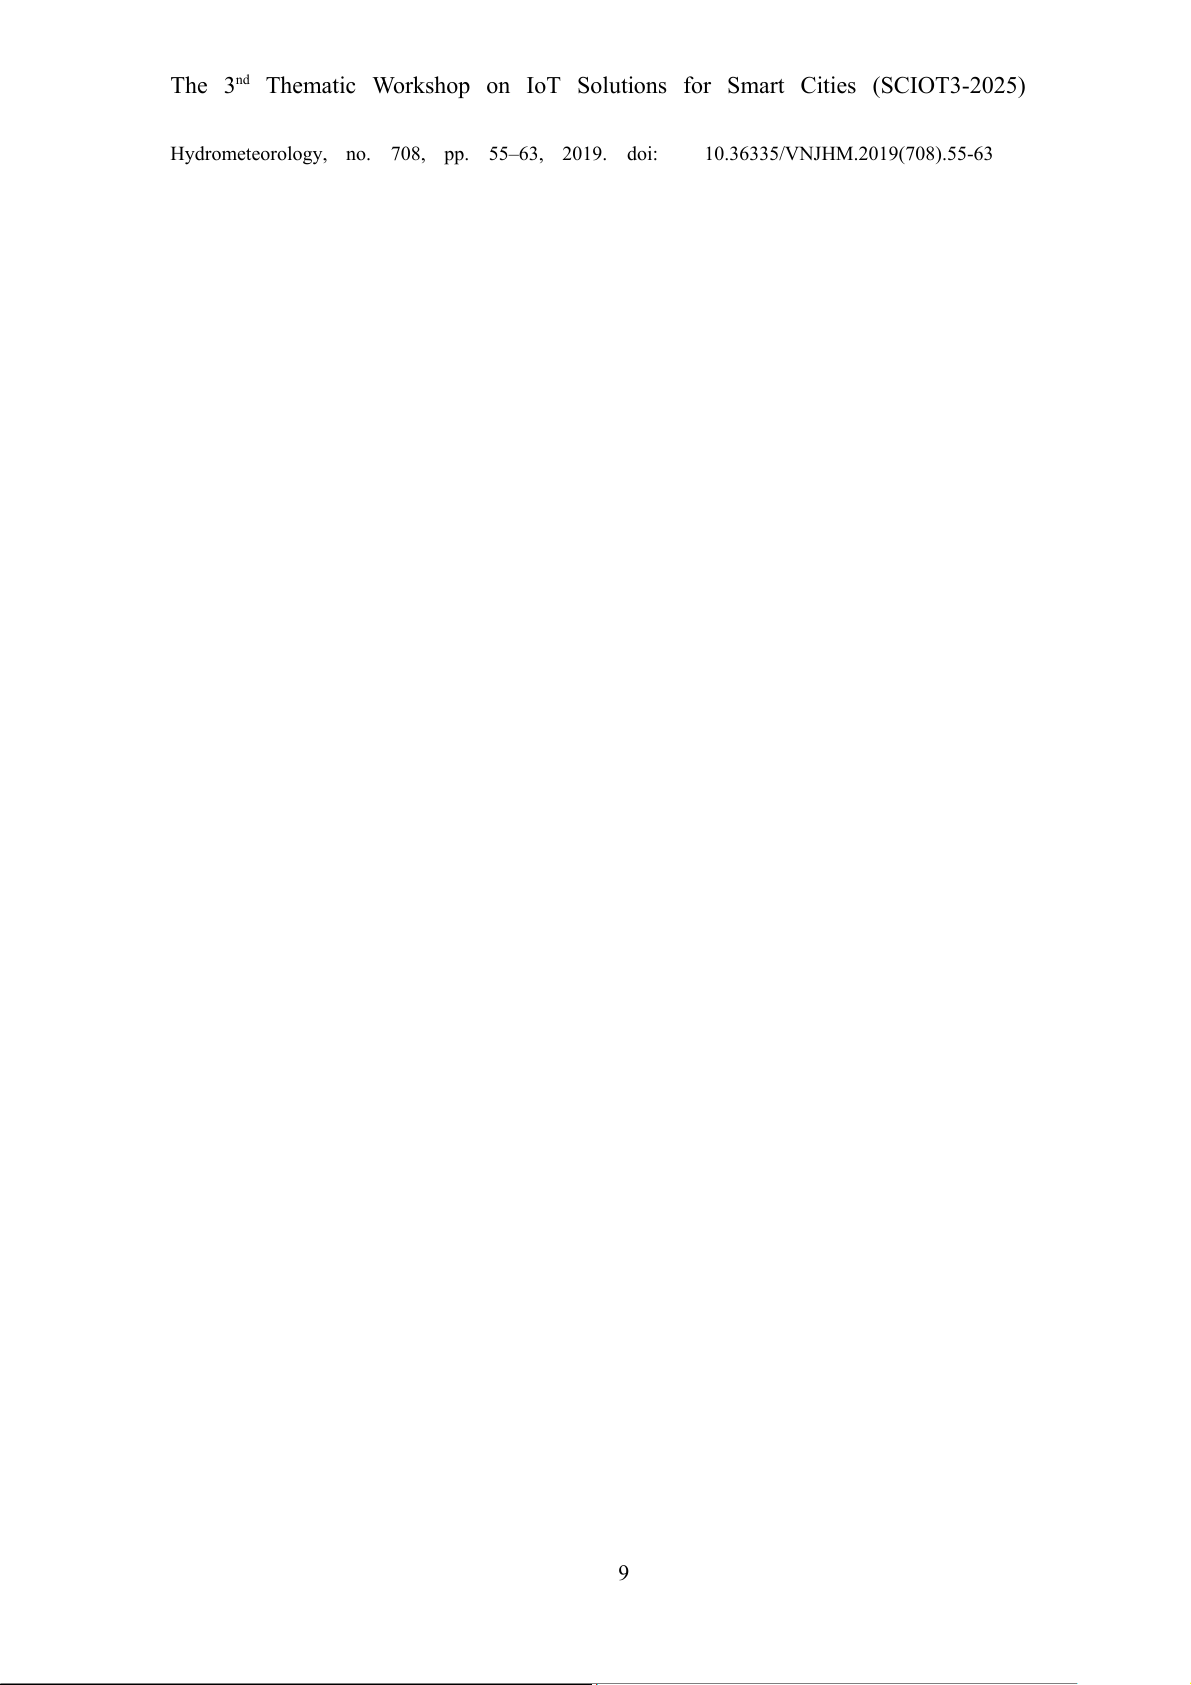
Following the simulation phase, the team
proceeded to conduct a live field test to validate
the hardware performance and real-time data
transmission. The physical sensor node (ID:
NODE-01) was deployed at Trieu Khuc Station (Thanh Xuan District).
// tên biểu đồ
2.3. Connectivity Stability
Figure 14 : Node-01 - Trieu Khuc Station
The system was continuously tested for 24 hours.
2.2. Evaluation of Sensor Accuracy and Stability
The measured Packet Loss Rate was less than
1.5%. This result confirms the high stability and
To confirm the reliability of the water level data, reliability of the IoT connection, ensuring that
we conducted an evaluation of the ultrasonic
water level data is transmitted continuously.
sensor's accuracy in a controlled environment. 3. Field Testing
Methodology: The measured value from the sensor
after processing was compared with the True Value
Environmental Impact: Observations from
measured by a standard ruler at various distances (10
simulated large rain or wave conditions showed cm, 25 cm, 50 cm).
that the error could increase up to ≈
1.5 cm. This
increase is a technical limitation of the HC-SR04
Results: The Mean Absolute Error (MAE) recorded ultrasonic sensor, but it remains acceptable for
was ≈ 0.35 cm. The low Standard Deviation (SD) of
the purpose of flood warning
≈ 0.15 cm indicates that the sensor provides data with
high accuracy and good stability under controlled conditions. CONCLUSION
Table 2: Water Level Sensor Accuracy Results
The real-time IoT-based flood monitoring and
early warning system has successfully achieved
its dual objectives: providing continuous water- True Avg. Sensor Absolute Distance Value (cm) Error (cm)
level monitoring and offering effective multi- (cm)
platform alerting capabilities.
Summary of Key Achievements 10.0 10.15 0.15 Real-time monitoring:
The system uses ESP32 sensor nodes and
ultrasonic sensors (HC-SR04/JSN-SR04T) to 25.0 25.3 0.30
measure water levels accurately and
continuously in flood-prone areas. 40.0 39.75 0.25 Multi-platformalerting:
The system successfully implements a layered 55.0 55.45 0.45 alert mechanism, including: 70.0 70.35 0.35 7 The 3 nd
Thematic Workshop on IoT Solutions for Smart Cities (SCIOT3-2025)
On-site alerts: Activating the buzzer and First, we would like to express our sincere and
LED indicator when the water level exceeds
profound gratitude to the Faculty of Information
the danger threshold (EthresholdWarning), Technology at the Posts and
offering immediate warnings for nearby Telecommunications Institute of Technology for residents.
providing an excellent learning and research
environment, as well as the resources necessary
Personal alerts (Blynk): Sending
for us to pursue and complete this project.
emergency push notifications and detailed
data (water level, threshold) to users’We especially thank our supervisor, Mr.Đặng
smartphones via the Blynk application.
Văn Hiếu, for his continuous guidance, valuable
advice, and technical support throughout the
Community monitoring (Web Map
system development process—from hardware IOT):
architecture (ESP32, ultrasonic sensors) to
integrating advanced software platforms (Blynk,
Establishing a data flow to visualize flood status Web Map IOT).
(Green/Yellow/Red) on a web-based map,
supporting authorities and communities with anWe are committed to further developing and
overall monitoring perspective.
improving this system to make more meaningful
contributions to disaster risk reduction efforts
Low cost and high flexibility: related to flooding.
By using low-cost components such as the
ESP32 and ultrasonic sensors, the system shows References
strong potential for wide deployment. The
ability to configure the warning threshold[1] N. H. Giang and N. C. Minh, “Water-level
remotely through Blynk (V1) enhances devicemonitoring model using IoT,” Undergraduate thesis
flexibility and user convenience.
report, Ba Ria – Vung Tau University, Vietnam, 2020.
Future Development Directions
[2] K. Kutubuddin, "IoT-based weather information
prototype using WeMos," Journal of Control and
Although the prototype has demonstrated strongInstrumentation Engineering, vol. 9, no. 1, 2023.
effectiveness, several potential improvements
can further enhance the system:
[3] N. A. Z. M. Noar and M. M. Kamal, "The
Development of Smart Flood Monitoring System Energy optimization:
Using Ultrasonic sensor with Blynk Applications," in
International Conference on Smart Instrumentation,
Utilize the ESP32’s deep-sleep mode toMeasurement and Application (ICSIMA), Putrajaya,
significantly reduce power consumption, Malaysia, 2017, pp. 1–6. doi:
enabling battery-powered or solar-powered 10.1109/ICSIMA.2017.831200
sensor stations in areas without stable electricity.
[4] P. Jesani, T. J. Raval, and K. A. Chaudhary, "A
Review On IoT Based Smart Home Using Blynk
Framework," Int. J. Adv. Res. Innov. Ideas Educ.,
Durability and reliability enhancement:
vol. 3, no. 5, pp. 624–632, 2017.
Improve the sensor station’s enclosure for better
waterproofing and weather resistance, especially [5] T. G. Nguyen, Q. N. Bui, Q. N. Pham, C. V.
for real-world flood environments.
Nguyen, P. T. Nguyen, và T. S. Vu, “Developing an
application within the coastal flood risk warning Acknowledgments
system: Pilot study in Quang Nam province,”
Journal of Mining and Earth Sciences, vol. 65, no. 5, pp. 41–49, 2024.
[6] L. A. Ngoc, N. V. Tin, T. N. Phat, và N. V. Hong,
“Đánh giá khả năng dự báo thời tiết của mô hình
WRF (Weather, Research and Forecasting) cho khu vực Nam Bộ,”
Vietnam Journal of 8 The 3 nd
Thematic Workshop on IoT Solutions for Smart Cities (SCIOT3-2025)
Hydrometeorology, no. 708, pp. 55–63, 2019. doi: 10.36335/VNJHM.2019(708).55-63 9
Tài liệu liên quan:
-
Tóm tắt lý thuyết môn IoT và ứng dụng | Học viện Công Nghệ Bưu Chính Viễn Thông
22 11 -
Accelerated Corner-Detector Algorithms: GPU Implementations and Results | Iot và ứng dụng | Học viện Công nghệ Bưu chính Viễn thông
46 23 -
Đề xuất Dự án IoT: Thiết bị phát hiện chạm cho xe máy | Iot và ứng dụng | Học viện Công nghệ Bưu chính Viễn thông
35 18 -
Phân Tích và Giải Pháp FastAPI | Iot và ứng dụng | Học viện Công nghệ Bưu chính Viễn thông
30 15 -
Tăng cường pháp chế xã hội chủ nghĩa trong quản lý nhà nước | Iot và ứng dụng | Học viện Công nghệ Bưu chính Viễn thông
25 13