Gas phase electrochemical analysis of amino acidsand their fragments - Tạp chí Hoá học truyền thông
Gas phase electrochemical analysis of amino acidsand their fragments - Tạp chí Hoá học truyền thông. Tài liệu được sưu tầm giúp bạn tham khảo, ôn tập và đạt kết quả cao. Mời bạn đọc đón xem.
Môn: Tài liệu Tổng hợp 3.6 K tài liệu
Trường: Tài liệu khác 3.9 K tài liệu
Tác giả:


Preview text:
ARTICLE DOI: 10.1038/s42004-018-0046-7 OPEN
Gas phase electrochemical analysis of amino acids and their fragments
Maria Calleja1, Atif Elahi1 & Daren J. Caruana1 0():,; 123456789
All chemical reactions involve electron rearrangement within or between molecules. The
changes are best studied by methods such as electrochemistry, but these have been
developed mainly for liquids and solids rather than gases. This exclusion limits our under-
standing of electron transfer processes that are central in plasma systems, which are of high
scientific, industrial, and environmental importance. Here we describe electrochemical
measurements in the gas phase of small organic molecules contained in flame plasma, by
probing the redox activity of the resulting chemical fragments using cyclic voltammetry.
Unique current-voltage spectra are recorded for eight amino acids and their fragments,
through specific electron transfer reactions at the solid/gas interface. We identify and assign
Faradaic peaks in the current-voltage spectra to the fragments using stable analogues of the
fragments and in situ mass spectroscopy. We show that this approach provides unambiguous
identification of organic based molecules, with a sensitivity and power of speciation to rival mass spectrometry.
1 Christopher Ingold Laboratory, Department of Chemistry, University College London, 20 Gordon Street, London WC1H 0AJ, UK. Correspondence and
requests for materials should be addressed to D.J.C. (email: D.J.Caruana@ucl.ac.uk)
COMMUNICATIONS CHEMISTRY | (2018) 1:48 | DOI: 10.1038/s42004-018-0046-7 | www.nature.com/commschem 1 ARTICLE
COMMUNICATIONS CHEMISTRY | DOI: 10.1038/s42004-018-0046-7
Electrontransferbetweenatomsormoleculesbringsabout electrochemicalreductionofthecarboxylatefragmentCOOH(or
the remarkable wealth of chemistry that underpins all
HCOO) as indicated by the fragment in the mass spectra (MS) for
fundamental processes, ranging from star formation to
formic and ethanoic at 45 m/z, Fig. 2b14–16. In support of the
sustaining life1,2. Electron exchange is also essential in industry
interpretation, amino acid alanine had the same peak. The
and research to achieve desired chemical transformations. Con-
COOH (or HCOO) fragment as opposed to CO2 is plausible
sequently, techniques that yield an improved understanding of
given the slightly reducing plasma with a high proportion of
redox reactions are highly important. Electrochemical analysis is
hydrogen in the premixed flame. Indeed, addition of CO2 to the
conventionally performed at the solid/liquid interface to investi-
flame up to a concentration of 10%/vol gave no measurable
gate electron attachment reactions at an electrode surface under
reduction signals, most likely due to the corresponding large
mutually matching energy levels3. However, the solid/liquid
positive electron attachment energies17.
interface imposes a double constraint: analytes outside the sol-
In further analysis, ethanoic acid but not methanoic acid
vent’s endogenous electrochemical activity range are excluded
displayed an additional peak at −9.0 ± 0.2 V (Fig. 2a). The signal
from detection and the liquid imposes a significant diffusive
is most likely due to the methyl-derived CH + 2 fragment, which is
barrier. The most radical way to overcome these limitations is to
seen in supporting MS of ethanoic acids as a peak at 14 m/z but
completely omit solvent4–8. An important requirement remains,
not for methanoic acid (Fig. 2b). MS sampling was conducted at
however, to achieve electrical conductivity to sustain charge
the same point where the electrode would be positioned for transfer6,9–11.
electrochemical measurements. In support, alanine also showed
Here we present a departure from conventional electro-
the peaks in both analysis methods. The high potential of −9.0 ±
chemistry and measure—in the gas phase—the direct electro-
0.2 V underscores the advantage of the new gas-phase voltam-
chemical reduction of organic compounds via voltammetry. The
metry because classical liquid-based electrochemistry with a
principle of the approach is schematically summarized in Fig. 1. A
limited to the range of −2 to +3 V vs. NHE due to the breakdown
target molecule is added to a hydrogen/oxygen flame that serves
of the solvent, electrode or electrolyte would have not enabled
as gas-phase electrolyte. The flame also fragments the molecule detection.
into stable units as well as several transient radical species12. The
After establishing that carboxylic acid groups provide unique
latter interact with the working electrode surface by accepting an
electrochemical signatures, hydroxyl groups were tested. The
electron, giving rise to a series of corresponding reduction peaks
voltammograms for methanol and ethanol gave rise to a broad
in the voltammogram. Interference from ions of the hydrogen/
peak at −4.1 ± 0.4 V (Fig. 2a), thereby confirming that the
oxygen flame is minimal because the target molecule is intro-
flame-induced fragmentation also yields a unique signature for
duced at approximately 1.2 ± 0.2 × 10¹⁸ particles m−3, which is
C–OH. The electrochemical signals stems, however, likely from
about a thousandfold higher than the background ionisation. The
the oxidized CHO group, which is also detected in MS as 29 m/z
recorded potentials of reduction are defined against a specially
peak (Fig. 2b). Oxidative fragmentation of alcohols during
developed high temperature reference electrode based on oxygen
combustion is well known18,19, (see Supplementary Note 1)
conducting zirconium oxide (YSZR)13. All potentials herein
and dominates the slightly reducing environment of the quoted versus this reference.
plasma. The other electrochemical signal at −8.0 ± 0.3 V of
only ethanol possibly reflects a dicarbon fragment not observed Results in the MS.
Gas-phase electrochemical analysis of simple acids and alco-
hols. To validate the new approach, we first added to the plasma
Analysis of amino acids. Next, serine was examined to test
two simple organic species bearing carboxylic acid groups, and
whether the hydroxyl and the carboxyl group that were previously
recorded the reduction signals. Our working hypothesis was that
separately detected can also be identified within one molecule.
the functional group would give rise to a radical species, which is
Indeed, voltammograms of serine displayed a common signature
measured as a characteristic signature in the voltammograms.
at −4.1 ± 0.4 V similar to the two simple reference alcohols
Indeed, both methanoic and ethanoic acids yielded a prominent
(Fig. 2a). In agreement, negative control alanine lacking the
peak at −5.80 ± 0.3 V (Fig. 2a), which most likely represents the
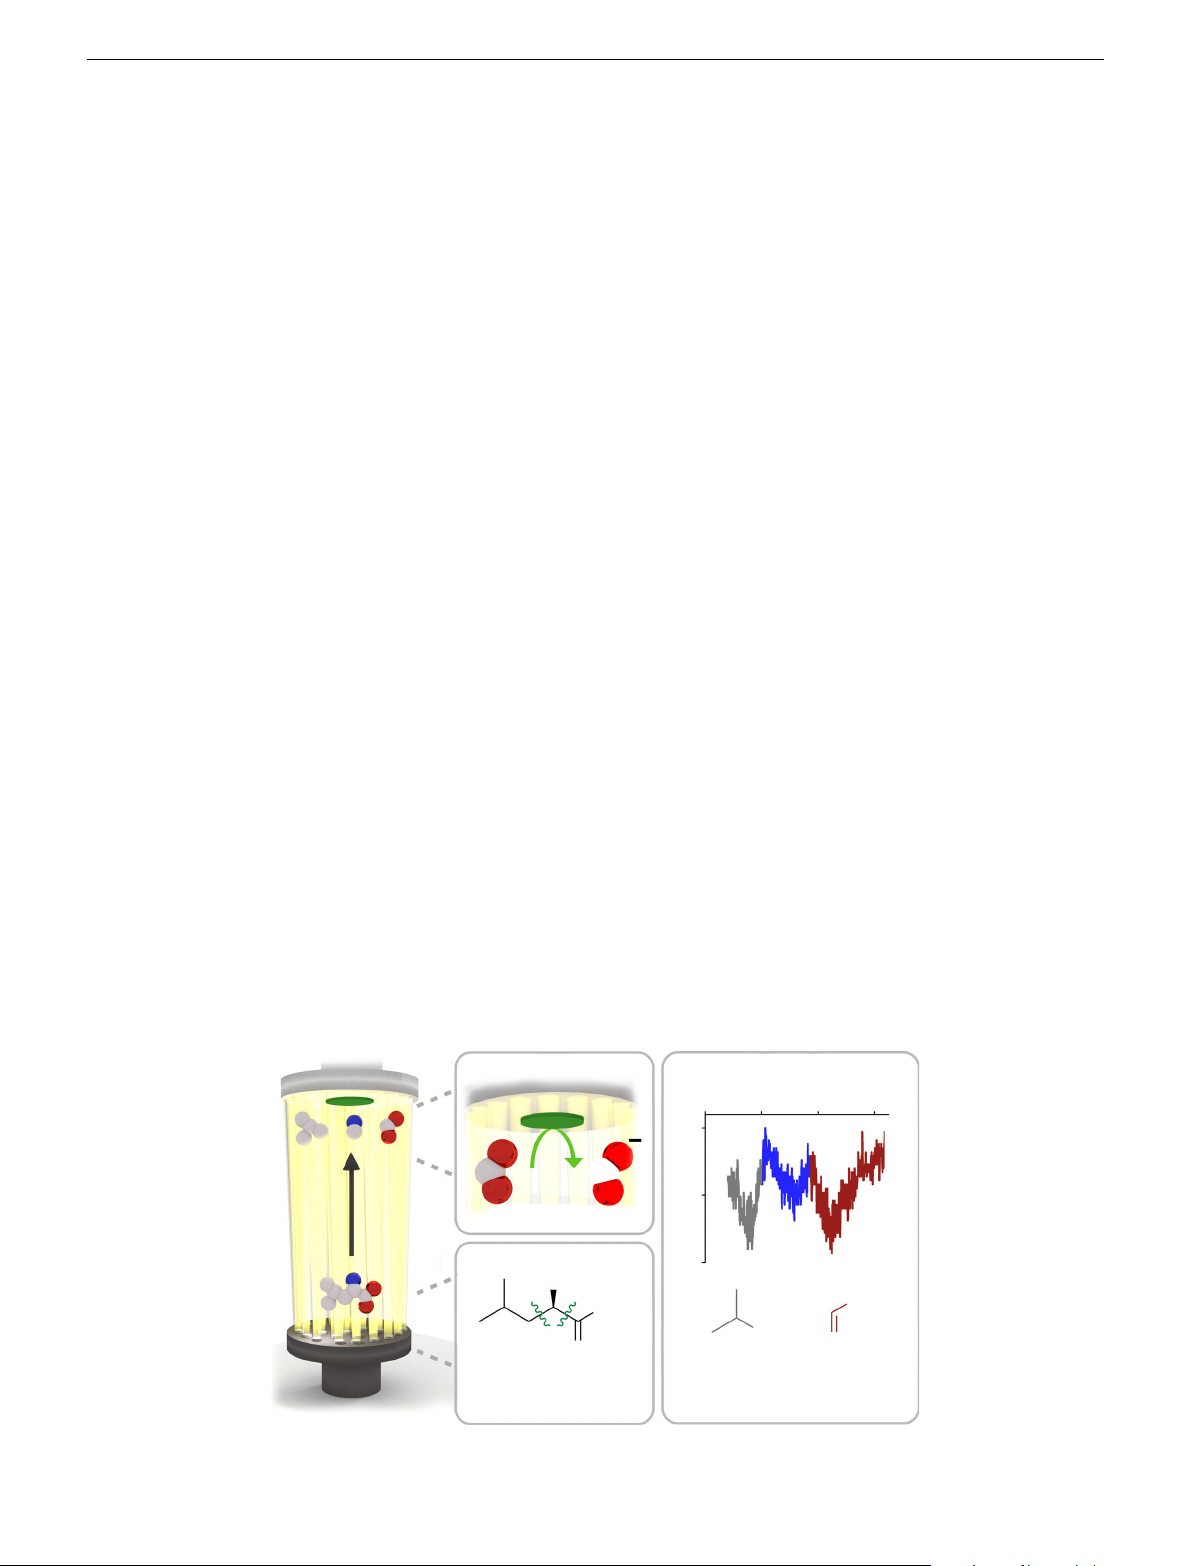
hydroxyl group did not have this signal. In further support, serine b c E (V) –10 –8 –6 –4 0 (nA) –5 I Reduction a –10 NH2 HCNH2 OH OH CH2 O O Flame-induced Voltammetry fragmentation
Fig. 1 Schematic of electrochemical analysis of organic species in flame plasma. Showing the flame introduction of organic species followed by
a fragmentation and b electrochemical analysis. The peaks in the voltammetry shown in c are assigned the fragments from incomplete combustion 2
COMMUNICATIONS CHEMISTRY | (2018) 1:48 | DOI: 10.1038/s42004-018-0046-7 | www.nature.com/commschem
COMMUNICATIONS CHEMISTRY | DOI: 10.1038/s42004-018-0046-7 ARTICLE a b 105 Methyl Acid H OH Alcohol H OH H C 3 OH 104 O O H C OH 103 3 H C OH 3 102 O CH OH 3 H C OH 105 3 OH OH H N H N 2 2 O 104 O O 103 10 nA 102 H C Amine Aromatic 105 3 OH Intensity (cps) OH 104 H C 3 NH 103 2 OH 102 OH H N OH 2 H N 2 105 H C OH 3 O O 104 OH H N 2 O 103 102 –8 –6 –4 –2 0 2 –8 –6 –4 –2 0 2 0 10 20 30 40 50 60 E vs. YSZR (V) E vs. YSZR (V) m /z (au)
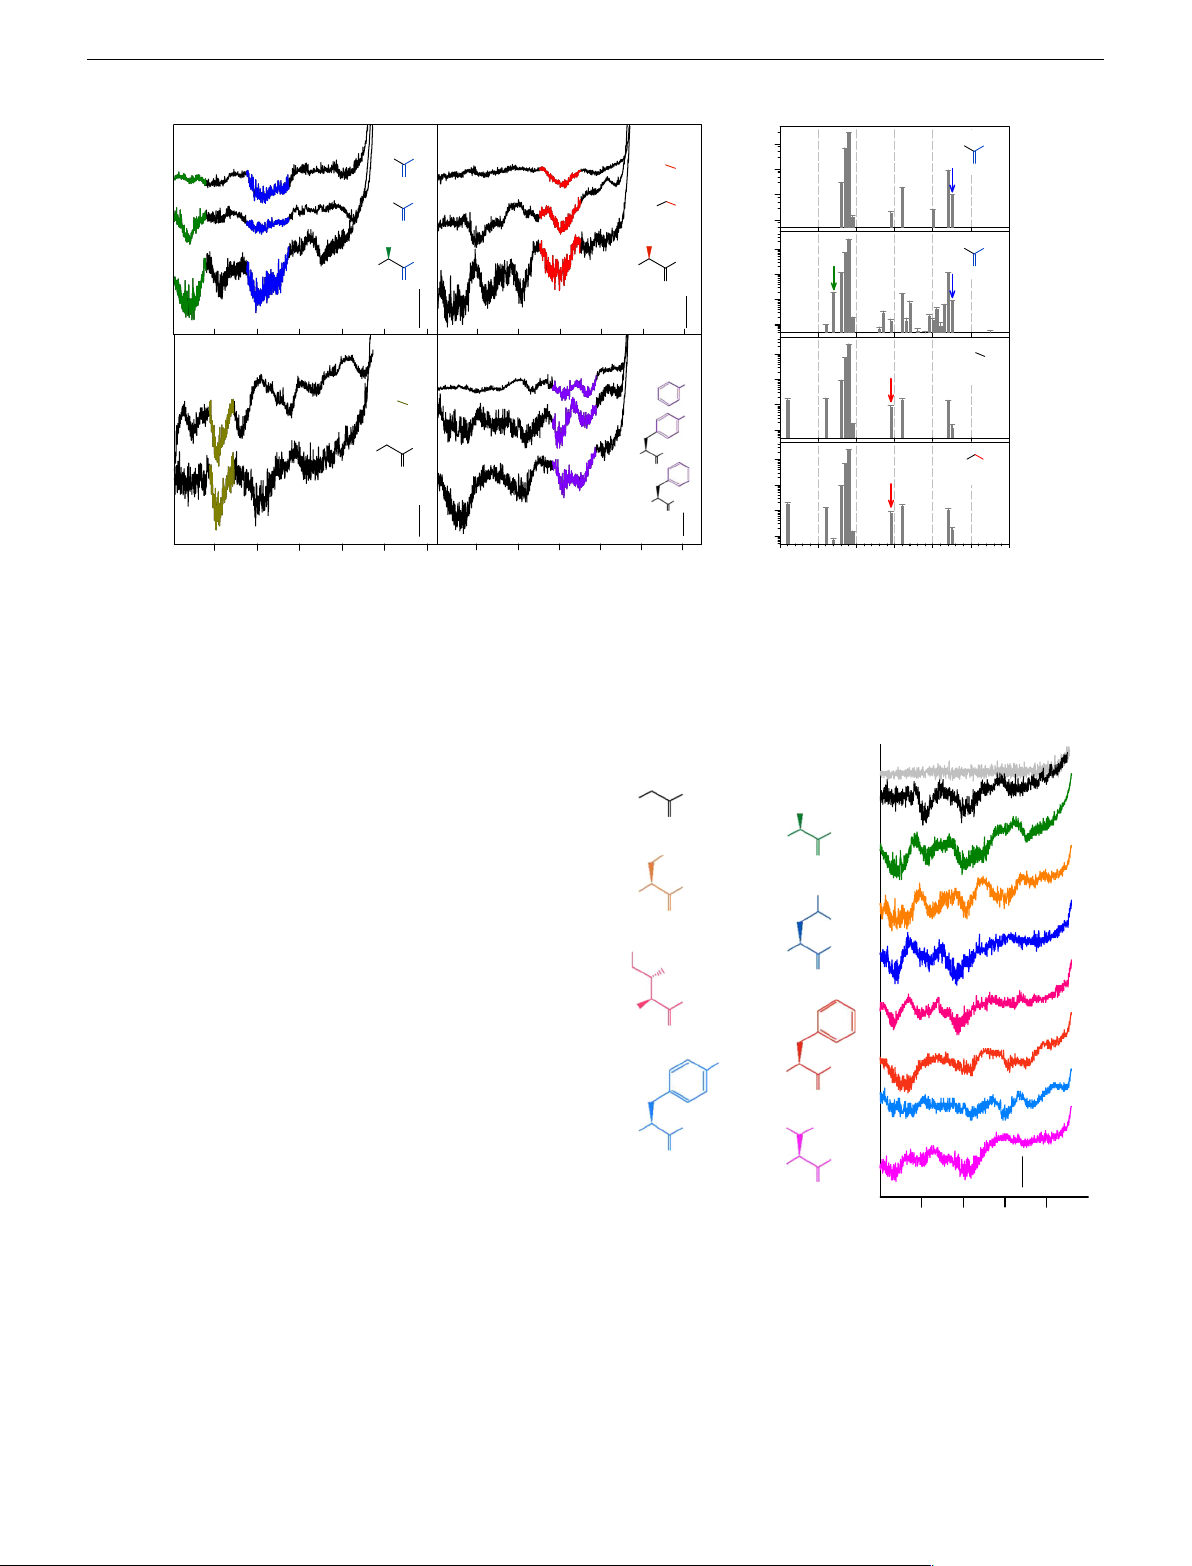
Fig. 2 Voltammetry and in situ MS in flame plasma containing simple organic compounds. a Voltammograms of flame containing of methanoic acid,
ethanoic acid and alanine, methanol, ethanol and serine, methylamine and glycine, phenol, tyrosine and phenylalanine, introduced into the flame by
atomised aqueous solutions of 5 mM, except for tyrosine which was 1 mM. b The mass spectra of the flame containing methanoic acid, ethanoic acid,
methanol and ethanol, all corrected for the background flame containing deionised water. Coloured arrows indicate masses of interest
featured the acid peak at −5.9 ± 0.15 V, almost identical to the a b
value of methanoic and ethanoic acid at −5.80 ± 0.3 V. Strikingly,
both serine and alanine displayed a peak at −7.9 ± 0.2 V, likely
reflecting the amine group. This interpretation is supported OH H N 2
by a −7.9 ± 0.2 V signal with the same asymmetry for the che- CH3 O
mically simpler methylamine but also glycine (Fig. 2a). Methy- OH H N 2
lamine shows other peaks as expected from its known more OH O complex combustion20,21. OH CH
Aromatic groups such as phenol and the amino acids tyrosine H N 3 2
and phenylalanine similarly gave unique voltammogram peaks. O CH3
For example, phenol clearly showed two peaks at −3.9 ± 0.3 V CH OH 3
and −2.5 ± 0.3 V at approximately the same potentials as for H N 2 CH3
phenylalanine and tyrosine (Fig. 2a). The signals can be O
associated with the aromatic side groups’ ring opening and OH Current (A) H N 2
subsequent breakdown. The peak-to-peak separation, ΔE for O
phenol and phenylalanine are 1.05 ± 0.10 V and 1.10 ± 0.08 V,
respectively, but 0.93 ± 0.08 V for tyrosine, are almost identical. OH OH H N 2
Any subtle differences between them may be due to the different O
substitution of the benzene ring.
To confirm that gas-phase electrochemistry can distinguish OH H C CH3 H N 3 2
between a range of closely related analyte molecules with O OH
different functional groups, a wide set of eight amino acids were H N 2 10 nA
examined. The features in the voltammograms for each amino O
acid, Fig. 3, echo the signatures of the key functional groups of –8 –6 –4 –2
the amino acids, as established from the simple previously E vs. YSZR (V)
analysed molecules (Fig. 2a). For example, the voltammograms
of glycine, alanine and serine with peaks at approx. −4.1, −5.8,
Fig. 3 Voltammetry of the eight amino acids added to the flame plasma.
−7.7 and −9.0 V were assigned to the previously established Showing the colour coded chemical structures a and the corresponding
chemical groups of alcohol, acid, amine and methyl groups,
voltammograms b in a flame containing glycine, alanine, serine, leucine,
respectively. The interpretation is supported by MS as the
isoleucine, phenylalanine, tyrosine, introduced into the flame by atomised
pattern of fragmentation reflected the electrochemical signals of
aqueous solutions of 5 mM, except for tyrosine which was 1 mM
the three amino acids (Fig. 3). Similarly, the aromatic
amino acids gave peaks expected for the loss of the acid group
(Fig. 3b) with −5.8, −7.5 and −9.0 V due to decarboxylation,
at −5.8 V ± 0.3 V, and the other features are likely from the
amine, and aliphatic fragments, respectively. The voltammo-
breakdown of the aromatic portion. As expected, isomeric
grams valine, leucine and isoleucine differ only in the number
amino acids leucine and isoleucine have the same pattern
or structure of carbons, and hence have related electrochemical
COMMUNICATIONS CHEMISTRY | (2018) 1:48 | DOI: 10.1038/s42004-018-0046-7 | www.nature.com/commschem 3 ARTICLE
COMMUNICATIONS CHEMISTRY | DOI: 10.1038/s42004-018-0046-7
signals as well as patterns of fragmentation as shown by MS in
explanation is clearly different to the traditional liquid-phase Supplementary Fig. 1.
electrochemistry where electron transfer takes place provided the
Fermi level is higher than ER (Fig. 5), as underpinned by the step-
Mechanistic study. The voltammetry data imply that electro-
wise current levels in traditional voltammograms25.
chemical reduction takes place at the electrode surface. To pro-
The uniqueness of gas-phase electrochemistry is underscored
vide direct evidence for this surface-located reaction, in situ
by demonstrating that the peaks in the voltammograms represent
Raman spectroscopy was applied, Fig. 4. Therefore, a graphitic
solely reduction but not oxidation of the molecular fragments.
electrode was exposed to a flame doped with water containing
Visually, the absence of oxidation can be inferred from the
5 mM leucine, and Raman spectra were recorded at 1 V steps
missing peaks in the positive direction on the voltammogram.
between 0 V and −10 V and reverse. The analysis focused on
The expectation, for a system such as this with efficient
Raman carbon G band at 1560 cm−1 because it corresponds to
hydrodynamic mass transport of oxidised species to the electrode the E
surface, would appear in the voltammogram as a plateau,
2g optical mode, where stretching of all bonds with sp2 atoms
is sensitive to redox processes22,23. As shown in Fig. 4b, the
represented as a blue solid line in Fig. 5. This unique property
band’s intensity varies with applied static potential, and strongly
can also be formalized by Eq. (1), which predicts the current
correlates with the electrochemical peaks in terms of voltage-
shown as the red solid line in Fig.5, similar to what we observe
dependence and signal strength. This means that at potentials
experimentally, via integrals for reduction and for oxidation
with strong electrochemical reduction, the G band has low Z 1 Z 1
intensity. The correlation is the same when the potential is I ¼ nFA m ν ð Þ ð Þ ν OCO R PO E NE E dE mRCR O PR E ð ÞNE E ð ÞdE
scanned in both directions; it does not occur in the absence of 1 1
lysine (Fig. 4a). The Raman data hence provides compelling ð1Þ
evidence of redox chemistry at the electrode surface in contact with a gaseous plasma.
where n, F and A, are the number of electrons involved in the
reduction, Faraday’s constant and electrode area, respectively. The
Theoretical framework. After demonstrating the experimental
mass transport coefficient to the electrode and the concentration
validity of our electrochemical approach, we next sought to place
for oxidized (subscript O) and reduced (subscript R) species are
it within a theoretical framework. Our considerations first focused
represented by m and C respectively, and v is the frequency for
on the fact that the gas-phase voltammograms feature peaks
transition for an electron transfer reaction. The integral quantifies
rather the step-wise current levels that are typical for liquid-phase
the overlap of electron states in the electrode N(E), and the
electrochemistry (Fig. 5). To account for the peaks, we use the
distribution of states in the gas, P(E) as a function of applied
electrode’s Fermi energy for electron transfer, EF, and the char-
potential (see Supplementary Note 2). Using Eq. (1), the
acteristic reduction potential, ER, for the oxidized organic frag-
calculated I/V traces for and oxidation and reduction process in
ments in the gas phase24. Electron transfer between electrode and
the gas phase, is shown by the dashed red line in Fig. 5. The
fragments is assumed to only take place when EF and ER ener-
absence of oxidation can be molecularly explained by considering
getically overlap (Fig. 5, EF-2 = ER). This can be achieved by
the relative magnitudes of mO and mR. As both account for
varying EF with the potential. By contrast, mismatching energy
molecular transport across the diffusion layer at the electrode
levels EF-1 < ER or EF-3 > ER do not lead to transfer (Fig. 5). This
surface, term mO—which is synonymous for supply of oxidised a 0 b –10 V –10 60 –9 V –8 V –20 –7 V –6 V 40 –30 e intensity) (au) –5 V Current (nA) –4 V (Relativ D –3 V –40 20 –2 V –1 V –50 25 au 0 –10 –8 –6 –4 –2 0 1520 1600 E vs. YSZR (V) Raman shift (cm–1)
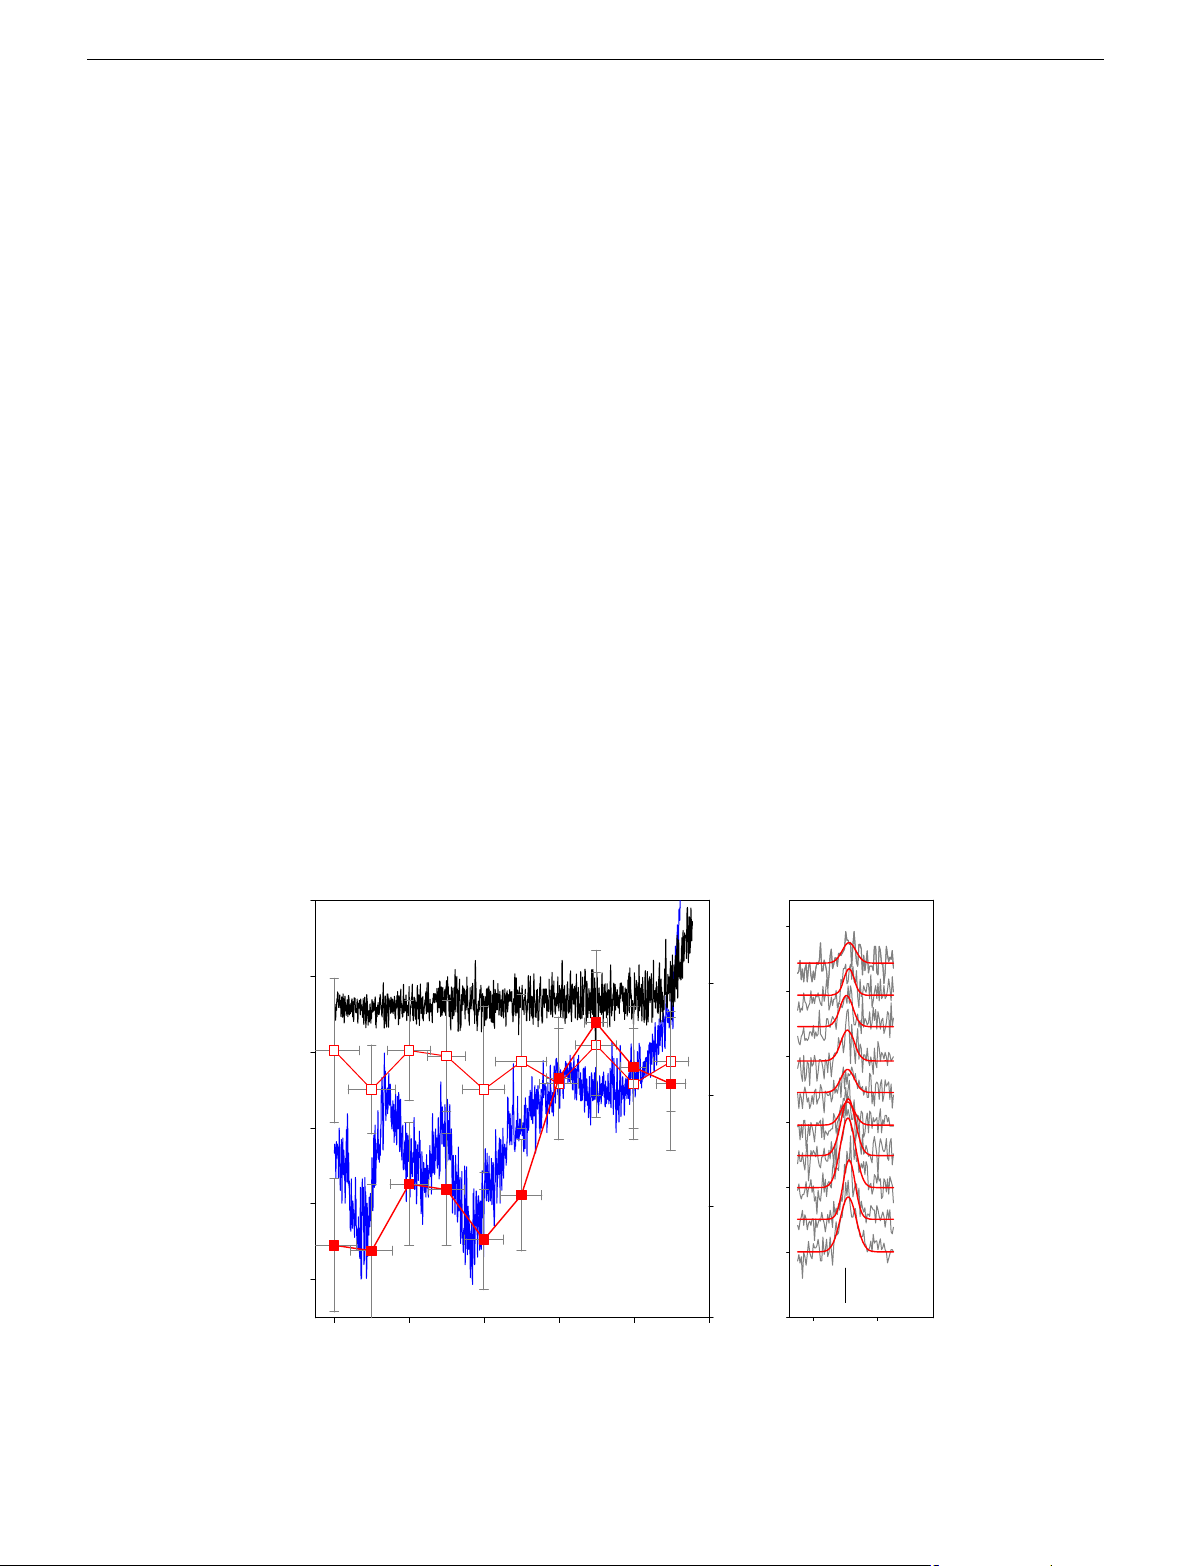
Fig. 4 In situ Raman spectroscopy of the electrode surface under electrochemical control. a Voltammogram and potentiodynamic Raman peak height at
1560 cm−1, of a graphite working electrode held at constant potential for 1 minute, in flame plasma doped with pure water (voltammogram, light blue line,
potentiodynamic, open squares) and 5 mM leucine (voltammogram, solid blue line; potentiodynamic, solid squares). Error bars indicate the standard error
of three measurements. b The Raman spectra between 1500 and 1630 cm−1 (grey lines) which are fitted to a Gaussian function (red lines), held at
potentials from −1 to −10 V vs. YSZR 4
COMMUNICATIONS CHEMISTRY | (2018) 1:48 | DOI: 10.1038/s42004-018-0046-7 | www.nature.com/commschem
COMMUNICATIONS CHEMISTRY | DOI: 10.1038/s42004-018-0046-7 ARTICLE
reactions at the solid/gas interface. Whilst we only show mea- EF-3
surements between 0 and −10 V here, we expect that there will A– e–
be a rich electrochemical information to be accessed beyond E E E R E F-2 R R A this range. E
The frugal design of the electrode assembly is both robust and EO O EO EF-1
simple, presents a very powerful tool for chemical analysis26. We
anticipate that this approach extends the utility Langmuir probes Solid plasma
by providing chemical information rather than simple con- + Electron energy (eV) –
ductivity measurements for the development of new plasma
diagnostic tools27,28, stimulating new analysers for atomic
absorption and inductively coupled plasma. Plasma Methods
Burner design. A specially designed Méker type burner (based on the design
described by Goodings and Hayhurst29) used for this study is described in Sup-
plementary Note 3, and Supplementary Figure 2 providing a two-compartment
laminar flow flame consisting of a premixed combination of hydrogen, oxygen and – Current (A) +
nitrogen. Aqueous solutions were prepared using deionised water (Millipore Milli-
Q® gradient, <0.05 S cm−2). The solution was introduced into the gas stream in the Liquid
form of an aerosol created from a modified ultrasonic atomiser (Index Ltd. UK).
The burner brass top-plate was cleaned by skimming the top surface, and the holes
where carefully cleaned using a 0.5 mm diameter drill before each set of experi-
ments. The burner was mounted vertically on an earthed aluminium table. The E E F-3 F-2 EF-1
dual flames were each served by an independent stream of gases at flow rates of 1.6, – Applied potential (V) +
0.4 and 1.0 L min−1 for nitrogen (99.99%), oxygen (99.9+%) and hydrogen
(99.995%) (gases supplied by BOC), respectively; with a total flow rate for the entire
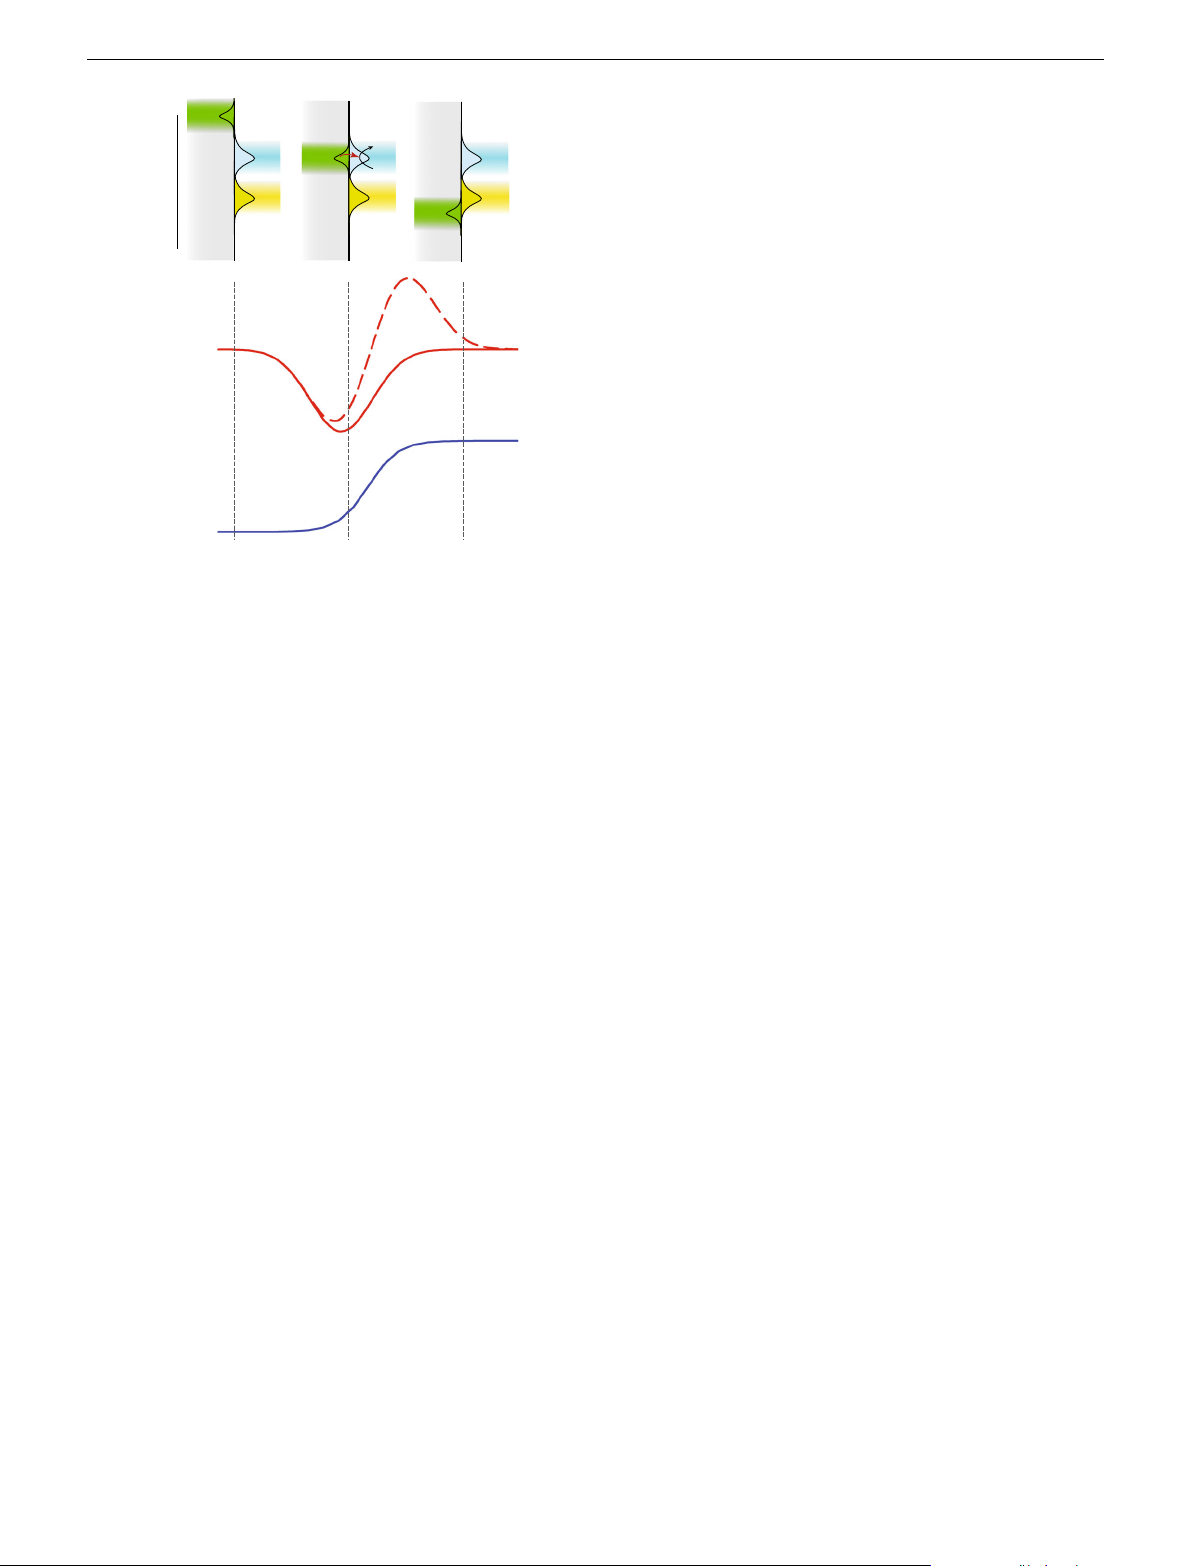
Fig. 5 Schematic diagram relating applied electrochemical potential with
flame of 6.0 L min−1, shown in Supplementary Note 3. Individually controlled
electron energy levels and the I/V traces expected. Energy level diagram
digital mass flow controllers (5850 S, Brooks, USA, with IGI control interface, UK) were used to regulate the
showing the relationship between electron energy levels expressed as
flow rates of hydrogen, oxygen and nitrogen. Before
reaching the burner, each of the two gas streams were thoroughly mixed in a
available states at three electrochemical potentials, EF-1, EF-2 and EF-3 and
chamber, which included a blow-out panel to protect against flash back; NB. Pre-
the gas phase states for the reduced, ER and oxidized, EO species. The red
mixed hydrogen and oxygen gases are explosive and adequate safety precautions
traces are the calculated I/V traces using Eq. (1), dashed line is when mR =
were taken. The gas lines for both streams were identical except for an aero-
solization chamber which was used to introduce the organic species to the flame, in
mO and CR = CO and solid line when mR = 0 and CR = 0. The blue I/V trace
the nitrogen line, before the mixing chamber feeding the right-hand section of the
is the equivalent process in liquid electrolytes
flame. In all experiments solution was added to the right-hand flame, the left-hand
flame was kept as a clean flame and was used as the reference electrode com-
partment. The calibration for the delivery of dopants to the right-hand flame is
species to facilitate reduction—will be high as the uncharged
outlined in Supplementary Note 4.
radical fragments can diffuse to the negatively charged electrode
surface. By contrast, mR—equivalent for oxidation—will be
Instrumentation. Electrode surface temperatures, whilst immersed in the flame,
vanishingly small because the reduced and hence negatively
were measured using a Thermal Imaging Pyrometer (800–3000 K) model
charged fragment will be electrostatically repelled by the
M9100 supplied by Mikron instrument Company Inc. (USA), calibrated to a
negatively polarized electrode surface. The extent of repulsion
traceable standard. Cyclic voltammograms were recorded using a potentiostat
(Autolab PGSTAT 100, Eco Chemie B.V. supplied by Windsor Scientific Ltd., UK)
can be calculated. A singly charged species will experience an
with 100 V compliance voltage, only the first sweep is presented of the cyclic
electric field of ca. 50,000 V m−1 when a potential difference of
voltammogram and are referred to as ‘voltammogram’.
5 V is applied across a plasma sheath. This will result in an
Mass spectrometry measurements were carried out using a HPR-60 MBMS
acceleration of 2 × 10¹¹ m s−2 away from the electrode surface.
(Hiden, UK) an instrument specifically for atmospheric plasma analysis. The
Raman measurements were performed using a inVia Raman microscope
(Renishaw, UK) with an optic fibre probe, which was focused on the working
electrode surface (see Supplementary Figure 3). Discussion
We present a method capable of differentiating a variety of dif-
ferent organic species, which is achieved by adopting a gaseous
Electrode assembly and procedure. Reference electrodes were constructed by
plasma medium interrogated by electrochemistry. Using a com-
thoroughly grinding yttria-stabilised zirconia with a small amount of ethanol to
bination of mass spectrometry and doping with a small selection
form a homogeneous paste, which was packed into the end of a recrystallized
alumina tube (od 2.75 mm, id 1.6 mm, Dynamic Ceramic, UK) to a depth of 3.0
of carefully chosen species, we have successfully assigned the
mm, making contact with a tungsten wire (1 mm diameter, Goodfellow, UK) for
electrochemical signals to the fragmentation products of eight
electrical connection. The counter electrode and working electrode assembly was
different amino acids. We deduced that certain organic groups
positioned at 10.0 mm above the burner top. The cylindrical stainless-steel
give rise to radical species in the flame, which can be reduced
enclosure had a 25.0 mm diameter platinum disc, 2.0 mm thickness held in place at
the base of the enclosure. The platinum disc had a 3.0 mm diameter hole at its
electrochemically resolved in applied potential. We present new
centre which accommodated the working electrode (see Supplementary Note 3).
insights into electrochemical electron attachment in a plasma and
The entire assembly was positioned over the flame with the hole accommodating
present true gas phase electrochemistry of organic species.
the working electrode precisely in the path of the right-hand section of the flame. A
This radical departure from conventional liquid phase elec-
gold or pyrolytic graphite rod (Goodfellow Ltd., UK) 2.4 mm diameter served as a
trochemistry enables electron attachment events to be measured
working electrode, which was clamped in a ceramic holder (Macor®) and precisely
positioned in a 3.0 mm hole in a platinum foil counter electrode. Once in the flame,
in the gas phase, which are normally restricted to techniques such
the working electrode surface temperature was 1236 ± 15 K. The voltammograms
as electron beam or photoelectron spectroscopy17. Perhaps
where recorded after the electrodes were positioned in the flame for 30 seconds,
expectedly, there are significant departures from the analogous
scanning between 0 to −10 V at a rate of 1 V s−1, which is the optimal scan rate for
electron transfer processes in condensed phases. These departures
this media as reported in Ref.11. Three consecutive scans were recorded; the second
scan is presented. A fresh reference electrode was used for every series of vol-
present fruitful theoretical avenues for research to develop a
tammogram. Error on the potentials quoted are calculated based on the movement
quantum mechanical level understanding of electron transfer
of the stability of the peak upon repetitive cycling, minimum number of cycles is 6.
COMMUNICATIONS CHEMISTRY | (2018) 1:48 | DOI: 10.1038/s42004-018-0046-7 | www.nature.com/commschem 5 ARTICLE
COMMUNICATIONS CHEMISTRY | DOI: 10.1038/s42004-018-0046-7
Data availability. All data generated during the current study are available from
23. Gao, Y. X. et al. Mechanistic study on the interfacial variation of carbon
the corresponding author on reasonable request.
electrode under electrochemical oxidation. J. Electroanal. Chem. 783, 90–99 (2016).
24. Gerischer, H. Advances in Electrochemistry and Electrochemical
Received: 19 April 2018 Accepted: 17 July 2018
Engineering. Vol. 1 (ed. Delahay, D.) 139–232 (Interscience, New York, 1961).
25. Girault, H. H. Analytical and Physical Electrochemistry 1st edn, p.375 (EPFL Press, 2004).
26. Richmonds, C. et al. Electron-transfer reactions at the plasma-liquid interface.
J. Am. Chem. Soc. 133, 17582–17585 (2011).
27. King, I. R. & Calcote, H. F. Effect of probe size on ion concentration References
measurements in flames. J. Chem. Phys. 23, 2203–2204 (1955). 1.
Rumbach, P., Bartels, D. M., Sankaran, R. M. & Go, D. B. The solvation of
28. Maclatchy, C. S. & Smith, H. C. L. The electron current to a langmuir probe in
electrons by an atmospheric-pressure plasma. Nat. Commun. 6, 7248 (2015).
a flowing high-pressure plasma. IEEE Trans. Plasma Sci. 19, 1254–1258 2.
Caruana, D. J. & Holt, K. B. Astroelectrochemistry: the role of redox reactions (1991).
in cosmic dust chemistry. Phys. Chem. Chem. Phys. 12, 3072–3079 (2010).
29. Axford, S. D. T., Goodings, J. M. & Hayhurst, A. N. Mass-spectrometric 3.
Bard, A. J. & Faulkner, L. R. Electrochemical Methods: Fundamentals and
sampling of ions from flames at atmospheric pressure: the effects of applied
Applications 2nd edn, p.123 (Wiley, 2000).
electric fields and the variation of electric potential in a flame. Combust. Flame 4.
Ghoroghchian, J. et al. Electrochemistry in the gas-phase—use of 114, 294–302 (1998).
ultramicroelectrodes for the analysis of electroactive species in gas-mixtures.
Anal. Chem. 58, 2278–2282 (1986). 5.
Vijh, A. K. Electrode-potentials and interface plasmons in the metal gaseous Acknowledgements
electrolyte (i.e., plasma) interphasic region. Mater. Chem. Phys. 14, 47–56
The authors acknowledge the EPRSC (EP/H049398/1), for financial support. A.E. and (1986).
M.C. wish to thank EPSRC for studentships. Our thanks go to Prof Stefan Howorka 6.
Vennekamp, M. & Janek, J. Plasma electrochemistry in radio frequency
(UCL) for assistance with the manuscript preparation and Dr Jonathan Burns for help
discharges - oxidation of silver in a chlorine plasma. J. Electrochem. Soc. 150,
with preparation of Fig. 1. The EPSRC core capability for Chemistry research (EP/ C723–C729 (2003).
K03930X/1) grant for purchase of the Hiden HPR-60 MBMS Mass spectrometer. 7.
Ogumi, Z., Uchimoto, Y. & Takehara, Z. Electrochemistry using plasma. Adv.
J. Stevenson for his technical expertise for building the electrode assembly and Mater. 7, 323–325 (1995). assembly for MS sampling. 8.
Hickling, A. & Ingram, M. D. Contact contact glow-discharge electrolysis.
Transactions of the Faraday. Society 60, 783–793 (1964). Author contributions 9.
Caruana, D. J. & McCormack, S. P. Electrochemistry in flames: a preliminary
The idea for this experiment was conceived by D.J.C. Method development was
communication. Electrochem. Commun. 2, 816–821 (2000).
undertaken by D.J.C., A.E. and M.C., and the electrochemical data were collected by A.E.
10. Elahi, A., Fowowe, T. & Caruana, D. J. Dynamic electrochemistry in flame
M.C. collected the Raman and MS data. D.J.C. wrote the paper and M.C. and A.E.
plasma electrolyte. Angew. Chem. Int Ed. Engl. 51, 6350–6355 (2012). contributed to the manuscript.
11. Elahi, A. & Caruana, D. J. Plasma electrochemistry: voltammetry in a flame
plasma electrolyte. Phys. Chem. Chem. Phys. 15, 1108–1114 (2013).
12. Frenklach, M., Wang, H. & Rabinowitz, M. J. Optimisation and analysis of Additional information
large chemical kinetic mechanisms using the solution mapping method -
Supplementary information accompanies this paper at https://doi.org/10.1038/s42004-
Combustion of Methane. Progress. Energy Combust. Sci. 18, 47–73 (1992). 018-0046-7.
13. Fowowe, T., Hadzifejzovic, E., Hu, J., Foord, J. S. & Caruana, D. J. Plasma
electrochemistry: development of a reference electrode material for high
Competing interests: The authors declare no competing interests.
temperature plasma. Adv. Mater. 24, 6305–6309 (2012).
14. Christensen, M. & Konnov, A. A. Laminar burning velocity of acetic acid plus
Reprints and permission information is available online at http://npg.nature.com/
air flames. Combust. Flame 170, 12–29 (2016). reprintsandpermissions/
15. Gallois, N., Templier, J. & Derenne, S. Pyrolysis-gas chromatography-mass
spectrometry of the 20 protein amino acids in the presence of TMAH. J. Anal.
Publisher's note: Springer Nature remains neutral with regard to jurisdictional claims in
Appl. Pyrolysis 80, 216–230 (2007).
published maps and institutional affiliations.
16. Chiavari, G. & Galletti, G. C. Pyrolysis-gas chromatography/mass
spectrometry of amino acids. J. Anal. Appl. Pyrolysis 24, 123–137 (1992).
17. Rienstra-Kiracofe, J. C., Tschumper, G. S., Schaefer, H. F., Nandi, S. & Ellison, G. B.
Atomic and molecular electron affinities: photoelectron experiments and theoretical
Open Access This article is licensed under a Creative Commons
computations. Chem. Rev. 102, 231–282 (2002).
Attribution 4.0 International License, which permits use, sharing,
18. Sarathy, S. M., Osswald, P., Hansen, N. & Kohse-Hoinghaus, K. Alcohol
adaptation, distribution and reproduction in any medium or format, as long as you give
combustion chemistry. Progress. Energy Combust. Sci. 44, 40–102 (2014).
appropriate credit to the original author(s) and the source, provide a link to the Creative
19. Aranda, V. et al. Experimental and kinetic modeling study of methanol
Commons license, and indicate if changes were made. The images or other third party
ignition and oxidation at high pressure. Int. J. Chem. Kinet. 45, 283–294
material in this article are included in the article’s Creative Commons license, unless (2013).
indicated otherwise in a credit line to the material. If material is not included in the
20. Skreiberg, O., Kilpinen, P. & Glarborg, P. Ammonia chemistry below 1400 K
article’s Creative Commons license and your intended use is not permitted by statutory
under fuel-rich conditions in a flow reactor. Combust. Flame 136, 501–518
regulation or exceeds the permitted use, you will need to obtain permission directly from (2004).
the copyright holder. To view a copy of this license, visit http://creativecommons.org/
21. Mendiara, T. & Glarborg, P. Ammonia chemistry in oxy-fuel combustion of licenses/by/4.0/.
methane. Combust. Flame 156, 1937–1949 (2009).
22. Ferrari, A. C. Raman spectroscopy of graphene and graphite: disorder,
electron-phonon coupling, doping and nonadiabatic effects. Solid State © The Author(s) 2018 Commun. 143, 47–57 (2007). 6
COMMUNICATIONS CHEMISTRY | (2018) 1:48 | DOI: 10.1038/s42004-018-0046-7 | www.nature.com/commschem
Document Outline
- Gas phase electrochemical analysis of amino acids and their fragments
- Results
- Gas-phase electrochemical analysis of simple acids and alcohols
- Analysis of amino acids
- Mechanistic study
- Theoretical framework
- Discussion
- Methods
- Burner design
- Instrumentation
- Electrode assembly and procedure
- Data availability
- References
- Acknowledgements
- Author contributions
- Competing interests
- ACKNOWLEDGEMENTS
- Results
Tài liệu liên quan:
-

Ung dung game hoa trong cac chien dich MKT
18 9 -

Bao cao Chi so TMDT Viet Nam 2025
15 8 -
Thông tư quy định về việc phân quyền, phân cấp và phân định thẩm quyền quản lý nhà nước về giáo dục cho chính quyền địa phương
24 12 -
Nghị quyết về phát huy các giá trị di sản văn hóa gắn với phát triên du lịch bền vững tỉnh Khánh Hòa đến năm 2025, định hướng đến năm 2030
14 7 -
Quyết định phê duyệt Chiến lược phát triển du lịch Việt Nam đến năm 2030
13 7