Giáo trình Giáo dục học đại cương - ĐH Sư phạm TPHCM - Bản đầy đủ 202
Hayaâ
Môn: Giáo dục học đại cương 67 tài liệu
Trường: Đại học Sư phạm Thành phố Hồ Chí Minh 691 tài liệu
Tác giả:


Preview text:
PROCEEDINGS OF THE
INTERNATIONAL STUDENT SCIENTIFIC CONFERENCE POSTER – 29/2025 ISBN 978-80-01-07422-0 Editor: Libor Husník
Proceedings of the International Student Scientific Conference Poster – 29/2025
Published by the Czech Technical University in Prague in 2025
Faculty of Electrical Engineering First electronic edition Number of pages: 174
© Faculty of Electrical Engineering, CTU in Prague, 2025 PROCEEDINGS OF THE
INTERNATIONAL STUDENT SCIENTIFIC CONFERENCE POSTER – 29/2025
The objective of the international scientific student conference
POSTER 2025 is to provide an international forum for presentation of
undergraduate and postgraduate student research work in fields
related to electrical engineering.
Al contributions were presented as posters in seven paral el sections
at the Faculty of Electrical Engineering, Czech Technical University in Prague on May 22, 2025.
The international student conference POSTER 2025, organized by the Faculty of
Electrical Engineering, Czech Technical University in Prague, started as an internal
meeting of doctoral students in 1995. In 1997, the first International Student
Conference POSTER was held. On May 22, 2025 we organized the Conference for the
29th time. As in previous years the conference was held in cooperation with the Faculty
of Biomedical Engineering and Faculty of Information Technology.
One of the main goals of the POSTER conference is to promote discussions and
interactions among postgraduate and undergraduate students from various countries,
universities and fields of study related to electrical engineering. Another important goal
is to support independent creative work of students and stimulate practical application
of acquired theoretical knowledge since we consider the students' research activity an
inevitable part of the whole educational process at al universities.
This year we introduced the fol owing change to the conference. Students can submit
either a two-page abstract or a four-page full paper for publication. They can also opt
out of publication of their contributions.
The program committee of Poster 2025 conference selected a total of 60 papers for
presentation at the conference. Twenty four authors opted out of the publication of
their papers in proceedings. The contributions are divided into seven sections: • Biomedical Engineering • Communications
• Electronics and Instrumentation • History of Science
• Informatics and Cybernetics • Natural Sciences • Power Engineering
A total of 34 contributions come from Czech Technical University in Prague, 1 from
another Czech university and 25 contributions are from abroad. Criteria of acceptance
were based on the originality of scientific contribution and good English. Each paper
was reviewed by at least two members of the respective section of the Programme Committee.
We would like to thank al students who produced outstanding research results and
contributed to this proceeding.
Last but not least, we would like to express our gratitude to all colleagues from the
Office for Science, Research and International Relations and from the Computing and
Information Centre who helped us a lot in preparation of the proceedings and
organization of the conference. Prague May 2, 2025 Libor Husník
on behalf of the Organizing Committee of POSTER 2025 LIST OF PAPERS Section/ Paper ID Paper Title First Author Other Authors Publication BI 1
A Single Helical Interstitial Applicator for Michaela Nečasová Filip Zajan, Kateřina Ful Paper Microwave Hyperthermia Pavelková BI 2
Effect of changes in GABAergic inhibition on the Klára Kozelková No development of tinnitus publication BI 3
An ANOVA-based Sequential Forward Channel Forouzan Salehi Ful Paper
Selection Framework for BCI Application based Fergeni on EEG Signals BI 4
An active model of the respiratory system as a Adéla Rojíčková Ext abstract
phantom for the forced oscil ation technique BI 5
Analysis of Facial Temperatures and Galvanic Skin Tobias Reinhardt No
Response for Correlations and Possible publication Estimation BI 6
Comparison of blood gas analyzers Martin Šantrůček No publication BI 7
Comparison of perfusion index obtained by Matěj Losos No smartwatch and pulse oximeter publication BI 8
Developing a digital twin of a human knee Andreas Wurzinger No
prosthesis for acoustic analysis publication BI 9
Effect of the light conditions on the accuracy of Radek Nejman No SpO2 measurements publication BI
10 Generalization Ability of a GREIT-Like Matrix Theresa Nolte Ful Paper Based on Real-World EIT Data BI
11 Hyperspectral Photoplethysmography Imaging Maurice Rohr Ful Paper BI
12 Measuring an ECG via an ECG-Stick Immo Baarling Onno Linschmann No publication BI
13 Model of Applicator for Regional Hyperthermia Filip Zajan Michaela Nečasová, Ful Paper
based on eight “Bow-tie“ Antennas Kateřina Pavelková BI
14 Classification of healthy and impaired plantar Ján Šeleng No foot microcirculation using publication
photoplethysmography imaging and deep learning model BI
15 State of the Art in Pulsed-Dose Oxygen Delivery Nika Khosravi Ful Paper for Mechanical Ventilation BI
16 Design and experimental verification of novel Kateřina Pavelková Michaela Nečasová, Ful Paper
types of microwave applicators for use in Filip Zajan cardiology BI
17 Variability of perfusion index in selected pulse Jonas Horak No oximeter models publication C 1
Influence of Environmental Conditions on Michal Špaček No
Metrological Optical Signals in Standard and publication Hol ow-Core Optical Fibers C 2
Subjective test methodology design for spatial Jakub Turinský Ext abstract audio transmission C 3
Pulse to Tone Dial ing Converter Urban Jacobs Nathan Kuehr, Lukas Ful Paper Mardak Section/ Paper ID Paper Title First Author Other Authors Publication C 4
Design and Implementation of a Broadband Samie Soufeh Ful Paper Wilkinson Power Divide C 5
Fabrication of Optical Microstructures Using Jana Zimanová No
Direct Laser Writing and Deep Reactive Ion publication Etching Technologies EI 1
Transistors Based on the Nitride Semiconductor Rudolf Shymon Alexandr Pošta Ful Paper Heterostructures EI 2
Auralization and Validation of Vehicle Pass-By Chalotorn No
Noise for Urban Noise Management Moehlmann publication EI 3
Designing a Miniaturized Fluxgate using Flip-chip Jiří Meier Ext abstract Technology EI 4
Temperature Compensated Power Detectors for Lukas Pohl Ful Paper
L- and S-Band Radiometer Applications EI 5
Digital y programmable symmetrical power pulse Stanislav Starman Ful Paper
generator using SiC power switches EI 6
Effects of hybrid turbulence model ing on Thomas Brunner Ful Paper
aeroacoustic noise generation in automotive door gaps EI 7
Soa Protection Circuit for eFuses Lukáš Buryanec Ful Paper EI 8
Real-Time Data Capture with TI mmWave Radars Jakub Velich Ful Paper EI 9
Characterisation of a Low-Cost Acoustic Chamber Patricia Zofia Florian Kraxberger Ful Paper Jesionkowska HST 1
Transnational Flows of Innovation: The Elisa Angeles Ful Paper
Importation of Hydro-Electric Machinery from
Paris to Mexico by Barcelonette Entrepreneurs (1890-1910) HST 2
Energy and War: The Triano Hydroelectric Power Jacopo Bassetta Ext abstract
Plant as a Strategic Infrastructure in the German
Rear Lines in Italy (1939-1944) HST 3
Industrial Health Heritage: The Mountain Francisco Griotto Ful Paper
Sanatorium Vil age in Sondalo, Italy HST 4
The Integration of Computer Science into Amani Mansouri Ful Paper
Educational Systems in France and
Czechoslovakia: A Historical Comparison (1955- 1965) HST 5
MISSION: STOP THE SPARKS! A device for steam Jorge Alonso Ful Paper locomotives Rodriguez Ortiz HST 6
From Lwow and Warsaw to Prague. A talk about Jiří Sedláček Ful Paper
professors Adamiecki, Hasa, and Šlechta HST 7
A Historical Overview of Electrocardiography: Jannik Pruessmann Immo Baaarlink No
From Early Discoveries to Modern Advances publication HST 8
The ESČ Testing Laboratory as the Basis of Martin Hrtus Ful Paper
Electrotechnical Examination in Czechoslovakia HST 9
Acquisition of key precision machining David Hamr Ful Paper
technology as a prerequisite for adopting mass
production of mechanical wristwatches in Czechoslovakia in the 1950s. Section/ Paper ID Paper Title First Author Other Authors Publication
HST 10 The Landesberger Clockmaker Family and the David Knespl Ful Paper
Reconstruction of the Prague Astronomical Clock, 1787–1791
HST 11 Military Aviation Study Institute in the years Daniel Kyselka Ful Paper 1922-1932 IC 1
Virtual Reconstruction and 3D Modeling as Tool Barbora Pálková No for Heritage Preservation publication IC 2
Adaptive RANSAC for Robust Camera Pose Vojtech Pánek No Estimation publication IC 3
Simulation of position improvement in multi- Michal Koldinský Ext abstract
agent system with relative measurements IC 4
Leveraging Invertible Neural Networks for Jonathan Wohlmuth No
Enhanced Uncertainty Quantification in Bayesian publication Neural Networks IC 5
Densoising Time Series Transformer Lars Reckmann No publication IC 6
Data-Driven Parameterization for Pseudo-2- Thomas Ngo No
Dimensional Model using Artificial Intel igence publication IC 7
Neural Network-Based Estimation of Acoustic Jakub Urbánek Ext abstract Impulse Response IC 8
Dimensions of Explainability in AI Alignment Martin Krutský Jiří Němeček, Jakub Ext abstract Peleška, Paula Guertler NS 1
Enhancing Remote Sensing Accuracy for Miloš Láznička Jiří Haščyn No
Agriculture and Field Heat Mapping with Thermal publication UAVs NS 2
Investigating the Spectroscopic Properties of Akanksha Agarwal No
CVD-grown MoS2 for Next-Generation publication Optoelectronics NS 3
Estimating the Occlusion Effect through Rouben Rehman Simon Kersten No Impedance Tube Measurements publication NS 4
Exploring the Loss Landscape of Physics Informed Aneta Furmanová Ful Paper
Neural Networks in Room Acoustics NS 6
Simulative Evaluation of the Whistling Jan Boysen Andreas Wurzinger No
Potentiality of Pinhole Apertures publication NS 7
Development of 8-frame Mach-Zehnder Jakub Mareš Ful Paper
interferometer for laser plasma density measurements PE 1
Free-space powering using 3 W high-power laser Martin Mydlář No source operating at 980 nm publication PE 2
Nonlinear Impedance Spectroscopy on Lithium Dilane Dongmo No Iron Phosphate Batteries Tadoum publication PE 3
Ga2O3 Vertical Transistor Modeling and Analysis Filiberto Mancuso Ful Paper PE 4
Automated Battery Management System Elias Hempen Ful Paper
Simulation for State-of-X Estimation Algorithm Development POSTER 2025, PRAGUE MAY 22 1
An ANOVA-based Sequential Forward Channel
Selection Framework for BCI Application based on EEG Signals
Forouzan Salehi Fergeni
Medical Information Technology (MedIT), Helmholtz-Institute for Biomedical Engineering, RWTH Aachen
University, Pauwelsstr. 20, 52074 Aachen, Germany Salehi@hia.rwth-aachen.de
Abstract. Converting the movement intents of a person
mechanism when a participant imagines that they execute a
into commands for action employing brain signals like
motion of their body organs without really evolving that electroencephalogram signals is a brain-computer
region of their body, they are conducting motor imagery
interface (BCI) system. When left or right-hand motions
(MI). To illustrate, ‘right-hand movement’ or ‘left-hand
are imagined, different patterns of brain activity appear,
movement’ imagination can be differentiated. Generally, a
which can be employed as BCI signals for control. In the
computerized EEG classifying system includes three
present study a method of analysis of variance is used to aspects of preprocessing, feature extraction, and
select more appropriate and informative channels from a
classification of data. Capturing EEG signals manufactured
category of a large number of different channels. After
by the person generally is the first step of a real-time BCI
ordering channels based on their efficiencies, a sequential structure. After preprocessing, features of the
forward channel selection is employed to choose just a few
aforementioned signals are extracted, and the following,
reliable ones. Finally, the selected features are classified
suitable characters are chosen and then categorized for the
with different machine learning and neural networks
aim of being interpreted into orders for usage, ultimately,
classifiers with the purpose of comparing their
performance in this application. Utilizing a ten-fold cross-
feedback is delivered to the participants that include
validation approach, tests are performed on a motor
knowledge of whether their cognitive orders were
imagery dataset found in the BCI competition III.
identified or not [5]. An essential step in signal processing
Outcomes demonstrated that the SVM classifier got the
is decreasing the number of channels since establishing a
greatest classification precision of 97% when compared to
system with a lot of channels is time-consuming and
the other available approaches. The entire investigative
annoying for the user. The remaining manuscript is
findings confirm that the suggested framework is reliable
constructed in the following fashion. In the next part, the
and computationally effective for the construction of BCI
dataset that was used in the proposed research is explained. systems.
Section III outlines the proposed approach, while the
outcomes are reported in Section IV, and lastly, section VI deduced the presented work. Keywords
Brain-computer interface, channel selection, motor 2. Materials
imagery, support-vector-machine.
To construct a computerized structure for MI EEG
task classifications, the data set IV-b from BCI competition
III has been employed in the present research [6]. This data 1. Introduction
set consists of two classes, one for imagining the right hand
Transmitting information from the individual brain to a
and another for the imagination of the right foot. A number
computer via the user's unique mental signals is known as a
of 118 channels are monitored that were sites as the famous
BCI or brain-computer interface framework. BCI has made standard of 10/20-system [7].
significant achievements in previous years in multimedia
technologies and rehabilitations [1, 2]. In the field of
healthcare, BCI has caused an advance by creating 3. Methods
numerous brain-controlled devices [3], such as a mind-
controlled wheelchair, incontinence control machines, and
robotic limbs. Motor imagery is the engagement of the 3.1 Signal Preprocessing
neurological system when imagining the performance of a
To eliminate the noise with higher frequency caused by
task or body movement [4]. In fact, as a cognitive
movement and eye blinking and retrieve information within
F. S. F, AN ANOVA-BASED SEQUENTIAL FORWARD CHANNEL SELECTION FRAMEWORK FOR BCI APPLICATION BASED ON EEG SIGNALS
the relevant frequency bands, we employed a band-pass
forward channel selection (SFCS) method to rank the best
butter-worth filter of order 3 which improved the accuracy
channels. From the beginning of our selected channel
significantly. A common average reference (CAR) spatial
group, we evaluate each channel with the help of the
filter is also employed to eliminate the common noise.
particular classifier we aim to use. This will reveal the
Additionally, it lessens the impact of channels with unique
channel which results in higher accuracy. This is followed
noise. For a dataset with M channels and for the channel
by combining other channels to it to reach the best
number j, we reached the CAR-filtered signal using the
performance in the case of using two channels. This
process will continue to obtain the combination ending in following equation.
the most significant performance. (1) Where
is the original signal samples of th channel. 3.2 Channel Selection
EEG equipment can obtain brain activity data via
many channels on the skin surface of the brain. To avoid
some disadvantages of using too many channels,
Researchers must establish methods to determine the
greatest channels amongst numerous ones. These
techniques are designed with the purpose of decreasing the
computation time, boosting the categorization efficiency,
and choosing the most significant channels for a particular
function or operation [8]. In this research, we aim to
diminish the number of channels by a combined method. In
this method, firstly we employed a filter method to extract
the most effective channels. In the filter method, channels
are selected based on their score in some statistical tests.
These techniques choose the best channels via others
without considering the relationship between different
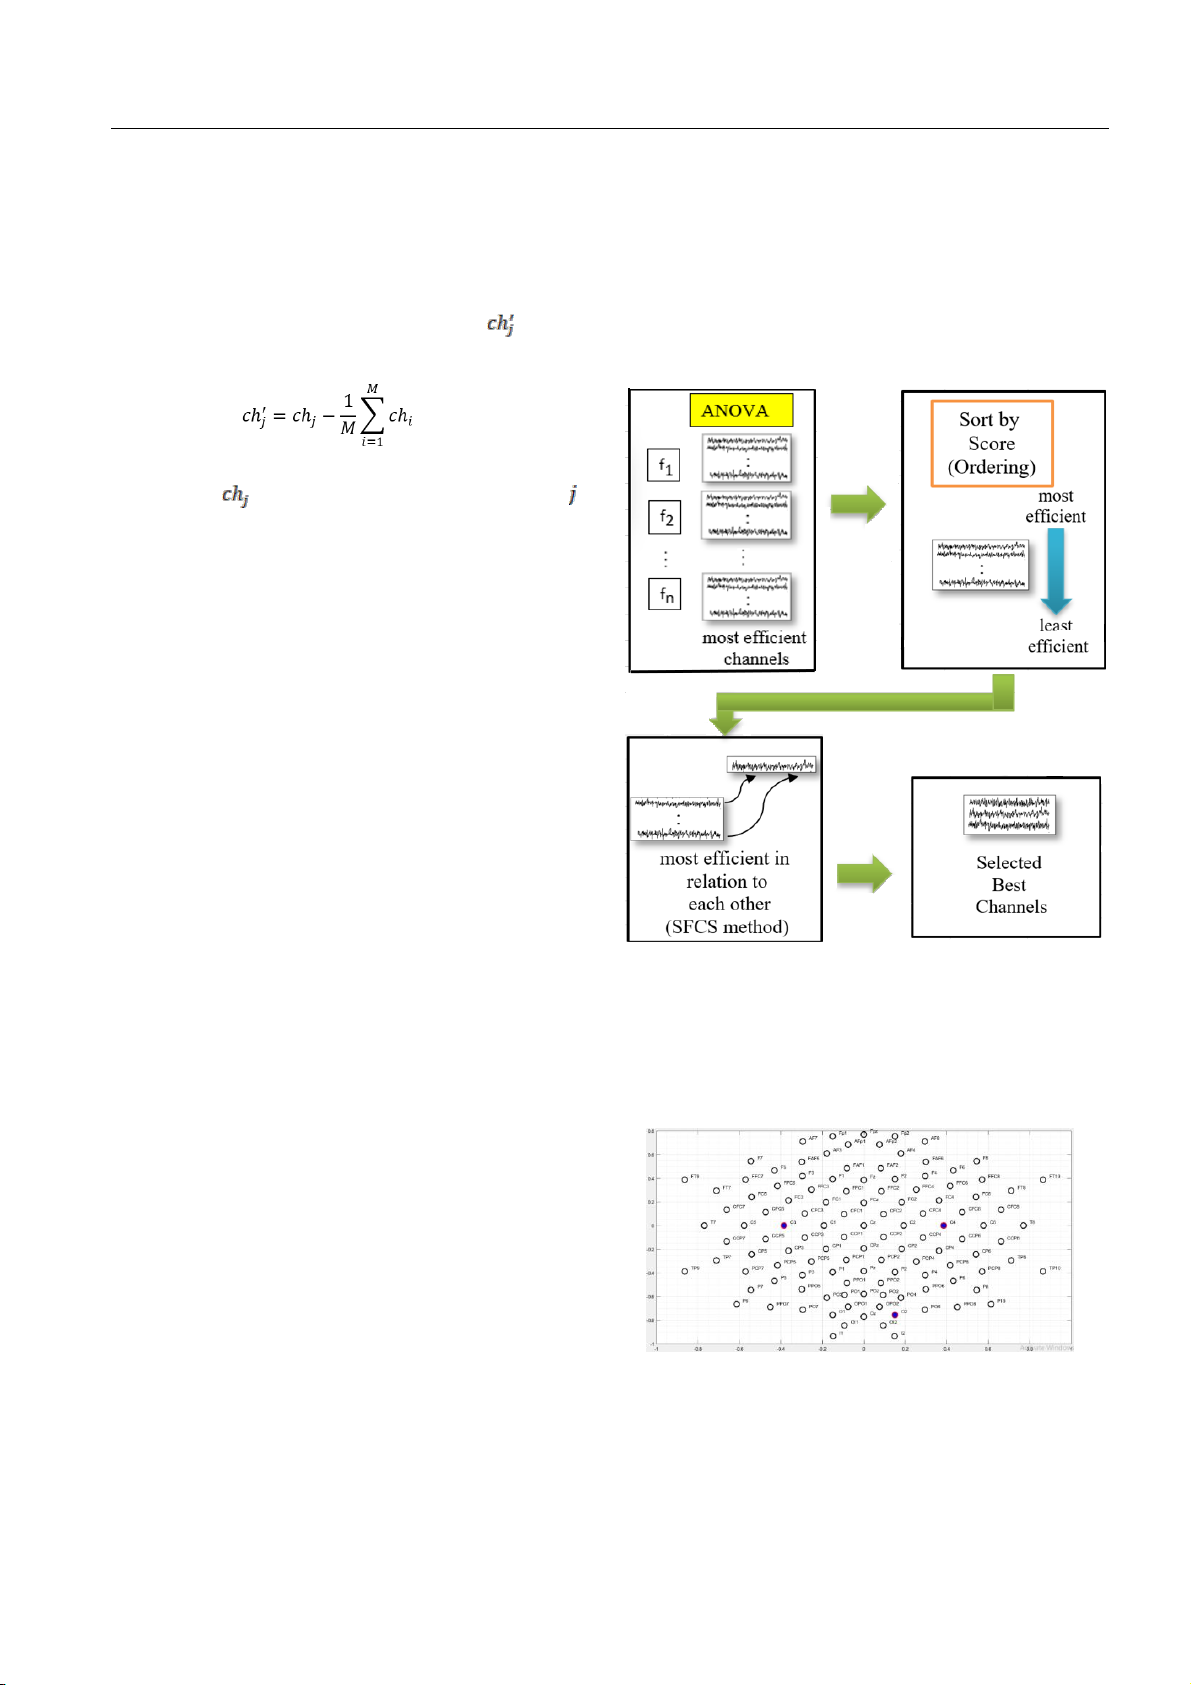
channels. On the other hand, wrapper methods put high Fig. 1.
Schematic drawing of the proposed channel
importance on the performance of channels in relation to selection method
each other. These approaches are costly in terms of
This method resulted in a high accuracy of 97 percent
computational aspects. In contrast, scaler or filter methods
with just 3 channels using the SVM classifier, which is a are much more time-saving.
remarkable outcome from the proposed algorithm. Fig. 2
This study executes channel selection in a way that
shows the position of all 118 channels of the dataset and
with the least possible number of channels, a high precision
the 3 most noticeable ones respectively.
will be achieved. Fig. 1 demonstrates a schematic drawing
of the introduced approach for channel selection.
The process commences when we represent every
single channel with some features considering the features
extracted from the feature selection stage. These categories,
which are representative of different characteristics of
channels, then, undergo an analysis of variance (ANOVA)
method, a filter method, to be evaluated. An ANOVA test
is a technique to realize if the outcomes of a survey or
experiment are important and convincing. Every channel in
each group will gain a particular order, representing its Fig. 2.
3 channels selected with the SFCS method among all the channels on the head
effectiveness. In this stage, every channel is assessed
separately without taking into account its relationship to
Combination of the 4th channel would not increase the
other channels or even considering the particular
accuracy significantly. To keep a balance we choose a
classification that will be used. After sorting the channels
trade-off between the number of channels and achievement,
based on their orders, half of the channels (the best ones)
we use the three first selected channels.
are separated from the rest of them. We use a sequential POSTER 2025, PRAGUE MAY 22 3 3.3 Classification
identical to and entirely consistent with those of CA,
proving the viability of the suggested technique.
After extracting features in time and frequency
domains, selecting the most informatic ones using t-test
method, and then normalization stage, we employ precision F1_score sensitivity specificity
classifiers. In order to have a comparison between the
efficiency of various classifiers on the presented issue we K-NN 98.1818 92.8049 89 98
have used seven methods. The classifiers employed in this Decision Tree 96.6667 93.7271 92 96
research are some machine learning techniques including
support vector machine (SVM), K-nearest neighbor (K- LDA 98.0909 93.7328 91 98
NN), linear discriminative analysis (LDA), decision tree, SVM (Kernel 88.1768 85.7548 85 88
and some neural networks namely multilayer perceptron Function= ‘Polynomial’ 94.0256 91.3318 90 93
(MLP), extreme learning machine (ELM), and probabilistic , ‘Gaussian’, neural network (PNN). 94.0256 91.3318 90 93 ‘RBF’, ‘Linear’) 98.1818 96.7566 96 98 MLP 91.7922 92.9578 95 90 4. Results #Neuron=10, 91.7922 91.8467 93 90 20,
In the proposed investigation, 10-fold cross-validation 91.7922 92.4315 94 90
is utilized in all classes to objectively assess the 30
convincingness of our suggested strategy. The feature set ELM 82.4016 88.5563 97 77
was partitioned into 10 sections at random for each trial. #Neuron=10, 85.7093 91.5187 99 82
Every instance in the feature vector was therefore assessed 20,
in both training and test sets. We utilized dataset IV-b from 84.0816 89.1897 96 80
BCI competition III for investigating the efficiency of our 30
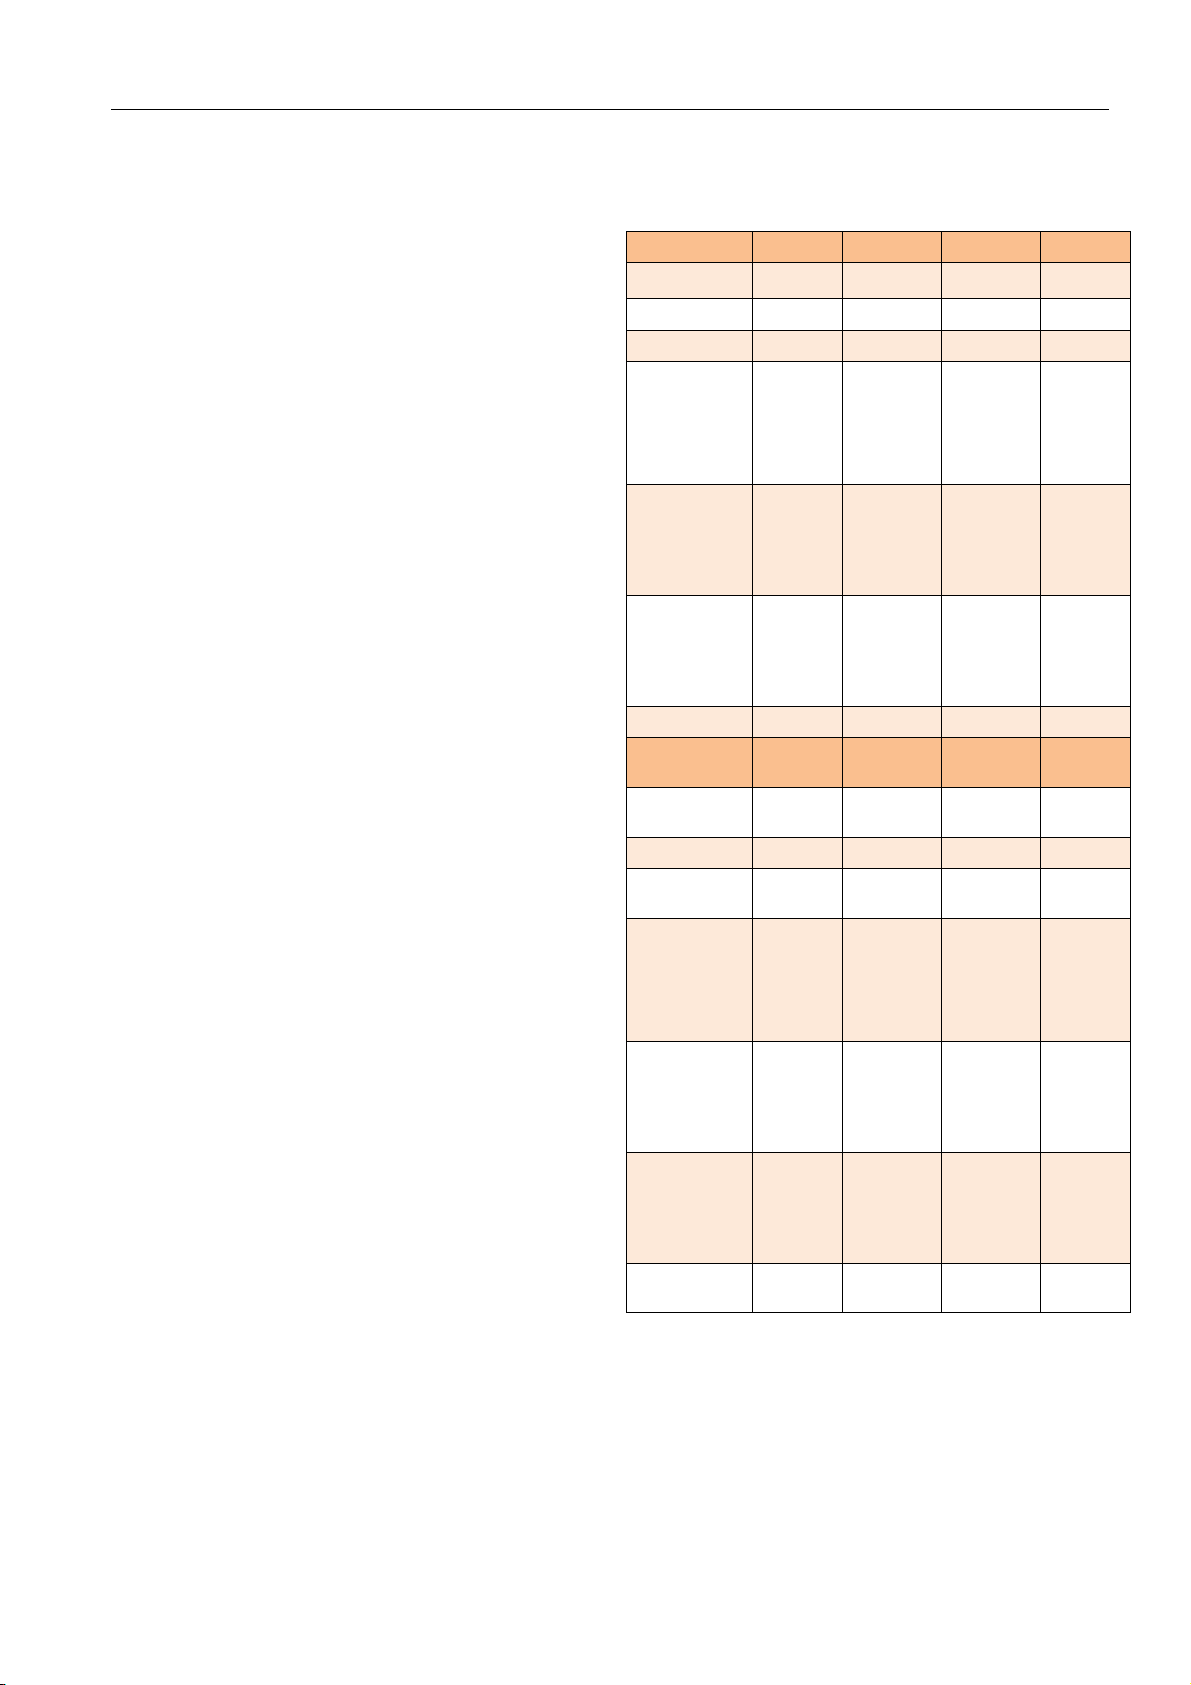
introduced technique. The accuracy obtained from the PNN 94.9957 92.042 90 95
SVM classifier with a linear kernel function is 97% by kappa Selected CRR Accuracy using only 3 EEG channels. Channels
Tab. 1. compares the gained result from all the classifiers K-NN 0.87 C3, CFC3, 0.9746 93.5
used in this study. In addition to accuracy, to further C4
confirm the effectiveness of the suggested approach, some Decision Tree 0.88 C3, CFC3 0.9831 94
other performance metrics including sensitivity, specificity, LDA 0.89 C3, CFC3, 0.9746 94.5
precision, kappa, and F1_score are also calculated. The ten- C2
fold average of Sen, Spe, Pre, Kappa, and F1-Score SVM (Kernel 0.73 C3, C4, O2 0.9746 86.5
employing time-domain and wavelet features and SVM Function=
classifier are 96%, 98%, 98.1818%, 96.7566%, and 0.94% ‘Polynomial’, 0.83 C3, C4, O2 0.9746 91.5
respectively. Moreover, another performance evaluation ‘Gaussian’, 0.83 C3, C4, O2 0.9746 78.5 ‘RBF’,
concerning the number of channels which was used is ‘Linear’) 0.94 C3, C4, O2 0.9746 97
CRR, which is equal to 0.974 in our case. MLP 0.85 C3, PO7, 0.9746 92.5
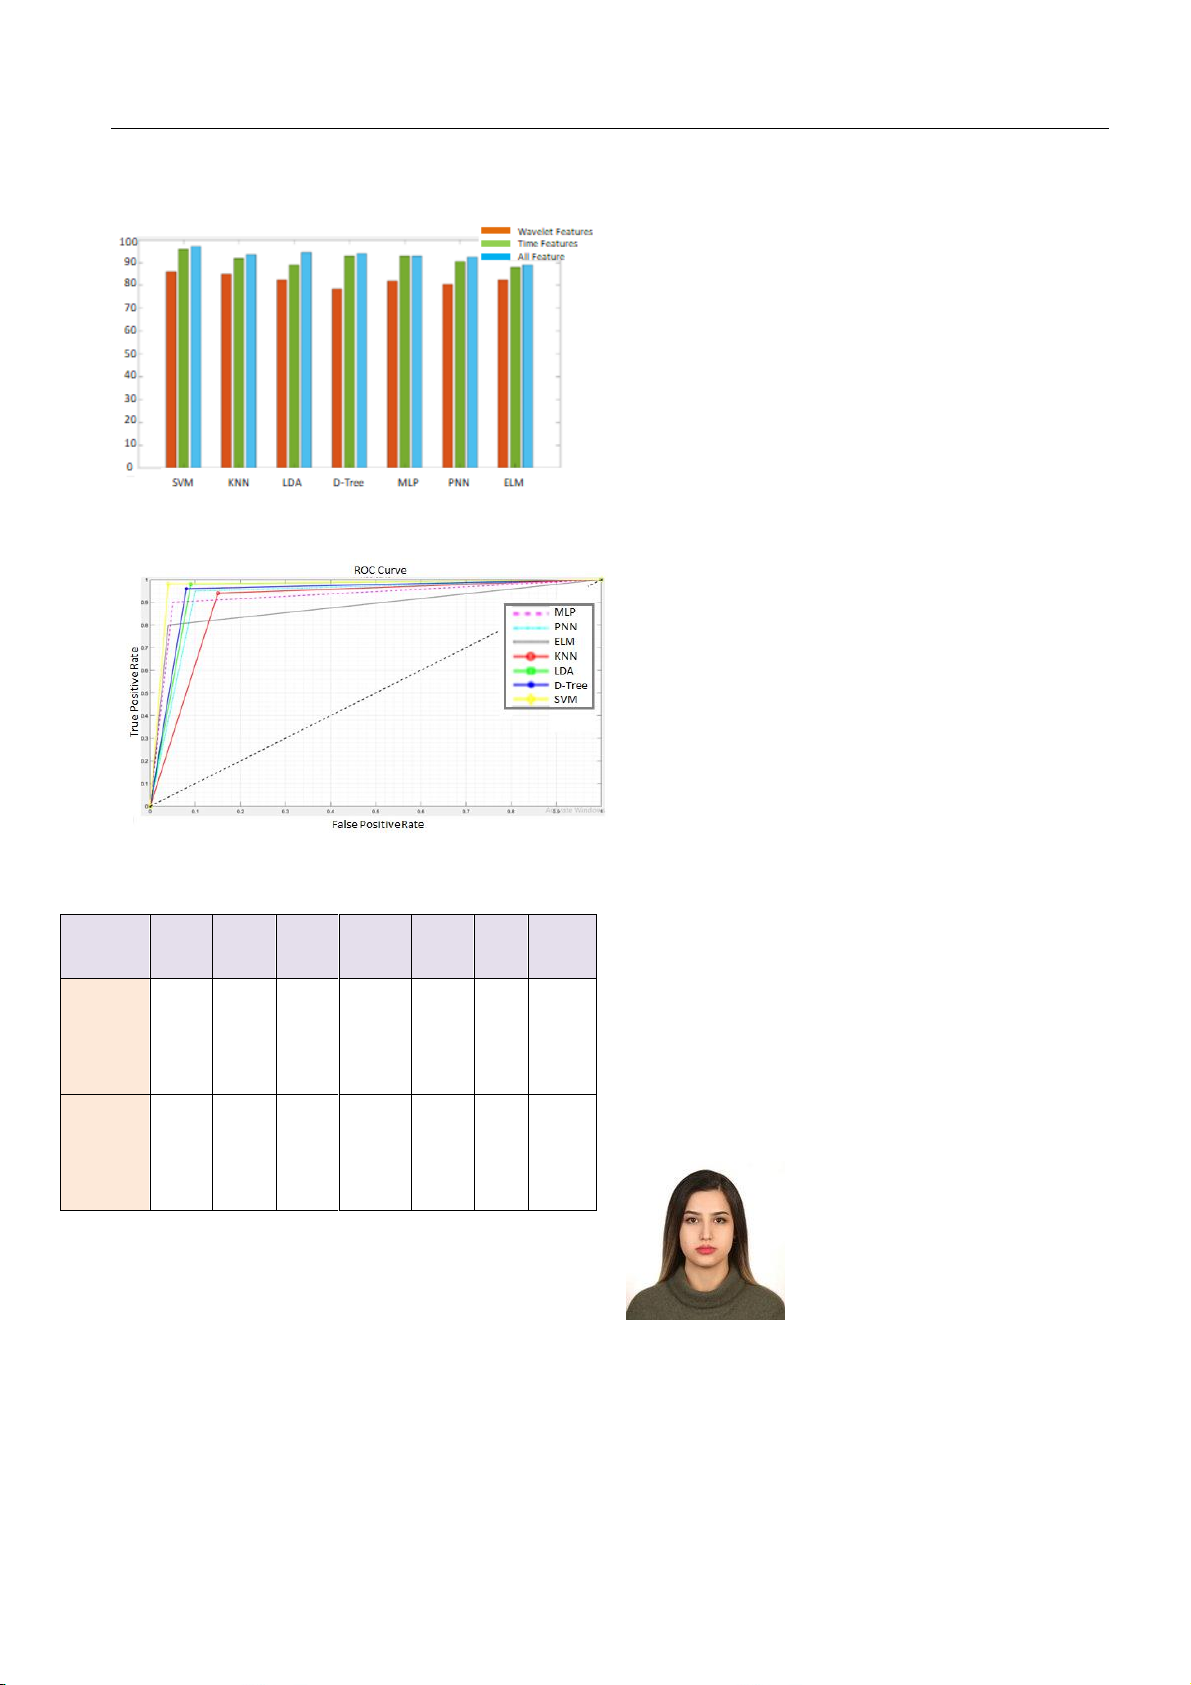
The difference between the features elicited in the time #Neuron=10, PO4 0.83 91.5
domain and wavelet domain can be shown in Fig. 3 which 20, 0.84 92
represents the different classifier outcomes obtained for the 30
two domain features. For the time domain feature, the
accuracy is 96% in SVM, and in the case of using wavelet ELM 0.74 C3, P6 0.9831 87 #Neuron=10,
domain features the average classification result is 86%. As 0.81 89
it can be inferred from the figure the combination of both 20, 0.76 88
kind of feature result in a better classification outcome, 30
emphasizing the effectiveness of our feature vector. PNN 0.85 Cz, PO8, 0.9746 92.5 C4
The efficiency of our method is further assessed with the
help of the receiver operating curve (ROC) as represented
Tab. 1. Comparison between different classifications and the
number of channels used for each of them
in Fig. 4. As seen, the ROC curve is plotted for different
employed classifiers. It is evident that ROC is near 1 and is
Reducing the number of channels not only is
above the reference line for all the classifiers and among
beneficial in time-saving, but it also helps the classifier to
them, the best performance belongs to SVM. Such findings
reach better accuracy as it eliminates redundant
similarly indicate and confirm the results we gain from
information and computational complexity. Tab. 2. brings a
other evaluation criteria. These acquired outcomes are
comparison between two cases of using only ANOVA and
diminishing the number of channels by half and employing
the SFCS after that. As can be concluded from this table in
F. S. F, AN ANOVA-BASED SEQUENTIAL FORWARD CHANNEL SELECTION FRAMEWORK FOR BCI APPLICATION BASED ON EEG SIGNALS
most classifiers with the reduction in the number of
By taking advantage of this channel selection approach,
channels, we achieved a higher performance.
from a dataset with 118 channels only a few channels were
used without deteriorating the classification accuracy The
number of features extracted from time and wavelet
domains could be further and also the frequency band that
is selected could be divided into more sub-bands. These are
considered as limitations and must be taken into account in future research. References
[1] GAUR, P., PACHORI, RB., WANG, H., PRASAD, G. A
multivariate empirical mode decomposition based filtering for
subject independent BCI. 2016 27th Irish Signals and Systems
Conference (ISSC); 2016: IEEE.
Fig. 3. The accuracy of different classifiers employing features
of the time domain, features of the wavelet domain, and
[2] JERBIC, AB., HORKI, P., SOVILJ, S., ISGUM, V., CIFREK, M.
features of the of both time and wavelet domains
Hilbert-Huang time-frequency analysis of motor imagery EEG data
for brain-computer interfaces. 6th European Conference of the
International Federation for Medical and Biological Engineering:
MBEC 2014, 7-11 September 2014, Dubrovnik, Croatia; 2015: Springer. [3]
VARONE, G., Boulila, W., Driss, M., et al., Finger pinching and
imagination classification: A fusion of CNN architectures for IoMT-
enabled BCI applications 2014 Information Fusion, vol. 101, p.
102006, 2024, doi: 10.1016/j.inffus.2023.102006.
[4] SADIQ, MT., YU, X., YUAN, Z., FAN, Z., REHMAN, AU., LI, G.,
et al. Motor imagery EEG signals classification based on mode
amplitude and frequency components using empirical wavelet
transform.2019 IEEE access.; 7:127678-92.
[5] Lotte, F., Bougrain, L., Cichocki, A., Clerc, M., Congedo, M.,
Rakotomamonjy, A., et al. A review of classification algorithms for
Fig. 4. Receiver operating curve (ROC) of different classifiers
EEG-based brain–computer interfaces: a 10 year update 2018 used in the proposed method
Journal of neural engineering.; 15(3):031005.
[6] YU, X., AZIZ, MZ., SADIQ, MT., FAN, Z., XIAO, G.. A new
framework for automatic detection of motor and mental imagery Classifier SVM K-NN LDA D-Tree MLP PNN ELM
EEG signals for robust BCI systems 2021 IEEE Transactions on
Instrumentation and Measurement.; 70:1-12. 56
[7] JURCAK, V., TSUZUKI, D., DAN, I., 10/20, 10/10, and 10/5 Channel
systems revisited: their validity as relative head-surface-based (Selected 96 92.5 90 92.5 93.5 92 88.5
positioning systems 2007 Neuroimage.;34(4):1600-11. by
[8] FAYE, I., ISLAM, MR., EEG Channel Selection Techniques in ANOVA)
Motor Imagery Applications: A Review and New Perspectives 2022 Bioengineering; 9(12):726. 2 or 3 Channels 97 93.5 94.5 94 92.5 92.5 89 (Selected by SFCS)
Tab. 2. Comparison of accuracy of classifiers using 56 channels
selected by ANOVA and a couple of channels selected after employing SFCS 5. Conclusion
Forouzan SALEHI FERGENI was born in Iran. She
received her Bachelor's degree in Electrical Engineering
In this research, the scalar and wrapper methods are
and the M.S. degree in Electrical Engineering, majoring in
coupled to produce a powerful channel selection technique
electronic integrated circuits, from Shahid Chamran
applied to multichannel EEG data. We employed the
University, Ahvaz, Iran. She is currently a Ph.D. student at
ANOVA method for reducing the number of channels and
RWTH Aachen University, Aachen, Germany.
the sequential forward feature selection for eliminating the
redundant channels. This approach has been used to
distinguish between two classes of the BCI EEG dataset. POSTER 2025, PRAGUE MAY 22 1
State of the Art in Pulsed-Dose Oxygen Delivery for Mechanical Ventilation Nika Khosravi, M. Sc.
Chair of Medical Information Technology, Helmholtz-Institute for Biomedical Engineering at RWTH Aachen University, Germany khosravi@hia.rwth-aachen.de Abstract.
While oxygen is readily available in devel-
delivery, is the primary focus of this paper. The follow-
oped regions, many hospitals and clinics in low-resource
ing sections examine pulsed-dose oxygen delivery, review-
settings struggle with life-threatening shortages, as reported
ing experimental in vivo studies conducted in animals and
by the World Health Organization (WHO). Pulsed dose oxy-
humans, as well as in vitro studies. Finally, the discussion
gen delivery, which conserves oxygen by administering it
analyzes the findings of these studies and identifies potential
only at the start of inspiration, presents a potential solution.
directions for future research.
Therefore, this study examines key advancements in oxygen
conservation within advanced ventilation systems through
pulsed dose oxygen delivery, particularly in resource-limited 2. Pulsed Dose Oxygen Delivery
settings. It also explores how to balance reduced oxygen
consumption with adequate patient oxygenation through an
As discussed in the previous section, one effective ap-
in-depth analysis of in vivo and in vitro studies on pulsed
proach to optimizing oxygen supply is the use of pulsed-dose
dose oxygen delivery, emphasizing its role in improving oxy-
oxygen delivery rather than continuous flow. This method
gen efficiency while enhancing oxygenation.
aligns with the anatomical structure of the lungs, where gas
exchange occurs in the alveoli, which make up approxi-
mately 90% of the lung’s volume. The remaining 10% con- Keywords
sists of conducting airways and larger blood vessels, forming
the anatomical dead space [10], where no gas exchange takes
Pulsed dose oxygen delivery, Oxygen conservation,
place. The principle behind pulsed-dose oxygen delivery is
Resource-limited settings, Mechanical ventilation.
to administer sufficient oxygen to the alveolar region at the
start of each breath, followed by air or non-oxygen-rich gas
to ventilate the dead space effectively. Figure 1 illustrates
the difference between pulsed dosing and continuous flow 1. Introduction
oxygen delivery. Administering a bolus at the start of the
ventilator breath ensures that higher oxygen concentrations
Although oxygen supplies are typically stable in de-
reach the alveoli, rather than mixing with air at the intake.
veloped nations, the WHO indicates that many healthcare
facilities in developing countries lack consistent access to
medical oxygen [1]. This challenge also impacts military
operations and remote medical facilities in these areas [7].
Given these challenges, the need for efficient oxygen deliv-
ery underscores the importance of investigating innovative
oxygen delivery systems and strategies in mechanical venti-
lation that ensure optimal patient care while conserving oxy-
gen resources. An optimal ventilation system should adjust
the parameters, such as Tidal Volume (VT), Positive End-
Expiratory Pressure (PEEP), Fraction of Inspired Oxygen
Fig. 1: Comparison of Oxygen (O2) concentrations at the on- (FiO
set of the ventilator breath for pulsed dose versus continuous
2), Inspiratory Time (TI), Expiratory Time (TE), Peak Inspiratory Pressure (P flow delivery. From [2].
peak), and others, while minimizing
unnecessary oxygen delivery to prevent both hypoxemia and
hyperoxemia. This can be achieved by designing a system
To assess the effectiveness of the reviewed pulsed-dose
that administers oxygen in controlled pulses at specific in-
oxygen delivery methods, physiological parameters such as
tervals during the inhalation phase instead of providing con-
the Partial Pressure of Oxygen in Arterial Blood (PaO2),
tinuous flow. This method, known as pulsed-dose oxygen
oxygen saturation (SpO2), and the oxygenation ratio in the 2
N. KHOSRAVI, POSTER 2025 CONFERENCE
blood relative to the inhaled oxygen concentration (P/F ra-
tio), defined as P aO2 , are monitored. For example, the tar- F iO2
get ranges for PaO2 and SpO2 during mechanical ventila-
tion could be approximately 95 [mmHg] and ≥ 95%, re-
spectively [13], [11]. The normal value for the P/F ratio is
400-500 mmHg at sea level [9]. According to the American-
European Consensus Conference Committee, the P/F ratio
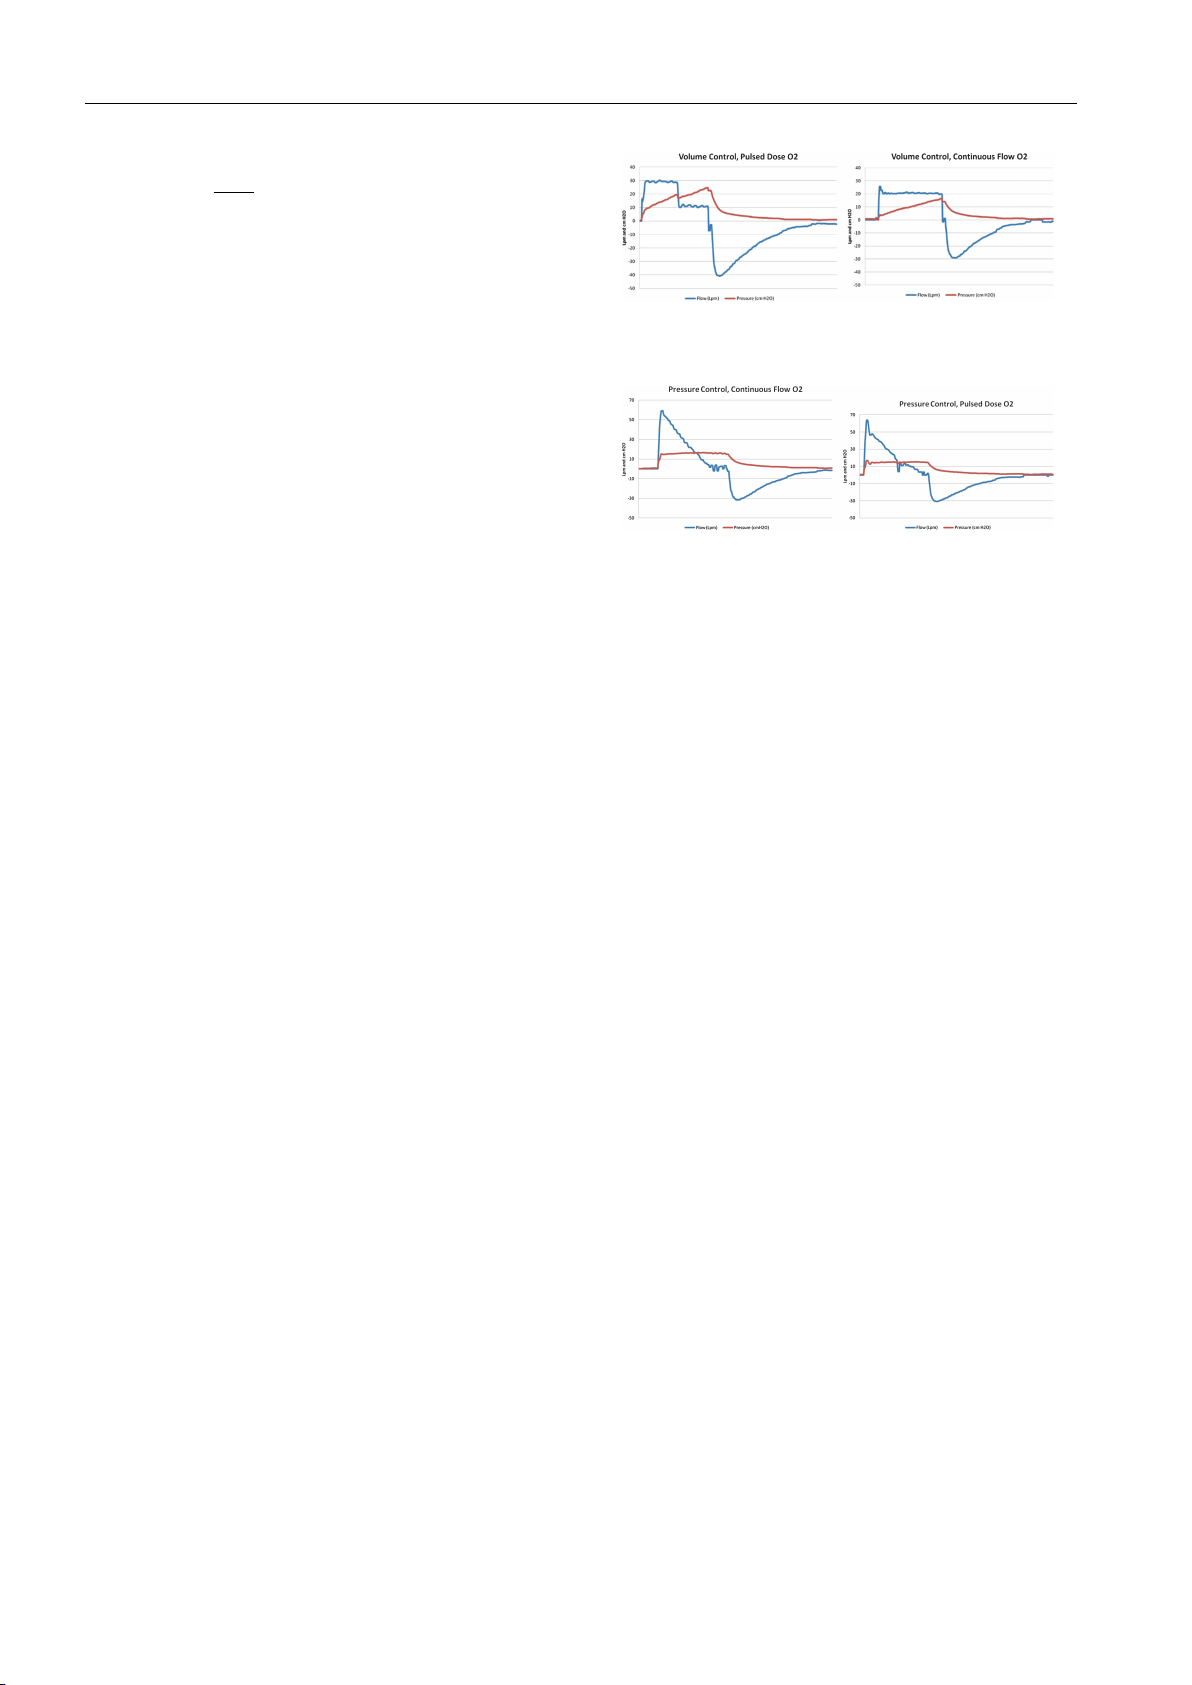
(a) Comparison of pulsed dose oxygenation (on the left) versus con-
can also be used to classify Acute Lung Injury (ALI) and
tinuous flow oxygenation (on the right) in volume-controlled ventila-
Acute Respiratory Distress Syndrome (ARDS), with a P/F tion.
ratio of ≤ 300 for ALI and ≤ 200 for ARDS and severe hypoxia [12].
The following sections provide a review of exploratory
in vivo and in vitro studies conducted over the years to test
and validate the effectiveness of pulsed-dose oxygen deliv- ery.
(b) Comparison of pulsed dose oxygenation (on the left) versus con-
tinuous flow oxygenation (on the right) in pressure-controlled venti- lation.
2.1. Exploratory In-Vivo Studies in Animals
Fig. 2: Comparison of pulsed dose and continuous flow oxy-
This section reviews studies on animals, starting with
genation in different ventilation modes. From [8].
[6], which examines the effectiveness of pulsed-dose oxy-
gen delivery using the EverGo™ Portable Oxygen Concen-
trator (POC) to treat hypoxemia during anesthesia in 16
pecially in volume-controlled mode. This method was more
free-ranging brown bears, 18 bighorn sheep, and 5 captive
effective, delivering a larger volume of oxygen to the airways
reindeer. Oxygen was administered intranasally via pulsed
and enhancing alveolar uptake during the initial part of each
delivery, with pulse volumes ranging from 12 to 70 [mL],
breath, while the latter part ventilated the anatomical dead
and a maximum capacity of 1.05 [L/min]. The goal was to
space. However, the study had limitations: the maximum at-
achieve target PaO2 levels of 83 [mmHg] for brown bears,
tainable FiO2 of the POC was about 60%, which may not be
73 [mmHg] for bighorn sheep, and 82 [mmHg] for reindeer.
sufficient for all clinical scenarios, and conventional oxygen
Results showed significant improvements in arterial oxy-
systems may be needed for cases requiring higher flow rates.
genation for brown bears and reindeer, but only minor
changes in bighorn sheep. The authors suggest adjusting the
The authors of [2] conducted an animal study with 18
pulse volume according to the respiratory rate and note that
female Yorkshire pigs, sedated with propofol to eliminate
shallow breathing increases dead space ventilation, reducing
spontaneous breathing. Baseline ventilator settings included
pulsed oxygen delivery efficiency. Additionally, they found
a VT of 8–10 [mL/kg], a PEEP of 5 [cmH2O], and an FiO2 of
that if pulse delivery exceeds 70% of the inspiratory dura-
100%, with the respiratory rate adjusted to maintain a pH be-
tion at high respiratory rates, oxygen is lost in the anatomical
tween 7.35 and 7.45. They used the Zoll 731 series portable dead space.
ventilator (Zoll Medical Corp., Chelmsford, MA) along with
a Sequal Saros POC (Chart Industries, Ball Ground, GA).
Another study by the authors in [8] investigates the ef-
The system employed a closed-loop proportional-integral-
fectiveness of continuous versus pulsed-dose oxygenation
derivative (PID) control mechanism, adjusting the oxygen
using a POC in volume-controlled and pressure-controlled bolus size based on SpO
ventilation settings on pigs with ALI. ALI was induced in
2 readings, aiming for a target of
94%. The ventilator automatically adjusted the tidal volume
15 pigs by administering oleic acid. Standard settings were
to match the oxygen bolus delivered by the POC. The timing
used, including a respiratory rate of 14 breaths per minute,
of bolus delivery was carefully controlled within a range of
a VT of 450 [mL], FiO2 of 40%, and no PEEP. The POC
-4,500 to +150 milliseconds, as shown in Figure 3. Arterial
provided continuous oxygen flow at 3 [L/min] and pulsed
blood gases were sampled 20 minutes after any changes in
doses of 180 [mL], about 40% of VT. Figures 2a and 2b
pulsed dose timing. The ventilator and POC communicated
show the differences in oxygen delivery between continu-
effectively, allowing adjustments to both tidal volume and
ous flow and pulsed doses in both ventilation modes. In oxygen output.
volume-controlled mode, pulsed-dose delivery resulted in a
staircase-like flow pattern, with a notch at the end indicat-
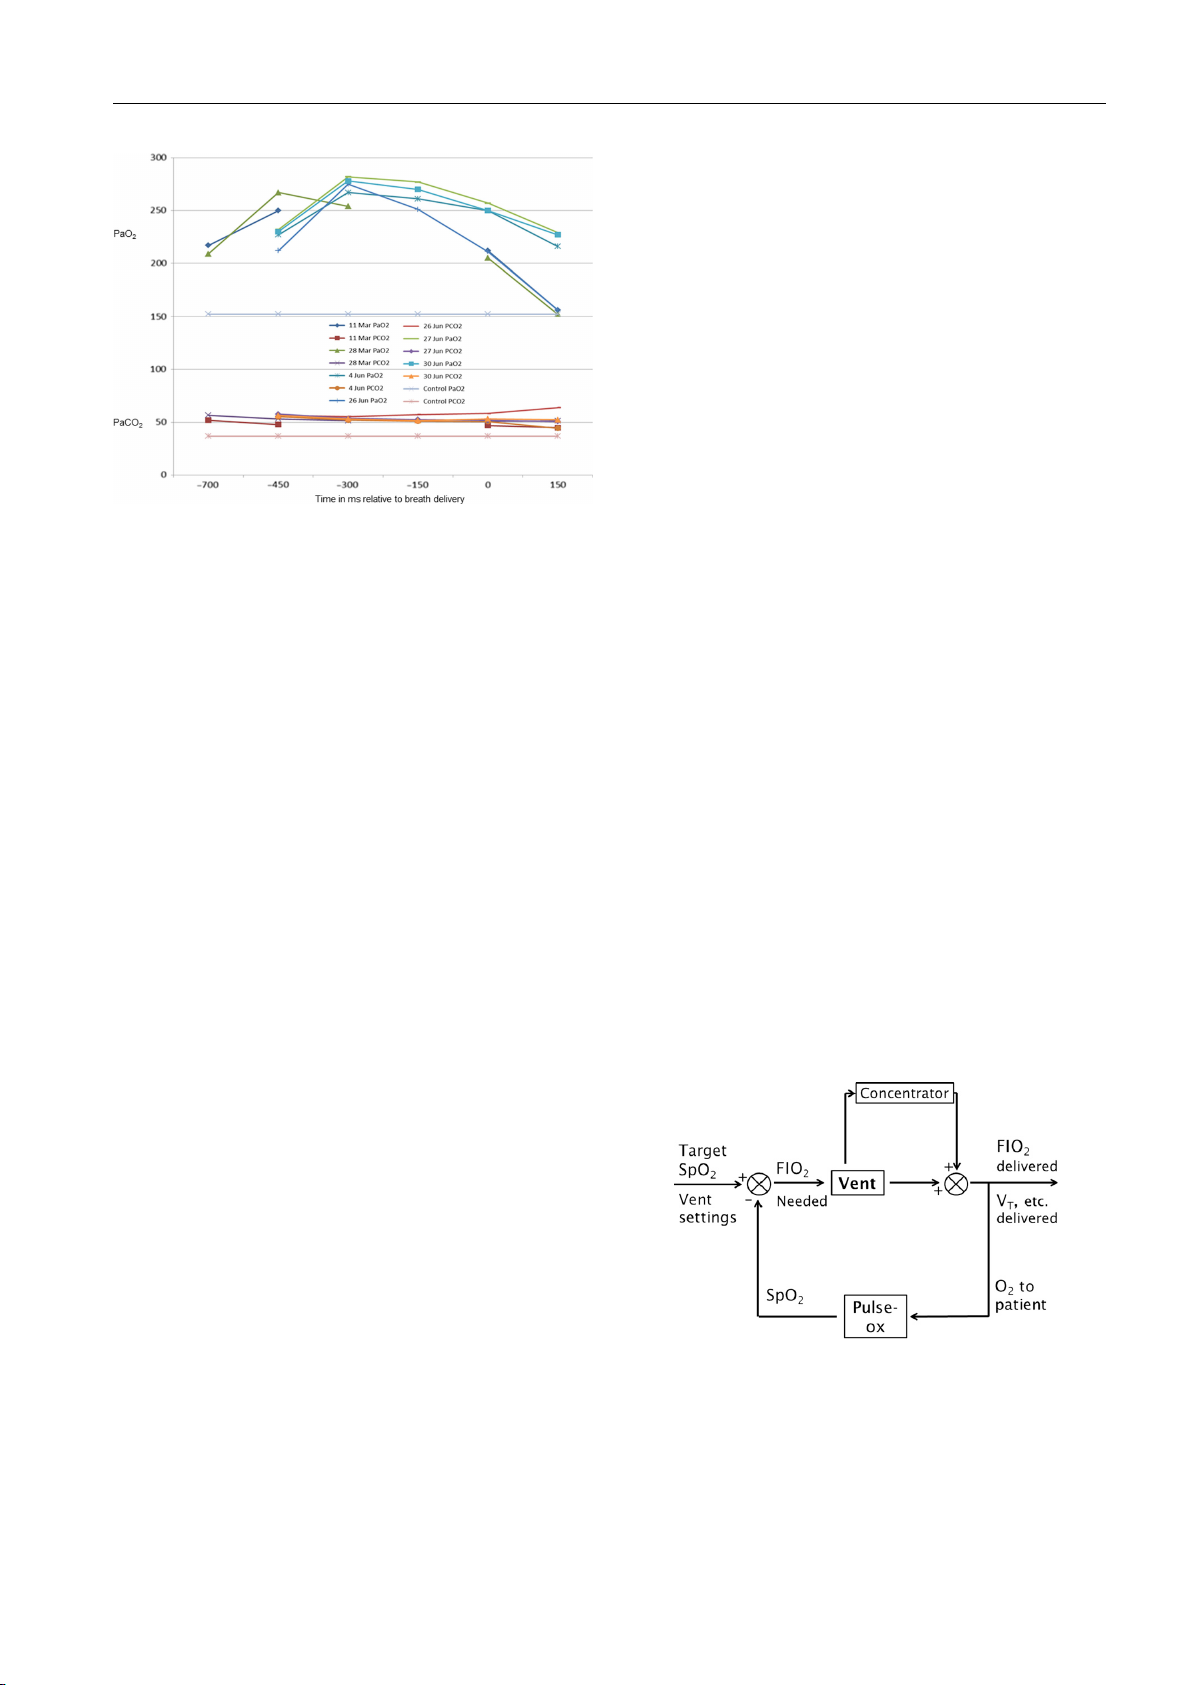
Furthermore, the authors of [2] aimed to identify the
ing oxygen delivery at the start of each breath, improving
optimal timing for oxygen bolus delivery to achieve the high-
oxygenation efficiency without significantly increasing air-
est PaO2 levels. Boluses delivered at -150 [ms] and -300
way pressures. The authors found that pulsed-dose delivery
[ms] before inhalation significantly increased oxygen levels
achieved a higher P/F ratio compared to continuous flow, es-
compared to other intervals. They also compared the effects
of 1 [mL] and 16 [mL] oxygen bolus increments. No sig- POSTER 2025, PRAGUE MAY 22 3
were analyzed. Their results showed a statistically signifi-
cant but clinically unimportant difference in SpO2 between
continuous-flow and PDOCD, with the PDOCD maintain-
ing adequate SpO2 levels in most patients. Specifically, the
mean SpO2 for continuous-flow was 95.7% and for PDOCD
was 93.2%. The study concluded that the PDOCD was able
to maintain adequate SpO2 during sleep in selected patients.
In study performed by [3], the authors conducted a
study to compare the effectiveness of continuous flow oxy-
gen from cylinders with pulsed dose oxygen from portable
concentrators in treating altitude-induced hypoxemia. A
total of 30 participants were randomly divided into three
groups and subjected to simulated altitude conditions. The
results demonstrated that both continuous flow and pulsed
dose oxygen successfully reversed hypoxemia in all subjects.
Fig. 3: Timing of bolus doses in relation to VT delivery and
However, the quantity of pulsed dose necessary to achieve
its effects on PaO2 and PaCO2 levels. From [2].
oxygen saturation levels comparable to those attained with
continuous flow varied significantly among the groups. Fur-
thermore, the increase in subjects’ VT at altitude required the
nificant differences were observed between the 1 [mL] and
pulse dose setting to be increased by 6–37% compared to the
16 [mL] bolus schemes in terms of SpO2, O2 doses, and
manufacturer’s suggested setting for continuous flow, in or-
PEEP. However, discrepancies in SpO2 were lower with the
der to achieve oxygen saturation levels equivalent to contin-
16 [mL] bolus scheme at 60 and 90 minutes.
uous flow oxygen delivery. As a result, pulse-dose oxygen
delivery did not result in significant oxygen savings at high
altitudes, where increased tidal volume and deeper breathing raised oxygen demand.
2.2. Human Subject In-Vivo Studies
Research studies such as those in [14], [4], and [3] have
conducted human trials to compare pulsed dose oxygenation 2.3. In-Vitro Studies
with continuous flow oxygenation in patients with various conditions.
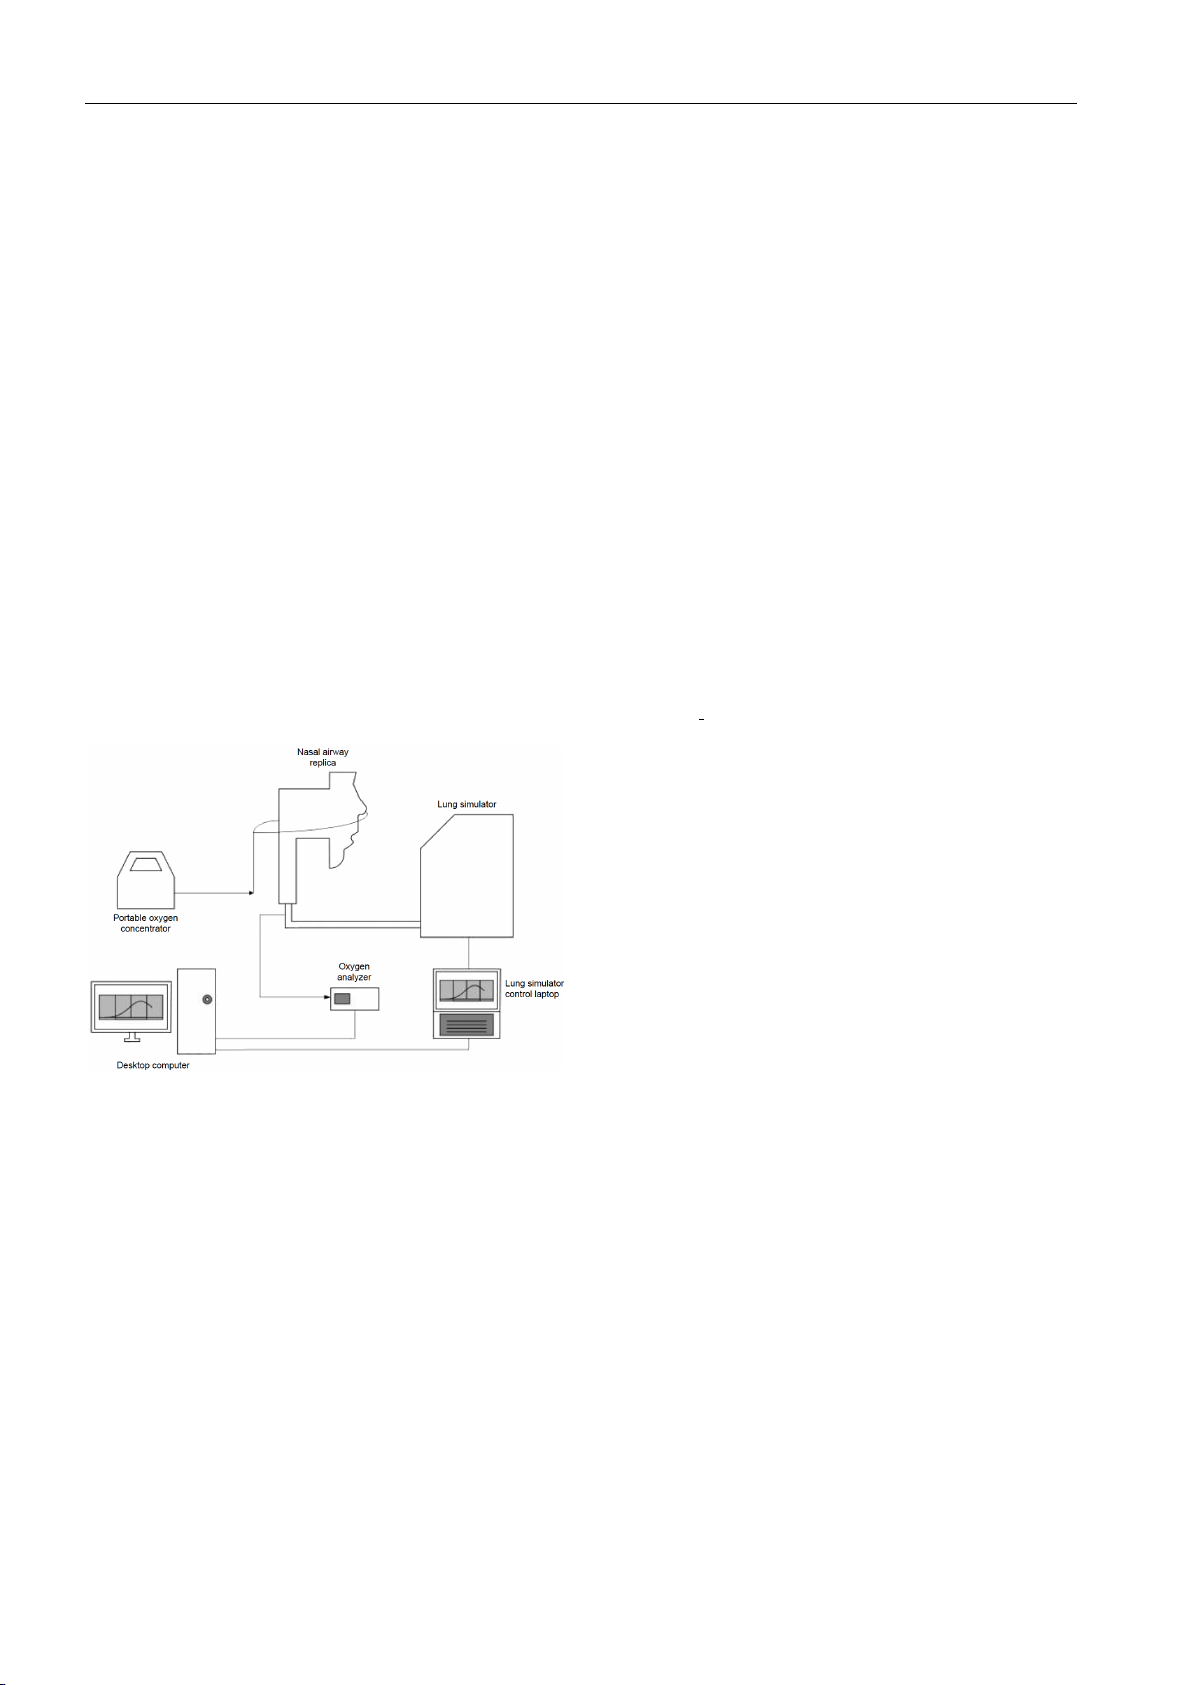
The research by [7] presents a closed-loop system for
regulating oxygenation using a POC (SeQual Eclipse 3) and
The study detailed in [14] evaluates both the effec-
a mechanical ventilator (Impact 731). These devices are in-
tiveness of oxygenation and patient satisfaction when us-
terconnected through a computer program for seamless com-
ing a single portable pulse-dose oxygen-conserving device munication. SpO
(PDOCD) versus a combined system that includes a fixed
2 measurements from pulse oximetry pro-
vide feedback to adjust the oxygen delivery parameters, in-
device for continuous-flow oxygen and a portable device cluding FiO
for pulse delivery during ambulation. This investigation in-
2, ensuring adequate oxygenation.
volved 25 participants diagnosed with Chronic Obstructive
Pulmonary Disease (COPD). The researchers maintained
oxygen flow at rest for each participant to ensure that SpO2
remained at or above 92%, based on arterial blood gas anal-
ysis. Their findings indicated that using portable concen-
trators alone resulted in more frequent periods of low oxy-
gen levels compared to the combined system. Additionally,
the study reported that portable concentrators were associ-
ated with longer durations of adequate oxygen levels during
the night, achieving 44.3% versus 13.4% for the combined
system. Survey results also revealed that 43% of partici-
pants preferred portable concentrators, while 36% favored
the combined systems, and 21% expressed no preference.
Fig. 4: Closed-Loop Control Diagram Featuring Concentra-
The study in [4] also use PDOCD for nocturnal oxygena- tor Integration. From [7].
tion compared to continuous flow. The study involved 10
home-oxygen patients with emphysema or pulmonary fibro-
Tidal volumes of 350 [mL], 550 [mL], and 750 [mL]
sis. They underwent sleep-apnea to provide baseline SpO2
were paired with inverse respiratory rates of 22 [bpm], 16
and heart rate data. Patients were switched from continuous-
[bpm], and 10 [bpm], respectively. In pulse dose mode, oxy-
flow systems to a PDOCD for one night, and oximetry data
gen bursts were delivered 1,000 [ms], 750 [ms], and 500 4
N. KHOSRAVI, POSTER 2025 CONFERENCE
[ms] before each breath, with volumes of 192 [mL], 128 References
[mL], and 64 [mL]. Results showed that pulse dose oxygena-
[1] Increasing access to medical oxygen. https://apps.who.int/
tion achieved higher peak FiO2 values compared to continu-
gb/ebwha/pdf_files/WHA76/A76_R3-en.pdf, 2023. Ac-
ous flow, reaching 76.83% without PEEP and 70.95% with cessed: 2024-04-29.
PEEP. Continuous flow reached a maximum of 47.81% with-
[2] T. Blakeman, D. Rodriquez, J. Johannigman, and R. Branson. Pulsed
out PEEP and 47.18% with PEEP. The concentrator in pulse
dose oxygen delivery during mechanical ventilation: impact on oxy-
genation. Military Medicine, 184(5-6):e312–e318, 2019.
dose mode consumed only 68% of the power while provid-
[3] T. C. Blakeman, D. Rodriquez, T. W. Gerlach, W. C. Dorlac, J. A.
ing up to 161% higher FiO2, reflecting a 237% improvement
Johannigman, and R. D. Branson. Oxygen requirement to reverse
in oxygen delivery efficiency. However, the study’s depen-
altitude-induced hypoxemia with continuous flow and pulsed dose
dence on a test lung model with constant compliance is a
oxygen. Aerospace Medicine and Human Performance, 86(4):351– 356, 2015. limitation.
[4] R. L. Chatburn, J. S. Lewarski, and R. W. McCoy. Nocturnal oxy-
The study by [5] developed an in vitro model using
genation using a pulsed-dose oxygen-conserving device compared to
continuous flow. Respiratory Care, 51(3):252–256, 2006.
acrylic replicas of adult nasal airways to compare pulsed
[5] J. Z. Chen, I. M. Katz, M. Pichelin, K. Zhu, G. Caillibotte, M. L.
and continuous oxygen delivery from a POC. The model
Noga, W. H. Finlay, and A. R. Martin. Comparison of pulsed versus
included a lung simulator for precise breathing control and
continuous oxygen delivery using realistic adult nasal airway replicas.
real-time oxygen concentration measurements at the trachea
International journal of chronic obstructive pulmonary disease, pages
outlet. The results showed lower FiO 2559–2571, 2017. 2 values for pulse flow,
especially with decreased minute ventilation, such as during [6] ˚
A. Fahlman, N. Caulkett, J. M. Arnemo, P. Neuhaus, and K. E. Ruck-
stuhl. Efficacy of a portable oxygen concentrator with pulsed delivery
sleep. However, these findings are specific to one POC and
for treatment of hypoxemia during anesthesia of wildlife. Journal of
may not apply to all devices. A limitation is the lack of oxy-
Zoo and Wildlife Medicine, 43(1):67–76, 2012.
gen uptake in the simulated lung, which impacts real-world
[7] M. M. Gangidine, T. C. Blakeman, R. D. Branson, and J. A. Jo- accuracy. hannigman.
System design verification for closed loop control
of oxygenation with concentrator integration. Military Medicine, 181(suppl 5):177–183, 2016.
[8] J. D. Gustafson, S. Yang, T. C. Blakeman, W. C. Dorlac, and R. Bran-
son. Pulsed dosed delivery of oxygen in mechanically ventilated pigs
with acute lung injury. Journal of Trauma and Acute Care Surgery, 75(5):775–779, 2013.
[9] L. Kadkhodai, M. Saghaei, M. Habibzadeh, B. Alikiaii, and S. J.
Hashemi. Estimating the best fraction of inspired oxygen for cal-
culation of pao2/fio2 ratio in acute respiratory distress syndrome due
to covid-19 pneumonia. Journal of Research in Medical Sciences, 27(1):38, 2022.
[10] L. Knudsen and M. Ochs. The micromechanics of lung alveoli: struc-
ture and function of surfactant and tissue components. Histochemistry
and cell biology, 150:661–676, 2018.
[11] M. K. Mau, K. S. Yamasato, and L. Yamamoto. Normal oxygen satu-
ration values in pediatric patients. 2005.
[12] N. T. Mowery, W. H. Terzian, and A. C. Nelson. Acute lung injury.
Current problems in surgery, 57(5):100777, 2020.
[13] E. Ortiz-Prado, J. F. Dunn, J. Vasconez, D. Castillo, and G. Viscor.
Partial pressure of oxygen in the human body: a general review. Amer-
Fig. 5: Schematic representation of the experimental setup,
ican journal of blood research, 9(1):1, 2019.
highlighting the direction of oxygen flow indicated by ar-
[14] A. M. Y´a˜nez, J. P. Prat, J. L. ´
Alvarez-Sala, M. Calle, S. D. Lobato,
J. L. G. Gonzalez, J. M. R. Gonzalez-Moro, R. Galera-Mart´ınez, rows. From [5].
C. Villasante, I. Ramos, et al. Oxygenation with a single portable
pulse-dose oxygen-conserving device and combined stationary and
portable oxygen delivery devices in subjects with copd. Respiratory Care, 60(3):382–387, 2015. 3. Discussion About Authors. . .
This paper reviews current studies on pulsed dose oxy-
gen delivery, highlighting improvements in some cases and
Nika KHOSRAVI was born in 1998 in Kermanshah, Iran.
limited benefits in others, with challenges that still require
She completed her Bachelor’s and Master’s degrees in Elec- further investigation.
Notably, the studies lack patient-
trical Engineering at RWTH Aachen University. Motivated
specific tailoring for oxygen dosage timing and quantity. Fu-
by a keen interest in biomedical engineering, she then began
ture research should focus on refining this tailoring, inte-
her Ph.D. at the Chair of Medical Information Technology
grating spontaneous breathing, and conducting more in vivo
(MedIT), focusing on data-driven control in artificial venti-
evaluations to ensure these methods meet patient needs ef- lation. fectively. POSTER 2025, PRAGUE MAY 22 1
A Single Helical Interstitial Applicator for Microwave Hyperthermia
Michaela NEČASOVÁ1, Filip ZAJAN1, Kateřina PAVELKOVÁ1
1 Department of EM Field, Faculty of Electrical Engineering, Czech Technical University in Prague, Czech Republic
necasmi4@fel.cvut.cz, zajanfil@fel.cvut.cz, pavelkat@fel.cvut.cz
Abstract. This article presents the design and experimental
consists of a microwave generator, a coaxial cable, and
evaluation of a single helical interstitial applicator for
a microwave applicator. The designed applicator is the key
localized microwave hyperthermia treatment. The
component that determines the 3D Specific Absorption Rate
applicator operates at a frequency of 2.45 GHz and is
(SAR) distribution and the temperature profile in the treated
intended to treat small tumors with a 2–3 cm diameter
tissue. Hyperthermia can be applied in a non-invasive
located under the skin. The study includes numerical
manner using an array of antennas surrounding the patient
simulations in Sim4Life focusing on the distribution of the
(regional hyperthermia; e.g., at 70 MHz), or through an
specific absorption rate (SAR) and the reflection coefficient
invasive method, in which an interstitial applicator is |s11|.
directly inserted into the tumor, enabling localized heating
with significantly lower power levels (e.g., 20 W instead of
The designed applicator was manufactured and tested using
>1000 W in regional hyperthermia). Various types of
an agar phantom with dielectric and thermal properties
applicators are used depending on the clinical application,
similar to human muscle tissue. Experimental results
with waveguide or planar applicators being common for
confirm efficient energy delivery with a measured reflection
regional hyperthermia, while coaxial and helical interstitial
coefficient of −46.5 dB and a controlled thermal response.
applicators are more suitable for precise, localized heating
This research supports the potential of single-antenna
of deep-seated tumors (e.g., 2–3 cm beneath the skin). In
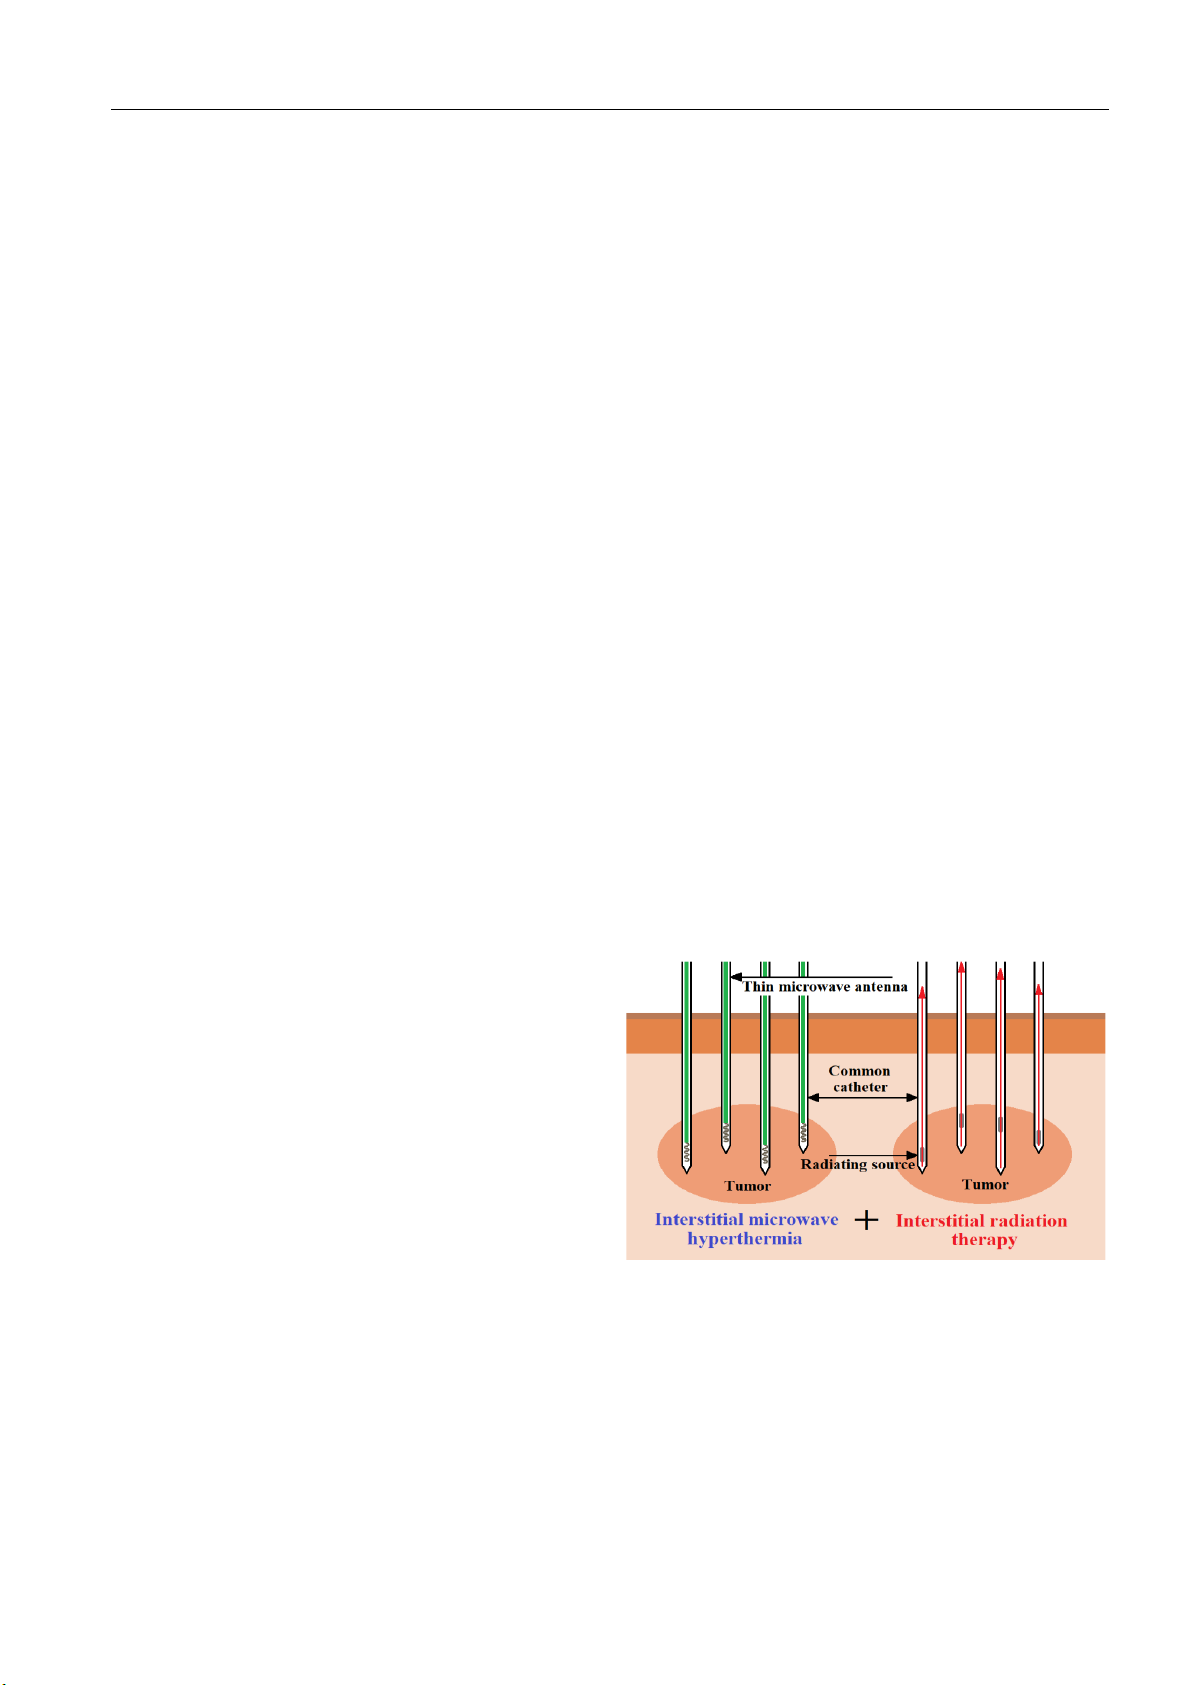
hyperthermia for interstitial cancer treatment. At the same
clinical practice, interstitial hyperthermia is often combined
time, the optimized applicator can be used in the design of a
with interstitial brachytherapy, where the same catheter is
more complex hyperthermia system.
used first for microwave heating and then for inserting
a radioactive source such as Iridium-192, making it an
effective treatment for radiation-resistant tumors [1–8]. Keywords
Microwave thermotherapy, local hyperthermia, helical
antenna, interstitial applicator. 1. Introduction
Electromagnetic (EM) fields have various applications
in medicine, particularly in oncology, where they are utilized
for both diagnosis and treatment. Traditional cancer
therapies such as surgery, chemotherapy, and radiotherapy
remain the standard; however, innovative approaches using
EM fields at microwave frequencies (300 MHz–300 GHz)
are being actively researched. One of the most promising
Fig. 1. Scheme of the combined interstitial hyperthermia and
techniques is microwave hyperthermia, a thermotherapy interstitial brachytherapy.
method that selectively destroys tumor cells by exploiting
Microwave hyperthermia has been successfully used
their lower heat resistance compared to healthy tissue.
for the treatment of pancreatic, gastrointestinal, esophageal,
Tumor cells undergo apoptosis (cell death) when exposed to
breast, cervical, bladder, and head/neck tumors, particularly
temperatures above 42 °C, while healthy tissue can tolerate
when combined with radiotherapy, as it improves perfusion,
temperatures close to 45 °C [1, 2].
oxygenation, and immune response activation. Larger
tumors (>2 cm) are more resistant to radiotherapy, and
Since biological tissue behaves as a lossy dielectric,
which absorbs EM energy and converts it into heat,
hyperthermia is particularly effective in the tumor center,
microwave hyperthermia enables controlled heating for
where it enhances therapeutic outcomes [9]. This paper
oncological treatment. A hyperthermic system typically
focuses on the design, numerical modeling, and 2
M. NEČASOVÁ, F. ZAJAN, K. PAVELKOVÁ, A SINGLE HELICAL INTERSTITIAL APPLICATOR FOR MICROWAVE HYPERTHERMIA
experimental validation of a single interstitial helical
Sim4Life is a specialized electromagnetic simulation
applicator operating at 2.45 GHz for localized microwave
software based on the Finite-Difference Time-Domain
hyperthermia. The primary objective is to optimize the (FDTD) method [16].
applicator’s performance by evaluating its reflection
The primary goal was to optimize the impedance
coefficient (|s11|), SAR distribution, and temperature rise in
matching of the applicator, ensuring efficient power transfer
an agar phantom, which mimics human muscle tissue [4– 10].
into the treated tissue. The applicator was placed in
a homogeneous agar phantom, mimicking human muscle
tissue, with dielectric parameters obtained from the IT'IS
Foundation database [14]. The key dielectric properties at 2. Materials and Methods
2.45 GHz are summarized in Tab. 1.
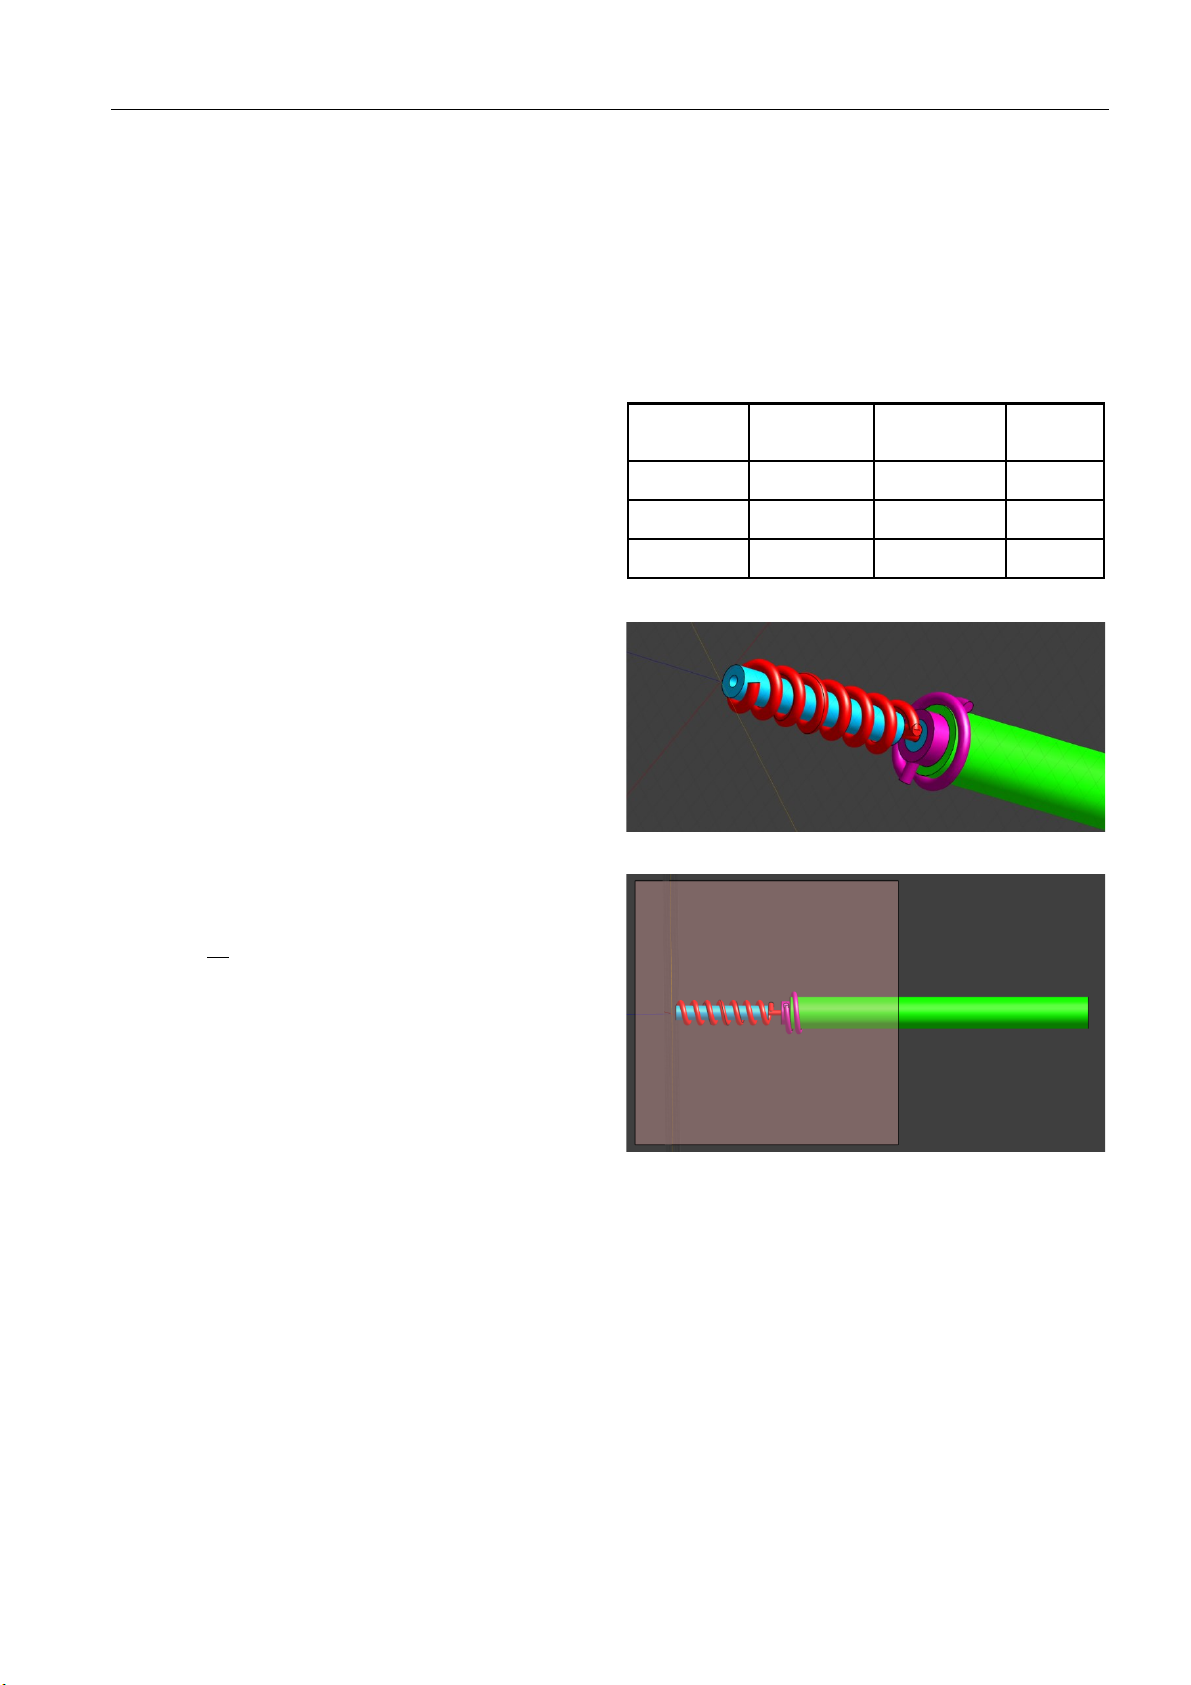
The microwave applicator is based on a helical dipole Relative Electric
structure utilizing the properties of a coaxial cable. The key Density Component permittivity conductivity (kg/m³)
design requirement for interstitial hyperthermic applicators (-) (S/m)
is minimizing their diameter to ensure minimally invasive Helices and PEC PEC PEC conductors
insertion into biological tissue. To meet this requirement, Dielectrics
a commercially available RG178 coaxial cable was selected, 2.1 0 2200 and jacket
featuring a wave impedance of 50 Ω and an operating Tissue 52.7 1.76 1090
frequency range of up to 3 GHz [13]. phantom
Tab. 1. Dielectric properties of a model for frequency 2.45 GHz. 2.1
Design of the Helical Applicator
The microwave applicator is based on a helical dipole
structure. The antenna consists of two helices wound from
the inner conductor of the coaxial cable. One helix is
connected to the inner conductor, while the other is
connected to the outer conductor. The material properties
and helix dimensions are determined by the chosen coaxial
cable, as specified in the mentioned datasheet [13].
To ensure effective microwave energy penetration into
Fig. 2. Detail of the connection of helices in the Sim4Life.
biological tissue, the effective penetration depth (d) was
calculated based on cylindrical wave propagation, using the following formula: 1 𝑑 = , (1) 2𝛼
where α represents the attenuation constant that depends on
the medium's electrical conductivity and permeability. This
formulation provides a more accurate estimation for
cylindrical wave propagation, which better represents the
field behavior around the helical applicator. Using this
approach, the effective penetration depth was determined to
be 1.52 cm for biological tissue [9–12].
The applicator was designed to operate in the normal
Fig. 3. Model demonstration of applicator inserted into an agar
(radial) mode, meaning the circumference of the helix is
phantom in Sim4Life (initial applicator design).
smaller than the wavelength of the radiation. In this mode,
the radiation maximum is perpendicular to the axis of the 2.3
Simulation of Reflection Coefficient
helix, while the minimum is along the axis, ensuring
effective energy delivery to the surrounding tissue. The helix and SAR Distribution
length, number of turns, pitch, and circumference were
For the simulation setup, an edge source was used as
optimized based on electromagnetic simulations in
the input excitation, which is a common simplification in
Sim4Life software. Figures 2 and 3 in the next subsection
computational models. The primary goal of the simulations
illustrate the designed applicator [12, 15].
was to optimize the reflection coefficient (∣s11∣), ensuring
that microwave power is efficiently transferred into the 2.2 Model in Sim4Life
tissue. A lower reflection coefficient means that less power
is reflected to the generator, maximizing energy deposition
The numerical model of the helical applicator was
within the target region. The target value for ∣s11∣ was below
implemented in Sim4Life to evaluate its electromagnetic
−10 dB to minimize reflection losses [9, 11].
performance at an operating frequency of 2.45 GHz. POSTER 2025, PRAGUE MAY 22 3
During the simulations, the parameters of the helical
structure were adjusted to achieve the best possible results
(minimization of the reflection coefficient). The final
parameters of the designed applicator are:
• coaxial cable length: 47 mm, • helices pitch: 1 mm,
• length of the first helix: 8 mm (~8 turns),
• length of the second helix: 1.5 mm (~1.5 turns),
• distance between helices: 5 mm.
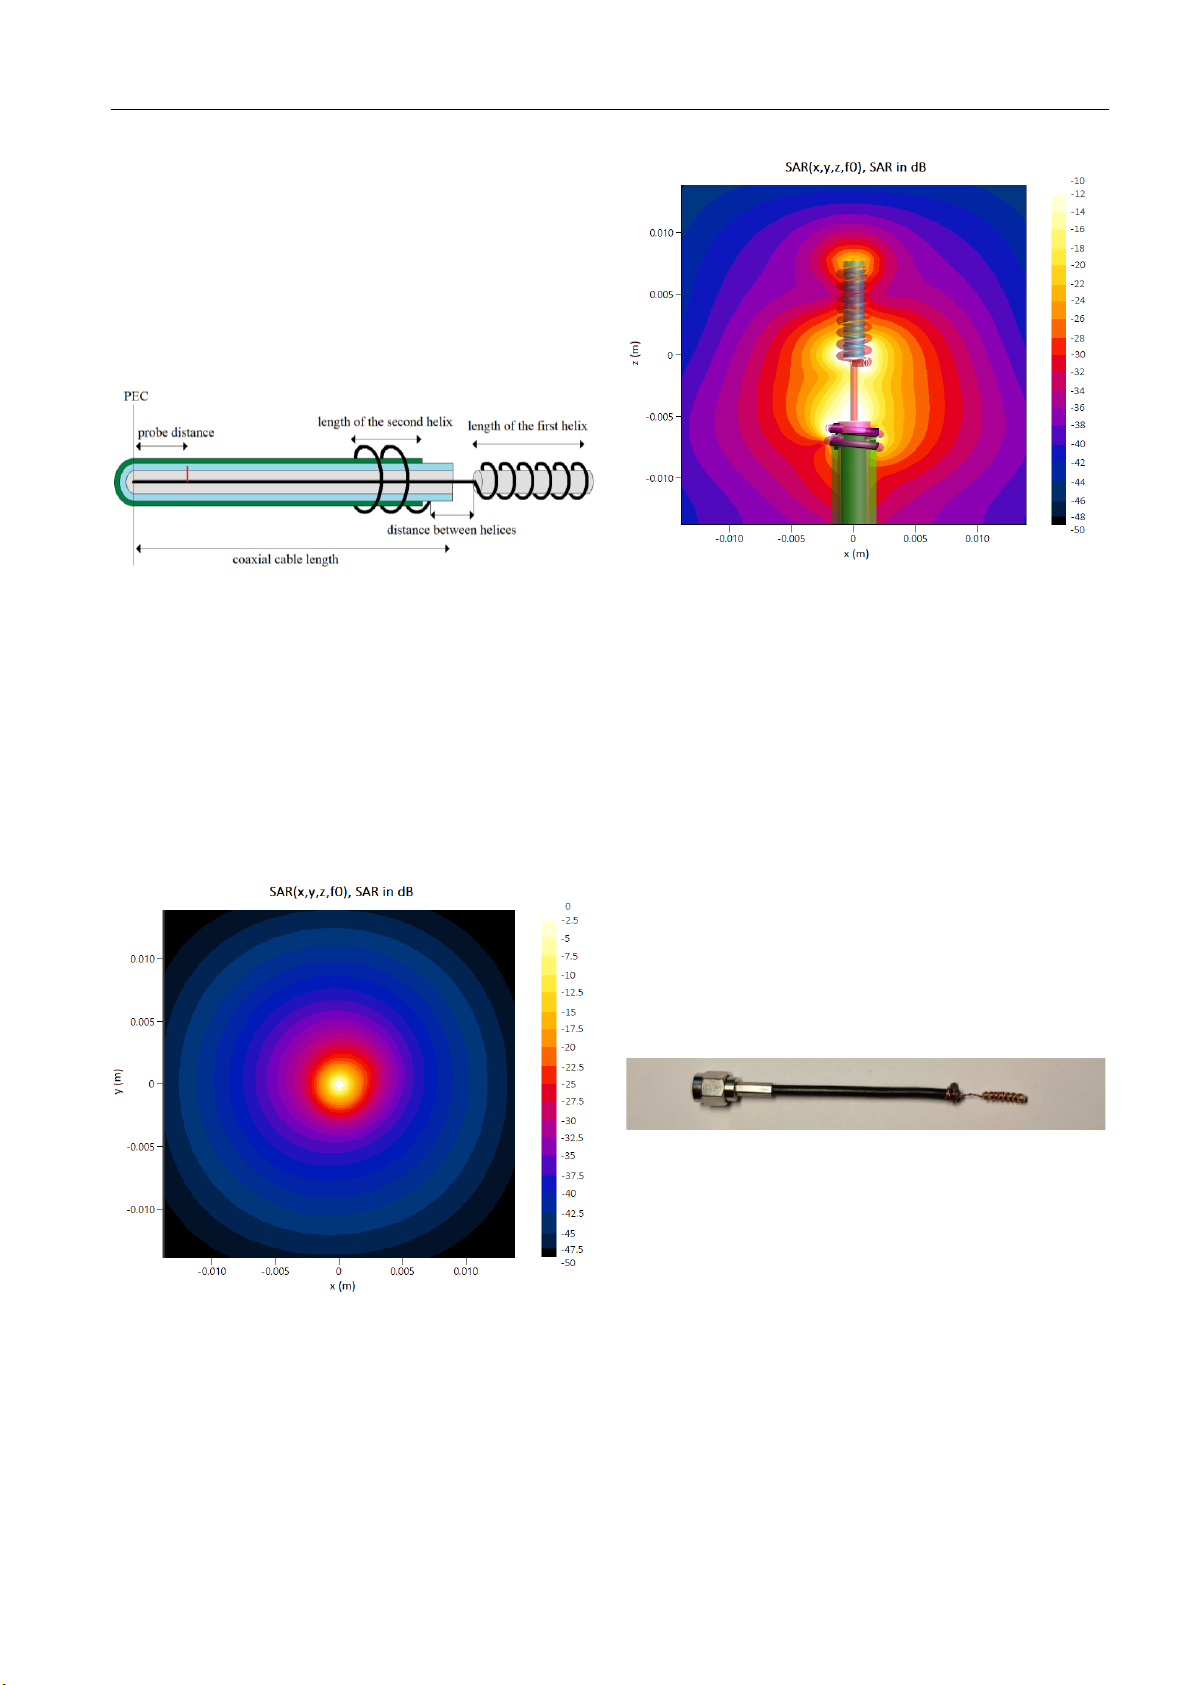
Fig. 4. Illustration of the applicator for implementation in the
Fig. 6. Simulated SAR distribution in ZX plane. Sim4Life program.
In the simulation, the applicator was placed in a 30 mm
The final simulation results showed an impedance
cubic agar phantom. The SAR distribution shows how
matching of −39.4 dB, which is far below the −10 dB
energy is absorbed in the tissue phantom. Uniform heating
threshold, ensuring efficient energy transfer at 2.45 GHz.
improves therapeutic effectiveness and minimizes side
Figures 5 and 6 show the SAR (Specific Absorption Rate) effects.
distribution in both the XY and ZX planes, demonstrating
the energy absorption pattern in the tissue model. The
maximum SAR absorption occurs between the helices, 2.4
Implementation of the applicator
creating a well-localized heating region. Minor variations in
The applicator was manufactured using an RG174
SAR distribution may be due to current distribution along
coaxial low-loss cable, which shares similar electromagnetic
the helices and internal wave reflections.
properties with the RG178 cable used in simulations. The
RG174 cable was selected due to its availability and
compatibility with the designed helical structure. During the
fabrication process, the inner dielectric was carefully
removed from the coaxial cable and subsequently used as
internal insulation for the helical structure. Extreme
precision was required to prevent small deformations in the
helices. Figure 7 shows the final fabricated applicator
equipped with an SMA connector (50 Ω).
Fig. 7. Manufactured applicator with a helix wound on the inner dielectric. 2.5
Measurements and Results
The applicator was experimentally tested to validate its
simulated performance using two measured quantities:
Fig. 5. Simulated SAR distribution in XY plane.
reflection coefficient (∣s11∣) measurement to assess
impedance matching and 3D SAR temperature distribution
analysis to evaluate power absorption and heating
characteristics. The reflection coefficient was measured at
2.45 GHz using an Agilent Technologies E5062A network
analyzer in the laboratory of the Department of
Electromagnetic Field, Czech Technical University in
Prague. The applicator was inserted into an agar phantom at
a depth of 22.5 mm, and the measured reflection coefficient
was −46.5 dB, closely correlating with the simulated value 4
M. NEČASOVÁ, F. ZAJAN, K. PAVELKOVÁ, A SINGLE HELICAL INTERSTITIAL APPLICATOR FOR MICROWAVE HYPERTHERMIA
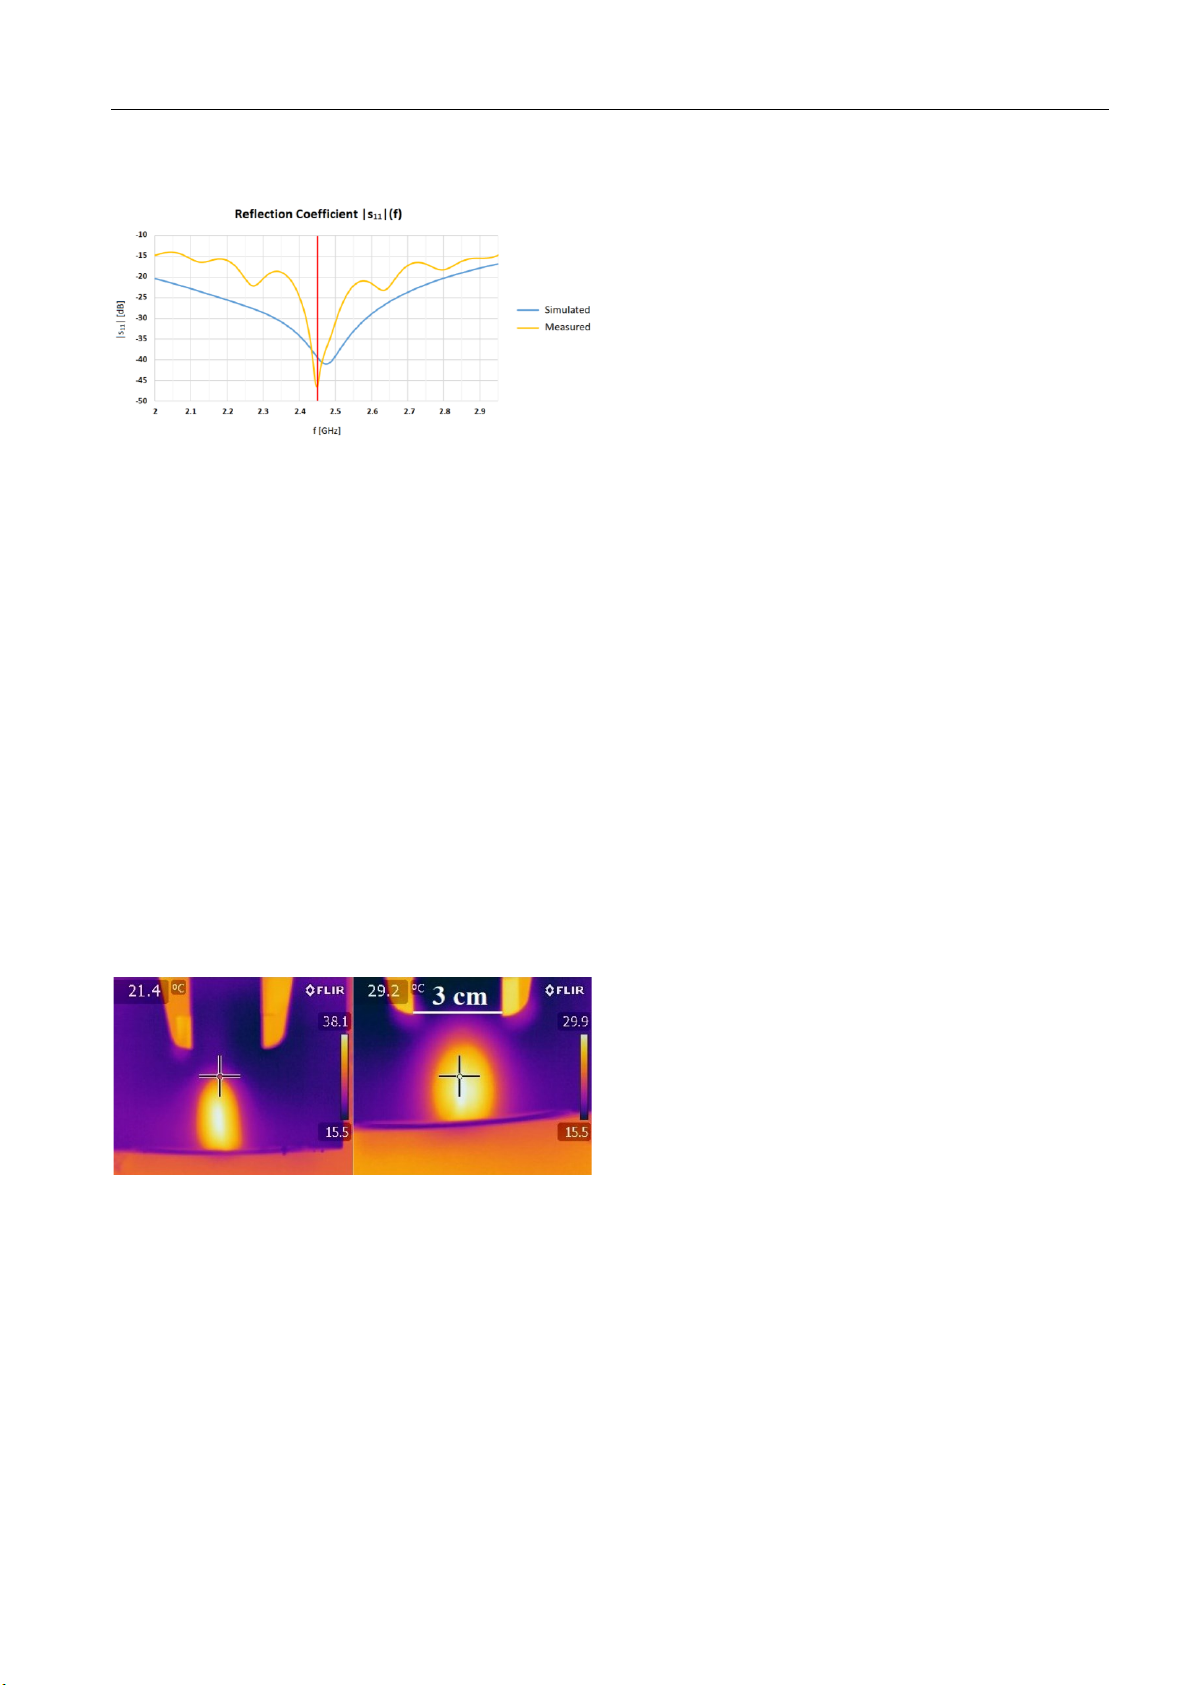
of −39.4 dB. Figure 8 compares the simulation and 3. Conclusion measurement results.
This study demonstrated the design, numerical
modeling, and experimental validation of a single helical
interstitial applicator for localized microwave hyperthermia
at 2.45 GHz. The proposed applicator was optimized to
ensure effective impedance matching, with a simulated
reflection coefficient of −39.4 dB and an experimentally
measured value of −46.5 dB, confirming excellent energy
transfer efficiency. The SAR and temperature distribution
analyses indicated that the applicator effectively heats
a localized tumor region of 2–3 cm, with peak temperatures
concentrated in an elliptical heating zone. The measured
Fig. 8. Comparison of the reflection factor |s11| from the
temperature increased from 15.5 °C to 29.2 °C at the heating
simulation in Sim4Life and the factor measured in the
centre while maintaining controlled peripheral heating, laboratory environment.
confirming the applicator's suitability for targeted
The temperature distribution was analyzed in the
hyperthermia treatment. The simulated SAR distribution
Faculty of Biomedical Engineering, using a Sairem
corresponds to the observed temperature distribution,
microwave generator (output power up to 200 W, frequency
confirming the consistency between electromagnetic energy
range 2400–2500 MHz) and an infrared (IR) thermal camera
absorption and thermal response.
(FLIR E60) for temperature monitoring. The experimental
The experimental results closely aligned with
setup included an agar phantom designed to replicate muscle
simulation data, verifying the applicator’s efficiency in
tissue properties, ensuring realistic thermal and
controlled energy deposition. These findings suggest that the
electromagnetic behavior. After 60 seconds of microwave
helical applicator design is a viable solution for minimally
exposure at 2.45 GHz, thermal imaging analysis was
invasive hyperthermia treatment, with potential applications
conducted. The IR thermograms confirmed that the
in future multiport applicator hyperthermia arrays for deep-
temperature distribution in the agar phantom closely aligned seated tumor treatment.
with numerical simulations, verifying the applicator's
effectiveness in controlled energy deposition and localized heating. Acknowledgements
The initial temperature of the agar phantom’s interior
was 15.5 °C. Throughout the thermal imaging measurement,
The research described in the paper was supervised by
a sliding caliper was placed next to the phantom to provide
Prof. J. Vrba, Dept. of EM Field, FEE CTU in Prague, and
a clear reference for the total heated area visible on the
supported by the Czech Technical University under grant thermogram, Figure 9.
No. SGS25/143/OHK3/3T/13: „Advanced methods for
modeling electromagnetic structures “. And as well by
a project of the European Union: CE0200670 –
MedWaveImage: „Microwave imaging technology transfer
to innovate the medical sector“. References
[1] VRBA, J., LAPES, M., OPPL, L. Technical aspects of microwave
thermotherapy. Bioelectrochemistry and Bioenergetics. 1999 April;
Fig. 9. Thermogram of temperature distribution in the ZX axis
48(2): 305-9 doi: 10.1016/ s0302-4598(99)00039-2. PMID:
after a long exposure of 60 seconds. 10379544.
The measurement results showed that after 60 seconds
[2] VRBA, J. Medical applications of microwave technique (in Czech).
of microwave exposure, the temperature in the immediate
Czech Technical University in Prague, 2003. 168 pages. ISBN 80-01-
vicinity of the applicator increased from 15.5 °C to 29.2 °C 02705-8.
at the center of the heating zone, while at approximately 1
[3] VRBA, J., FRANCONI, C., LAPES, M. Theoretical limits for the
cm from the center, the temperature reached 21.4 °C. The
penetration depth of intracavitary applicators. Int. J. of Hyperthermia,
temperature distribution formed an elliptical shape, Volume 12, 1996 – Issue 6.
demonstrating that the applicator design successfully meets
[4] FRANCONI, C., VRBA, J., MICALI, F., PESCE, F. Prospects for rf.
the requirements for heating tumors of 2–3 cm in diameter.
hyperthermia applicator research. I – pre-optimised prototypes of
The highest temperatures were concentrated in an ellipse
endocavitary applicators with matching interfaces for prostate
hyperplasia and cancer treatments. Int. J. of Hyperthermia, Volume
with a major axis of 3 cm, ensuring effective localized 27, 2011 – Issue 2. hyperthermia treatment.
[5] DOBSICEK TREFNA, H., TOGNI, P., SHIEE, R., VRBA, J.,
PERSSON, M. Design of a wideband multi-channel system for time POSTER 2025, PRAGUE MAY 22 5
reversal hyperthermia. Int. J. of Hyperthermia. 2012, vol. 28, no. 2, p.
Filip ZAJAN comes from the 185-197.
Czech Republic, born in Nymburk,
[6] DOBSICEK TREFNA, H., VRBA, J., PERSSON, M. Evaluation of a
in 1999. He earned his Bachelor’s
Patch Antenna Applicator for Time Reversal Hyperthermia. Int. J. of
degree in Biomedical Engineering
Hyperthermia. 2010, vol. 26, no. 2, p. 185-197.
at the Technical University of
[7] FRANCONI, C., VRBA, J., MONTECCHIA, F. 27 MHz hybrid Liberec in 2021. In 2023, he
evanescent-mode applicators (HEMA) with flexible heating field for
completed his Master’s degree in
deep and safe subcutaneous hyperthermia. Int. J. of Hyperthermia, Volume 9, 1993 – Issue 5. Medical Electronics and
Bioinformatics, specializing in
[8] DATTA, N., ORDONEZ, S., GAIPL, U., PAULIDES, M., CREZEE, Medical Technology. He is
H., GELLERMAN, J., MARDER, D., PURIC, E., BODIS, S. Local
hyperthermia combined with radiotherapy and/or chemotherapy:
currently a Ph.D. student at the
recent advances and promises for the future. Cancer Treatment Rev. Department of Electromagnetic 2015 Nov;41(9):742-53. Field (CTU), focusing on
[9] HESSINGER, C., KLOS S., KOCHANEK M., JAKOBY, R. microwave hyperthermia.
Numerical optimization of an open-ended coaxial slot applicator for
the detection and microwave ablation of tumors. Biology (Basel). 2021
Kateřina PAVELKOVÁ was
Sep 14;10(9):914. doi: 10.3390/biology10090914. PMID: 34571791; PMCID: PMC8467388.
born in 2000 in Hradec Králové, Czech Republic. She completed
[10] AFAGHI, P., LAPOLLA, M., GHANDI, K. Percutaneous microwave
ablation applications for liver tumors: recommendations for COVID- her Bachelor’s degree in
19 patients. Heliyon. 2021 Mar 6;7(3):e06454. doi: Biomedical Engineering at the
10.1016/j.heliyon.2021.e06454. PMID: 33748501; PMCID: PMC79
Technical University of Liberec in 66996. 2022. She then continued her
[11] KATO, H., ISHIDA, T. Development of an agar phantom adaptable
studies at the Czech Technical
for simulation of various tissues in the range 5-40 MHz. Physics in
University in Prague (CTU), where
Medicine & Biology. 1987 Feb;32(2):221-6. doi: 10.1088/0031-
she earned a Master's degree in 9155/32/2/006. PMID: 3562535. Medical Electronics and
[12] VRBA, D., VRBA, J., FISER, O., CUMANA, J., BABAK, M.,
Bioinformatics in 2024. Currently,
VRBA, J. Senior. Applications of Microwaves in Medicine and she is pursuing a Ph.D. in
Biology. Recent Microwave Technologies. IntechOpen, 2022.
Bioengineering at the same institution. Her research focuses
[13] HUBER+SUHNER. Flexible RF cable RG_178_B/U: Data Sheet
on microwave ablation and electroporation, and she is a
[online]. 2020 [cit. 2022-12-29]. Available from:
https://www.hubersuhner.com/en/documents-repository/data-
member of the EM-Med (Electromagnetic Fields in
sheets/coaxial-cables/rg_178_b_u.pdf.
Medicine and Industry) research team at the Department of Electromagnetic Field.
[14] IT'IS FOUNDATION. Dielectric Properties [online]. [cit. 2022-12-
29]. Available from: https://itis.swiss/virtual-population/tissue-
properties/database/dielectric-properties/.
[15] HOJJATOLLAH, F., PRAKASH, P. Antenna Designs for Microwave
Tissue Ablation. Critical reviews in biomedical engineering, pp. 495- 521, vol. 46, no. 6, 2018.
[16] ZURICH MED TECH. Sim4Life V8.0 Documentation, 2023. About authors…
Michaela NEČASOVÁ was born
in Liberec, Czech Republic, in
1999. She earned her Bachelor's
degree in Biomedical Engineering
from VSB – Technical University
of Ostrava in 2021. In 2023, she
completed her Master's degree in Medical Electronics and Bioinformatics at the Czech
Technical University in Prague
(CTU). She is currently pursuing a
Ph.D. in Bioengineering at the
Faculty of Electrical Engineering,
CTU. Her research group (EM-Med) focuses on the
development of microwave hyperthermia.
