How Does the Frequency of Eating-Alone among Older People in Korea Affect Their Health and Dietary Behavior?
How Does the Frequency of Eating-Alone among Older People in Korea Affect Their Health and Dietary Behavior? Tài liệu được sưu tầm giúp bạn tham khảo, ôn tập và đạt kết quả cao. Mời bạn đọc đón xem.
Môn: Tài liệu Tổng hợp 3.6 K tài liệu
Trường: Tài liệu khác 3.9 K tài liệu
Tác giả:


Preview text:
nutrients Article
How Does the Frequency of Eating-Alone among Older People
in Korea Affect Their Health and Dietary Behavior?
Yongseok Kwon 1,† , Kyung Hee Hong 2,†, Yoo-Kyung Park 3 and Sohye Kim 3,4,* 1
National Institute of Agricultural Sciences, 166 Nongsaengmyeong-ro, Wanju 55365, Republic of Korea 2
Department of Food Science and Nutrition, Dongseo University, Busan 47011, Republic of Korea 3
Department of Medical Nutrition, Graduate School of East-West Medical Science, Kyung Hee University,
Yongin 17104, Republic of Korea 4
Nutrition Care Services, Seoul National University of Bundang Hospital, Seongnam 13620, Republic of Korea *
Correspondence: sohye76@daum.net †
These authors contributed equally to this work.
Abstract: This study examined the relationship between general population characteristics and diet-
related factors pertaining to eating alone for older adults (65 years and older) in Korea. This study
used the Korea National Health and Nutrition Examination Survey (KNHANES), 2016–2020, and the
target population was 7037 Koreans aged 65 years or older who participated in the nutritional survey
and health interview. Eating alone variables were classified as follows. Eating together all day means
“eating together”, eating only one meal a day means “1/day”, eating two meals a day alone means
“2/day”, and “3/day” means eating three meals a day alone. The main results are as follows. The
rate of moderate or severe food insecurity was 3.41% in the “eating together” group to 7.86% in the
“3/day” group, which was 4.45% higher in the “3/day” group. Fruit + vegetable intake among food
intake lowered by about 35 g from 301.2 g in the “eating together” group to 266.2 g in the “3 day”
group. In addition, as a result of analyzing the prevalence of depression using the PHQ-9 score,
the “3/day” group had a 1.775 to 2.464 times higher risk of depression than the “eating together”
group. Finally, EQ-5D variables and quality of life scores were significantly lowered from the “eating
together” group to the “3/day” group. Overall, higher frequency of eating alone was associated with
food safety, essential food intake, and quality of life. Based on these results, it is thought that a dietary
life support program such as the eating together program is necessary to improve the quality of life
of the older people who eat alone.
Citation: Kwon, Y.; Hong, K.H.; Park,
Keywords: eating alone; mental health; old people; Korea National Health and Nutrition Examination
Y.-K.; Kim, S. How Does the Frequency Survey (KHANES)
of Eating-Alone among Older People in
Korea Affect Their Health and Dietary
Behavior? Nutrients 2023, 15, 2085.
https://doi.org/10.3390/nu15092085 1. Introduction Received: 4 March 2023
The number of people who eat alone is increasing in Korea. In the past, Korean culture Revised: 20 April 2023
was characterized as collective, with eating together as a social norm. The eating-alone Accepted: 22 April 2023
habit has emerged as a typical eating pattern in modern Korean society and even a new Published: 26 April 2023
acronym, “Hon-Bab”, has been created to describe it [1–4]. The increase in the age of first
marriage and the prevalence of single-person households due to the aging population
due to a change in the population’s age structure are the main reasons for the increase
in eating alone. This change can be seen as a cultural phenomenon of a modernized
Copyright: © 2023 by the authors.
society emphasizing efficiency, even in how effectively people use break time, or as a social
Licensee MDPI, Basel, Switzerland.
This article is an open access article
structure change toward individualization [5–8]. According to the Statistics Korea report,
distributed under the terms and
single-person households comprised 20.0% of the entire population in 2005, 27.2% in 2015,
conditions of the Creative Commons
and 32.4% in 2021, rapidly increasing over the last 16 years [9]; it mentioned that eating
Attribution (CC BY) license (https://
alone occurs in single-person households or among people in their 20s and 30s. However,
creativecommons.org/licenses/by/
eating alone now is becoming more common in people of all ages and generations, not 4.0/).
just the younger generation [3,4,10]. The disadvantages of eating alone include a lack of
Nutrients 2023, 15, 2085. https://doi.org/10.3390/nu15092085
https://www.mdpi.com/journal/nutrients
Nutrients 2023, 15, 2085 2 of 18
intake of various nutrients and food groups, as fast foods (e.g., ramen, bread, gimbap,
and sandwiches) are generally preferred [11–13]. According to previous research, eating
alone leads to insufficient protein and calcium intake and is associated with an excess
intake of carbohydrates and sodium, leading to nutritional imbalance. The risks associated
with eating alone for obesity, hypertension, and metabolic syndrome are high, increasing
concerns over eating habits, health, and nutrition management [14–16].
It has been reported to cause adverse effects on diet quality and eating habits, par-
ticularly in older people, due to the high frequency of eating alone, low dietary diversity,
high meal-skipping rates, and inadequate consumption of various nutrients and food
categories [17–22]. It was also found that cognitive function was reduced significantly and
nutritional status was poorer for the older adults who ate alone compared to those who
ate together; eating alone was a significant risk factor for high levels of social isolation and
depression symptoms. [17,20,23–28]. Additionally, eating alone was associated with higher
mortality risk and feeling unhappy, resulting in lower quality of life and the increased
likelihood of multiple comorbidities [17,21,29–31]. Based on the results of previous studies
reporting the risk factors associated with eating alone, it seems to affect both physical and mental health negatively.
Previous studies about eating alone conducted in Korea did not focus on older adults.
For example, the topics of these studies were “the comparison of perceptions about eating
alone and eating behaviors between male and female university students”, “the relationship
between nutrient intake and metabolic syndrome for middle-aged adults who eat alone”,
“comparison between eating with family and eating alone in adolescents”, and “the effects
of eating alone or eating together with the family on pediatric mental and physical health.”
Additionally, a study on older individuals that investigated the association between eating
alone and depression in older Korean females did not examine the frequency of eating
alone as an eating behavior in relation to health-related indices [12,32–36]. Thus, the
purpose of this study is to determine the frequency of eating alone among older adults aged
65 years or older [12,32–36]. In addition, we aim to describe the general characteristics of
this population and then identify individual eating habits. Further, we intend to learn how
food and nutrient intake affect depression and quality of life. We hope that the results of this
study, obtained by identifying the relationship between the frequency of eating alone as an
eating pattern and mental health risk factors, will help older adults maintain an appropriate
diet and manage their health status in preparation for the hyper-aging population. 2. Materials and Methods 2.1. Research Data
This study was a sub-study of the Korea National Health and Nutrition Examination
Survey (KNHANES) conducted in 2016 and 2020. The KNHANES administered by the
Korean Ministry of Health and Welfare and a stratified multistage probability design were
used with subject selection from sampling units and using household registries. KNHANES
is a nationwide, population-based, cross-sectional study aimed at the health and nutrition
status of the noninstitutionalized civilian Korean population. In addition, it provides basic
data for health policies such as improvement of people’s nutrition, disease prevention,
and development of health promotion programs [37]. The KNHANES consists of health
interviews, health examinations, and nutritional surveys, among which the nutritional
survey aims to understand the food and nutritional intake and dietary habits of Koreans.
In this study, a 24-h recall method was used as a nutrition survey. Food and nutrient
intake and dietary behavior were investigated and smoking, alcohol consumption, exercise,
mental health, and life quality were examined in a health survey [37]. 2.2. Subjects
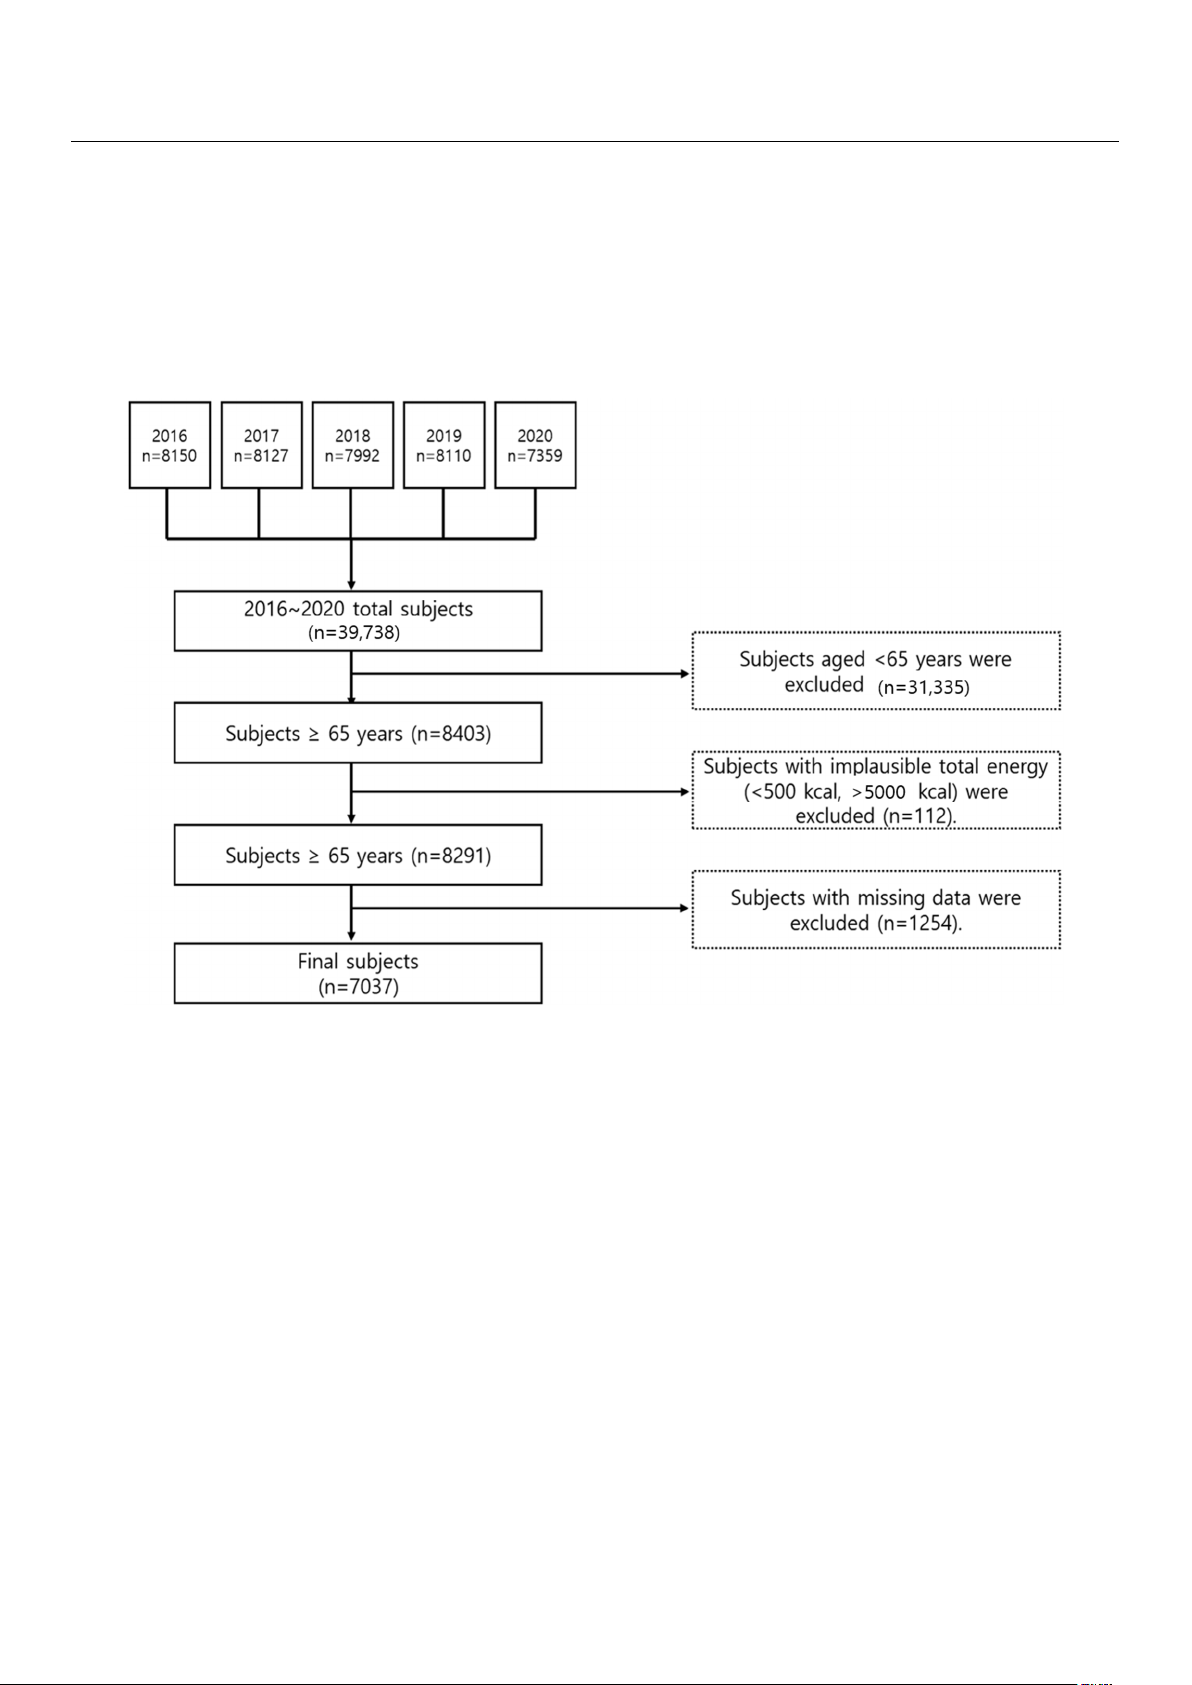
This study selected older people over 65 years old who participated in the nutritional
survey and health interview of the KNHANES 2016–2020. Some of the subjects who
consumed less than 500 kcal or more than 5000 kcal (112 people) were excluded. Outlier
Nutrients 2023, 15, x FOR PEER REVIEW 3 of 18
In this study, a 24-h recall method was used as a nutrition survey. Food and nutrient
intake and dietary behavior were investigated and smoking, alcohol consumption, exer-
cise, mental health, and life quality were examined in a health survey [37]. 2.2. Subjects
Nutrients 2023, 15, 2085 3 of 18
This study selected older people over 65 years old who participated in the nutritional
survey and health interview of the KNHANES 2016–2020. Some of the subjects who con-
sumed less than 500 kcal or more than 5000 kcal (112 people) were excluded. Outlier data
data on subjects who did not participate in the dietary survey (24-h recall survey) were also
on subjects who did not participate in the dietary survey (24-h recall survey) were also ex-
excluded (1254 people). A total of 7037 people were selected in the study (Figure 1). The
cluded (1254 people). A total of 7037 people were selected in the study (Figure 1). The
KNHANES data used in this study were approved by the KCDA (Korea Disease Control
KNHANES data used in this study were approved by the KCDA (Korea Disease Control
and Prevention Agency) Institutional Review Board (IRB approval numbers: 2018-01-03-
and Prevention Agency) Institutional Review Board (IRB approval numbers: 2018-01-03-P-
P-A, 2018-01-03-C-A, and 2018-01-03-2C-A). Among these, the 2016 and 2017 KNHANES
A, 2018-01-03-C-A, and 2018-01-03-2C-A). Among these, the 2016 and 2017 KNHANES were
were exempt from review regarding research ethics based on the Bioethics and Safety Act
exempt from review regarding research ethics based on the Bioethics and Safety Act from from 2015 to 2017 [38]. 2015 to 2017 [38].
Figure 1. The flowchart for subject samples of this study.
Figure 1. The flowchart for subject samples of this study. 2.3. Meal 2.3. Meal Pattern Accor Pattern ding to According to the Freque the Fr ncy of E equency of ating Eating Alone Alone In this In this study, we used study, we used the v the ariables recor variables r ded in ecorded in the “24-h recall the “24-h recall to m to easure measure the eating the eating alone variable.” F alone variable.” irst, resp First, r ondents espondents who who consume consumed d m mor o e re than than two two dai daily ly m mealseals wer were e tar tar- geted. geted The . The va variables riables “m “meals ea with ls with other other p people” eople” (v (variable ariab name:le name: N_m N_meal_w) eal and _w) and “num “number of ber meals” of meals” (v (variable aria name: ble name: N_meal) N_ wer mea e l) were used. used. “Eating “Eating to together gr geth
oup” er group” consisted of peo- consisted of people who had ple who h all daily ad all daily me meals—namely brals—na eakfast,mely break lunch, and fast, lunch, an dinner—with d din their ner—with family their members orfamily others members thr or ot oughout hers t the day; hroughout “1/day the eating day; alone “1 gr /day eatin oup” for g alone gro those who u ate p” for alone those only who ate once a day; alone only on “2/day ce a day; eating alone gr “2/day oup” e for ating those alone gro who ate up” for tho alone twice s a e who day, ate and alone “3/day twice a d eating ay, alone and “ gr 3/d oup” ay for eating a those lone who g ate roup” alone for thos thrice a e who ate day. alone thrice a day. 2.4. General Characteristics
General characteristics of the subjects, such as gender, age, residential area, marital
status, household number, education level, household income, and job status were an-
alyzed. Among these characteristics, marital status was classified as single or married,
residential area was classified as urban or rural area, and household number was classified
as “1 person”, “2 people”, “3 people”, “4 people”, “5 people” and “over 6 people”. The
education levels were classified as “Middle school or less”, “High school or less” and
“College or more”. Household income level was classified using the household income
level variables in KNHANES and job status was classified as employed or unemployed.
Nutrients 2023, 15, 2085 4 of 18
2.5. Health Related Characteristics
For health behavior, smoking, drinking, stress, exercise, and obesity status were
analyzed. Obese status was classified as underweight (BMI < 18.5 kg/m2), normal
(18.5 kg/m2 ≤ BMI < 23.0 kg/m2), overweight (23.0 kg/m2 ≤ BMI < 25.0 kg/m2), and obese (BMI ≥ 25 kg/m2). 2.6. Dietary Behavior
Dietary behaviors were analyzed for snack consumption, food security, and eating-out
frequency. For snack intake, using the meal-related variables in the 24-h recall data, those
who chose snacks were classified as “yes” and those who did not were classified as “no”.
Food security was determined by using variables of dietary life and classified by referring to previous studies [39,40]. 2.7. Food and Nutrient Intake
Food intake was categorized into 17 food groups using food classification codes and
food intake in the food (24-h recall) data; individual intake was obtained for each survey
subject. In addition, energy, carbohydrate, protein, fat, Ca, P, Fe, Na, K, vitamin A, carotene,
retinol, thiamine, riboflavin, niacin, and vitamin C intake and contribution ratios were
calculated using the daily intake for each nutrient. 2.8. PHQ-9
The Patient Health Questionnaire-9 (PHQ-9) was used in the National Health and
Nutrition Examination Survey to measure depression and the questionnaire consisted of
nine items. For each question, subjects were instructed to choose one of: “none” (0 points),
“several days” (1 point)”, “more than a week” (2 points), or “almost every day” (3 points)
and score all of the corresponding questions. The total score was calculated by adding
them up. A higher PHQ-9 score means more depressive symptoms. 2.9. EQ-5D
Quality of life was measured using the Euro Quality of Life five-dimension (EQ-5D)
tool. EQ-5D is a five-item measurement tool that can be easily used to determine the level
of physical health, mental health, and social health. The items are composed of motor
ability, self-management, daily activities, pain/inconvenience, and anxiety/depression
and are evaluated as “no problem”, “some problem”, and “severe problem”, respectively.
The score is calculated by applying a weight to each item value and the value range is 162
between −1 point and 1 point, and the lower the score, the lower the quality of life [36]. 2.10. Statistical Analysis
The KNHANES data was obtained by stratified multi-stage sampling rather than a
simple random sampling method. The collected data were analyzed with a consideration
of weight, strata variable (KSTRATA), and cluster variable (Primary Sampling Unit, PSU).
Among them, general matters, dietary factors, and categorical variables such as health-
related factors, frequency analysis (frequency analysis) was performed to determine the
frequency (n) and the weighted percentage (weighted %) and the significance test was
a chi-square test. For qualitative variables, descriptive analysis was performed and the
mean and standard error were expressed. For the significance test of these continuous
variables, the p for trend value was obtained using the SURVEYREG procedure. Among
them, in the case of nutrients and food intake, the adjusted p for trend value was obtained
by correcting for age and energy intake. In addition, multiple logistic regression analysis
was conducted to analyze the relationship between the prevalence of eating alone and
the prevalence of depression. Multiple regression analysis was conducted to determine
whether the prevalence of eating alone was related to quality of life. All statistical analyzes
were performed using the SAS ver. 9.4 package (SAS Institute, Cary, NC, USA), and the
significance level was set at α = 0.05.
Nutrients 2023, 15, 2085 5 of 18 3. Results
3.1. General Characteristics
Table 1 presents the general characteristics of the target population. According to the
results of the 24-h recall survey, the proportion of males was higher than that of females in
the “eating together” group, while the proportions of females were higher in the “1/day
eating alone”, “2/day eating alone”, and “3/day eating alone” groups (p < 0.0001). The
proportion of females and the mean age increased in proportion to the frequency of eating
alone. The mean ages for the “eating together” group and the “3/day eating alone” group
were 72.82 and 74.19 years old, respectively (p < 0.0001). Regarding the area of residence,
more subjects in the “3/day eating alone” group lived in “urban” rather than “rural” areas,
compared to those in the “eating together” group (p < 0.0001). The “household number” of
subjects, which is the proportion of families consisting of two members, was the highest in
the “eating together” and “1/day eating alone” groups. In contrast, the proportions of the
families consisting of one and two members were similar to each other in the “2/day eating
alone” group and that of one member was the highest (55.06%) in the “2/day eating alone”
group (p < 0.0001). Regarding education level, “middle school or less” was the highest and
the higher the frequency of eating alone, the lower the level of education. As for household
income, the proportion of “low” was high in the “3/day eating alone” group and for “job
status”, the proportion of “3/day eating alone” was higher in the “unemployed” group
than in the “employed” group (p < 0.05).
Table 1. General characteristics according to the frequency of eating alone. Eating Alone Eating Together 1/Day 2/Day 3/Day (3) n = 3060 Variables n = 1574 n = 1394 n = 1009 p-Value (2) (42.37%) (23.58%) (20.10%) (13.95%) n % (1) n % n % (1) n % Gender Male 1519 52.03 686 45.48 473 36.50 357 38.53 <0.0001 Female 1541 47.97 888 54.52 921 63.50 652 61.47 Age 65–74 1844 60.54 1006 64.92 757 56.30 476 49.70 <0.0001 ≥75 1216 39.46 568 35.07 637 43.69 533 50.30 Average (Mean, SE) 72.82 a 0.12 72.32 b 0.16 73.28 a 0.16 74.19 c 0.18 <0.0001 (3) Region Urban 2075 73.51 1206 81.19 1046 80.90 740 78.75 <0.0001 Rural area 985 26.49 368 18.81 348 19.10 269 21.25 Marital status Married 3035 99.80 1568 99.77 1373 98.46 995 98.78 <0.0001 Single 5 0.2 6 0.23 21 1.54 14 1.22 Household number 1 112 2.85 255 11.92 656 36.44 662 55.06 2 2145 65.10 871 51.63 477 36.18 214 25.30 3 476 18.26 251 20.08 150 16.12 73 11.22 <0.0001 4 155 6.43 98 7.79 53 5.72 28 3.97 5 103 4.16 62 5.95 40 3.93 22 3.47 ≥6 69 3.19 37 2.64 18 1.62 10 0.98 Education level Middle school or less 1925 64.60 953 63.23 917 69.45 702 75.93 <0.0001 High school or less 561 20.98 289 21.71 216 18.92 136 16.88 College or more 358 14.42 190 15.05 134 11.63 62 7.18
Nutrients 2023, 15, 2085 6 of 18 Table 1. Cont. Eating Alone Eating Together 1/Day 2/Day 3/Day (3) n = 3060 Variables n = 1574 n = 1394 n = 1009 p-Value (2) (42.37%) (23.58%) (20.10%) (13.95%) n % (1) n % n % (1) n % Household income Low 1306 40.99 603 36.79 744 50.58 665 60.10 Middle-low 933 30.26 494 29.99 339 23.39 195 23.21 <0.0001 Middle-high 492 17.11 280 19.26 180 15.69 100 11.32 High 319 11.63 187 13.95 122 10.33 42 5.37 Job status Employed 1018 33.47 521 36.15 384 30.43 273 30.32 0.0274 Unemployed 1829 66.52 911 63.85 883 69.57 629 69.68
(1) Weighted %. (2) p-value by chi-square test. (3) p-value by one-way ANOVA. a–c Different superscript letters
mean “significantly different” among groups at α = 0.05 level by Tukey’s multiple range comparison.
3.2. Meal Pattern According to the Frequency of Eating Alone
Table 2 shows meal patterns according to the frequency of eating alone. Significant
differences were found in all results (p < 0.001). Of all subjects aged 65 or older, 42.37%
ate all three meals daily with other people. The higher the frequency of eating alone, the
lower the proportion of subjects: 23.58% for “1/day eating alone”, 20.10% for “2/day
eating alone”, and 13.95% for “3/day eating alone.” Most in the “eating together group”
were found to eat with “family” and “family and other people.” In the “1/day eating
alone” group, the “family + alone” rate was the highest; in the “2/day eating alone” group,
“only alone” was 24.92%, “family + alone” was 39.31%, and “other people + alone” was
35.77%. The results from analyzing eating alone during the day in the “1/day eating alone”
group “Breakfast (B)” was 40.28%, “Lunch (L)” was 38.99%, and “Dinner (D)” was 20.73%,
demonstrating that eating alone was higher for breakfast and lunch than dinner. In the
“2/day eating alone” group, the “B + D” rate was the highest (47.23%), followed by “B +
L” (33.30%), and “L + D” was the least (19.47%), showing that eating alone was the most
frequent for breakfast. For “Cooking place for a solo meal”, for all of the “1/day eating
alone”, “2/day eating alone”, and “3/day eating alone” groups, “only home (H)” was the
most frequent, followed by “home + commercial (H + C)”, showing that older adults tend
to prepare food at home to eat alone.
Table 2. Consumption pattern according to the frequency of eating alone. Eating Alone Eating Together 1/Day 2/Day 3/Day Variables n = 3060 n = 1574 n = 1394 n = 1009 n % (1) n % n % n %
Eating partner among daily meal Everything-alone - - - - 349 24.92 1009 100.00 Family 2251 73.77 - - - - - - Family + alone - - 982 62.9 514 39.31 - - Other people 69 2.19 - - - - - - Other people + alone - - 289 17.7 531 35.77 - - Family + other people 740 24.0 - - - - - - Family + other people + - - 303 19.37 - - - - alone
Nutrients 2023, 15, 2085 7 of 18 Table 2. Cont. Eating Alone Eating Together 1/Day 2/Day 3/Day Variables n = 3060 n = 1574 n = 1394 n = 1009 n % (1) n % n % n % Alone meal in daily meal Breakfast (2) - - 628 40.28 - - - - Lunch (3) - - 611 38.99 - - - - Dinner - - 335 20.73 - - - - B (3) + L (4) - - - - 431 33.30 - - B + D (4) - - - - 628 47.23 - - L + D - - - - 262 19.47 - - B + L + D - - - - - - 1009 100.00 Cooking place of solo meal Only home - - 1190 74.30 979 69.06 690 65.82 Only commercial - - 374 25.18 85 5.98 23 2.01 Only institution - - 10 0.53 3 0.24 5 0.48 H (5) + C (6) - - - - 318 24.05 282 30.86 H + I (7) - - - - 6 0.34 3 0.23 C + I - - - - 3 0.33 3 0.30 H + C + I - - - - - - 3 0.29
(1) Weighted %, (2) B: Breakfast, (3) L: Lunch, (4) D: Dinner, (5) H: Home, (6) C: Commercial place, (7) I: Institution.
3.3. Health-Related Characteristics According to the Frequency of Eating Alone
Table 3 presents the subjects’ health-related factors. The proportion of “non-smokers”
was the highest in all groups (p < 0.0001), whereas drinking “<1/year” had the highest
proportion (p < 0.0001). Additionally, the higher the frequency of eating alone, the lower
the frequency of drinking. For stress, the subjects who reported a relatively higher number
of meals eaten alone were likely to answer “feel it very much” (p < 0.0001). However, there
was no significant difference between the exercise group and the obese group.
Table 3. Health-related characteristics according to consumption frequency of eating alone. Eating Eating Alone Together 1/Day 2/Day 3/Day Variables n = 3060 p-Value (2) n = 1574 n = 1394 n = 1009 n % (1) n % n % n % Smoking status Current smoker 253 9.2 135 9.1 150 11.8 80 8.2 <0.0001 Ex-smoker 990 33.7 450 30.0 304 23.6 234 25.5 Non-smoker 1777 57.2 960 61.0 910 64.6 673 66.3 Drinking status <1/year 1911 61.9 992 62.8 956 68.6 706 70.5 1–4/month 595 20.6 296 19.5 224 17.4 146 14.6 0.0005 2–3/week 269 9.4 150 10.1 103 7.3 67 7.8 ≥4/week 248 8.2 109 7.6 84 6.7 67 7.1 Stress status Feel it very much 99 2.9 48 2.3 62 4.2 42 4.8 Feel it somewhat 406 13.1 219 13.3 208 15.6 169 17.9 <0.0001 Feel it a little 1628 55.4 860 57.6 637 47.7 433 45.1 Feel it rarely 882 28.6 420 26.8 453 32.5 338 32.2
Nutrients 2023, 15, 2085 8 of 18 Table 3. Cont. Eating Eating Alone Together 1/Day 2/Day 3/Day Variables n = 3060 p-Value (2) n = 1574 n = 1394 n = 1009 n % (1) n % n % n % Exercise <1/week 2310 79.3 1135 78.3 1058 81.5 751 81.3 1–2/week 104 3.9 52 3.7 39 3.5 30 3.8 0.5960 3–4/week 145 5.4 74 5.4 58 4.6 46 5.8 ≥5/week 291 11.4 175 12.6 113 10.4 76 9.1 Obesity status
Underweight (BMI < 18.5 kg/m2) 75 2.5 54 3.6 47 3.4 30 3.7
Normal (18.5 kg/m2 ≤ BMI < 0.2358 1058 36.1 508 31.9 459 33.7 350 36.3 23.0 kg/m2)
Overweight (23.0 kg/m2 ≤ BMI < 794 25.7 403 27.4 348 25.5 247 26.3 25.0 kg/m2) Obesity (BMI ≥ 25.0 kg/m2) 1092 35.7 590 37.1 516 37.3 354 33.7
(1) Weighted %, (2) p-value by chi-square test.
3.4. Dietary Behavior According to the Frequency of Eating Alone
Table 4 presents the subjects’ dietary behavior based on the frequency of eating alone.
Snack intake rate was lower when eating alone more frequently (p < 0.01). In the “food
security” variable, the ratio of “Enough food—secure” decreased as the frequency of eating
alone increased. In the “eating together” and “1/day eating alone” groups, the proportion
of “enough food—secure” was high, measured by “all of our family could eat enough
food and a variety of foods as much as they wanted.” In contrast, in the “2/day eating
alone” and “3/day eating alone” groups, the mild food insecurity rate was high, measured
by “all of our family could eat enough food but could not eat various kinds of food.”
Regarding eating out, a higher frequency of eating alone was associated with eating out
more frequently. The “3/day eating alone” group showed the highest proportion of rarely eating out (p < 0.0001).
Table 4. Dietary behavior according to consumption frequency of eating alone. Eating Eating Alone Together 1/Day 2/Day 3/Day Variables n = 3060 p-Value (2) n = 1574 n = 1394 n = 1009 n % (1) n % n % n % Snack consumption Yes 2794 91.63 1443 91.98 1251 89.73 876 86.72 0.0003 No 266 8.36 131 8.02 143 10.27 133 13.28 Food security Enough food—secure 1628 53.34 784 50.63 594 44.39 412 43.74 Mildly food insecure 1330 43.24 711 45.04 681 48.31 503 48.40 <0.0001 Moderately food insecure 86 2.66 71 3.73 99 6.19 69 5.69 Severely food insecure 15 0.75 8 0.60 18 1.12 21 2.17 Eating-out Frequency ≥2/day 32 1.02 24 1.46 13 1.11 10 1.09 1/day 94 3.68 74 5.43 40 3.05 18 1.93 5–6/week 188 6.32 129 8.22 106 7.79 27 2.62 <0.0001 3–4/week 232 7.79 144 9.23 97 7.25 44 4.33 1–2/week 765 25.53 416 26.08 352 25.39 239 23.43 <1/week 1064 33.64 494 31.80 429 30.25 323 31.69 seldom 685 22.02 293 17.79 357 25.17 347 34.90
(1) Weighted %, (2) p-value by chi-square.
Nutrients 2023, 15, 2085 9 of 18
3.5. Food Intake in Their Meal According to Consumption Frequency of Eating Alone
Table 5 presents the results from analyzing the subject’s food intake depending on
the frequency of eating alone. The results show that the higher the frequency of eating
alone, the lower the intake of “total food”, “Fruit”, “Meat, poultry, and their products”,
and “Fish and shellfish”, and the greater the intake of “cereal and grain products” and
“legumes and their products.” When adjusted for age, gender, and energy intake, the intake
of “total food”, “vegetables”, “fruit”, “meat, poultry, and their products”, “seaweed”, and
“seasonings” was significantly reduced (adjusted p for trend < 0.05).
Table 5. Food intake in their meal according to consumption frequency of eating alone. Eating Alone Eating Together Unadjusted Adjusted 1/Day 2/Day 3/Day g/Day n = 3060 p for p for n = 1574 n = 1394 n = 1009 Trend (1) Trend (2) Mean SE Mean SE Mean SE Mean SE Total food 1315.7 17.8 1298.4 19.7 1160.2 20.7 1178.0 26.5 <0.0001(−) <0.0866(−) Cereals and grain products 158.9 5.5 161.0 6.0 142.7 4.9 156.1 6.7 <0.0010(+) 0.0987(+) Potatoes and starches 20.5 1.6 28.5 3.4 20.8 2.4 18.6 2.4 0.0967(−) 0.0511(−) Sugars and sweets 3.4 0.2 3.4 0.4 2.7 0.2 2.9 0.3 0.0785(−) 0.0847(+) Legumes and their 22.4 1.3 28.5 2.7 22.1 1.7 30.0 3.2 0.0450(+) 0.0994(+) products Seeds and nuts 4.1 0.4 4.4 0.5 4.3 0.8 4.4 0.9 0.0724(+) 0.0882(+) Vegetables 188.2 6.8 180.0 7.2 152.1 6.8 166.3 9.2 0.0620(−) 0.0477(−) Mushrooms 2.8 0.3 2.4 0.4 1.2 0.2 1.5 0.4 0.0672(−) 0.0994(−) Fruit 113.0 6.3 124.2 7.2 98.0 6.5 99.9 8.8 0.0315(−) 0.0351(−) Meat, poultry, and their 35.2 2.2 34.0 2.3 30.7 2.9 25.7 2.9 0.0129(−) 0.0022(−) products Eggs 10.8 0.7 11.0 0.9 8.8 0.8 9.2 1.0 0.01675(−) 0.0884(−) Fish and shellfish 60.0 3.6 58.8 3.9 45.8 3.5 42.9 5.6 0.0453(−) 0.0729(−) Seaweed 18.3 1.8 21.6 2.6 13.9 1.8 14.3 3.7 0.0675(−) 0.0324(−) Milks and dairy products 30.7 2.0 34.0 2.9 38.3 3.4 39.2 3.9 0.0612(+) 0.0667(+) Oils and fats 2.3 0.1 2.2 0.1 1.8 0.2 1.7 0.2 0.0887(−) 0.2187(+) Beverages 62.1 4.3 72.5 5.8 52.1 5.2 35.3 4.9 0.0665(−) 0.3664(−) Seasonings 16.6 0.7 15.7 0.7 12.9 0.6 12.9 0.9 0.0998(−) 0.0111(−) Other food 3.1 0.5 3.8 0.8 3.8 0.8 5.0 1.3 0.0679(+) 0.0775(−)
(1) p for trend was calculated by the SURVEYREG procedure in SAS. (2) Adjusted for gender, age, and energy intake.
3.6. Nutrient Intake Depending on the Consumption Frequency of Eating Alone
Table 6 presents the results of analyzing the subjects’ nutrient intake. After adjusting
for gender, age, and energy intake (adjusted p for trend < 0.0001), the higher the frequency
of eating alone, the lower the intake of protein, sodium, potassium, vitamin A, carotene,
and niacin. Additionally, the rate of carbohydrate intake increased as the number of people
eating alone increased, while the intake of protein and fat was significantly reduced.
Table 6. Nutrient intake according to consumption frequency of eating alone. Eating Eating alone Together Unadjusted Adjusted 1/Day 2/Day 3/Day g/Day n = 3060 p for p for n = 1574 n = 1394 n = 1009 Trend (1) Trend (2) Mean SE Mean SE Mean SE Mean SE Energy (kcal) 1682.7 16.7 1653.9 21.5 1517.4 20.2 1576.5 22.5 <0.0001(−) 0.5353(+) Carbohydrates (g) 285.0 2.5 279.8 3.8 261.3 3.2 277.3 3.7 <0.0001(−) 0.0657(+) Protein (g) 58.0 0.8 56.0 0.9 50.3 0.9 51.3 1.0 <0.0001(−) <0.0001(−) Fat (g) 29.3 0.7 28.3 0.6 26.0 0.7 25.6 0.8 <0.0001(−) 0.2612(+)
Nutrients 2023, 15, 2085 10 of 18 Table 6. Cont. Eating Eating alone Together Unadjusted Adjusted 1/Day 2/Day 3/Day g/Day n = 3060 p for p for n = 1574 n = 1394 n = 1009 Trend (1) Trend (2) Mean SE Mean SE Mean SE Mean SE Calcium (mg) 464.8 7.8 457.8 9.5 426.8 9.4 434.5 10.7 0.0006(−) 0.8470(+) Phosphorus (mg) 935.5 11.4 905.1 12.9 829.4 13.2 861.8 15.7 <0.0001(−) 0.1460(−) Iron (mg) 11.3 0.2 11.0 0.2 10.0 0.2 10.2 0.2 <0.0001(−) 0.0550(−) Sodium (mg) 3012.0 43.7 2815.0 51.0 2606.4 53.8 2678.5 74.1 <0.0001(−) 0.0316(−) Potassium (mg) 2729.3 35.5 2633.1 43.4 2409.1 42.9 2441.2 51.2 <0.0001(−) 0.0012(−) Vitamin A (µg RE) 350.2 15.0 293.5 7.2 286.6 9.8 265.1 10.1 <0.0001(−) 0.0003(−) Carotene (µg) 2914.8 81.6 2558.2 73.4 2434.9 93.9 2255.5 95.4 <0.0001(−) <0.0001(−) Retinol (µg) 1.2 0.0 1.1 0.0 1.1 0.0 1.1 0.0 0.0327(−) 0.1363(−) Thiamine (mg) 107.2 12.4 80.2 3.5 83.6 5.0 77.1 5.0 <0.0001(−) 0.8884(−) Riboflavin (mg) 1.3 0.0 1.2 0.0 1.1 0.0 1.1 0.0 <0.0001(−) 0.1725(−) Niacin (mg) 10.8 0.2 10.4 0.2 9.4 0.2 9.5 0.2 <0.0001(−) 0.0032(−) Vitamin C (mg) 59.9 1.7 59.2 2.1 56.7 2.4 52.7 2.3 0.0158(−) 0.3947(−) Energy Contribution (%, SE) Carbohydrates 71.4 0.3 71.6 0.3 72.3 0.3 73.2 0.4 <0.0001(+) 0.0055(+) Protein 13.7 0.1 13.5 0.1 13.1 0.1 12.9 0.1 <0.0001(−) <0.0001(−) Fat 14.9 0.2 14.9 0.2 14.6 0.3 13.9 0.3 0.0100(−) 0.0233(−)
(1) p for trend was calculated by the SURVEYREG procedure in SAS. (2) Adjusted for gender, age, and energy intake.
3.7. Depression-Related Survey Results
Table 7 presents the results of evaluating the subject’s depression using PHQ-9. The
total scores for the “3/day eating alone”, “2/day eating alone”, “1/day eating alone”, and
“eating together” groups were 2.40, 2.06, 1.80, and 1.56, respectively, indicating that the
more frequently people ate alone, the more depressed they felt. Looking at the prevalence
of depression against the frequency of eating alone, the numbers for the “3/day eating
alone”, “2/day eating alone”, “1/day eating alone”, and “eating together” groups were
6.16%, 3.89%, 3.35%, and 2.70%, respectively, indicating that a higher frequency of eating
alone was linked to a higher prevalence of depression.
Table 7. Prevalence and mean score regarding item of Patient Health Questionnaire according to
consumption frequency of eating alone. Eating Eating Alone Together 1/Day 2/Day 3/Day
Patient Health Questionnaire (1) n = 3060 n = 1574 n = 1394 n = 1009 Mean SE Mean SE Mean SE Mean SE 1.
Little interest or pleasure in doing things 0.24 0.02 0.19 0.02 0.27 0.03 0.32 0.04 2.
Feeling down, depressed, or hopeless 0.18 0.02 0.24 0.03 0.29 0.03 0.35 0.05 3.
Trouble falling or staying asleep, or 0.55 0.03 0.58 0.04 0.67 0.05 0.71 0.06 sleeping too much 4.
Feeling tired or having little energy 0.52 0.03 0.51 0.04 0.57 0.05 0.62 0.05 5. Poor appetite or overeating 0.20 0.02 0.19 0.03 0.29 0.03 0.33 0.04 6.
Feeling bad about yourself—or that you
are a failure or have let yourself or your 0.12 0.01 0.14 0.02 0.21 0.03 0.25 0.04 family down
Nutrients 2023, 15, 2085 11 of 18 Table 7. Cont. Eating Eating Alone Together 1/Day 2/Day 3/Day
Patient Health Questionnaire (1) n = 3060 n = 1574 n = 1394 n = 1009 Mean SE Mean SE Mean SE Mean SE 7.
Trouble concentrating on things, such as
reading the newspaper or watching 0.11 0.01 0.13 0.02 0.14 0.02 0.16 0.03 television 8.
Moving or speaking so slowly that other
people could have noticed? Or the
opposite, being so fidgety or restless that 0.09 0.01 0.10 0.02 0.10 0.02 0.11 0.02
you have been moving around a lot more than usual 9.
Thoughts that you would be better off 0.12 0.02 0.09 0.02 0.19 0.03 0.20 0.03
dead or of hurting yourself in some way Total score 1.56 0.09 1.80 0.14 2.06 0.15 2.40 0.23
Prevalence of depression (n, weighted %) Non-depression (<10) (2) 1726 97.30 867 96.65 755 96.11 568 93.84 Depression (≥10) (3) 64 2.70 30 3.35 38 3.89 40 6.16
(1) Q. 1–9. Score (0: Not at all, 1: Several days 2: A week or higher, 3: Everyday). (2) Total score of Patient Health
Questionnaire (PHQ)-9 < 10, (3) Total score of PHQ-9 ≥ 10.
3.8. Association between the Prevalence of Depression and the Frequency of Eating Alone
The results of the logistic regression analysis to identify the relationship between
the frequency of eating alone and depression are provided in Table 8. Using the “eating
together” group as a reference, the unadjusted Model 1 revealed a trend of increasing
prevalence of depression as the frequency of eating alone increased (p for trend d < 0.0001).
Model 2, adjusted for gender, age, and energy intake, showed a significant increase in the
prevalence of depression regardless of gender, age, or energy intake (p for trend < 0.01).
However, statistical significance did not exist in Model 3, which was adjusted additionally
for exercise, alcohol consumption, stress status, smoking, and obesity status. Model
4 was adjusted for food security, snacking, the frequency of eating out in a week, the
frequency of having breakfast in a week, marital status, occupation, education level, and household income.
Table 8. Relationship between daily consumption of eating alone and prevalence of depression. Eating Together 1/Day 2/Day 3/Day p for Trend Prevalence of depression Model 1 1 (1) 1.410 (0.613–1.936) (2) 1.437 (0.898–2.297) 2.464 (1.527–3.975) 0.0001 (+) Model 2 1 1.093 (0.647–1.847) 1.982 (0.742–1.882) 2.152 (1.302–3.555) 0.0010 (+) Model 3 1 1.253 (0.716–2.193) 0.942 (0.553–1.604) 1.775 (1.012–3110) 0.1286 (+) Model 4 1 1.103 (0.613–1.985) 0.938 (0.543–1.622) 1.573 (0.871–2.838) 0.4364 (+)
(1) Reference, (2) Odd ratio (95% Confidence Interval). Model 1: Unadjusted. Model 2: Adjusted for gender, age,
and energy intake. Model 3: Adjusted for gender, age, family size, energy intake, exercise, alcohol consumption,
stress status, smoking, and obese status. Model 4: Adjusted for gender, age, family size, energy intake, exercise,
alcohol consumption, stress status, smoking, obese status, food security, snack, eating-out frequency per week,
breakfast frequency per week, marital status, occupation, education level, and household income.
3.9. Quality of Life Survey Results
Table 9 shows the results of using EQ-5D to examine the subjects’ quality of life. The quality
of life in the “3/day eating alone” group was significantly lower than the “eating together”,
“1/day eating alone”, and “2/day eating alone” groups in all of the “mobility” (p < 0.001),
“self-management” (p < 0.05), “daily activities” (p < 0.0001), “pain/inconvenience” (p < 0.05),
and “anxiety/depression” (p < 0.01) items.
Nutrients 2023, 15, 2085 12 of 18
Table 9. Ratio of item of quality of life according to consumption frequency of eating alone. Eating Eating Alone Together 1/Day 2/Day 3/Day Variables p-Value n = 3060 n = 1574 n = 1394 n = 1009 n % n % n % n % Mobility M1. No problems 1838 60.75 966 62.23 781 58.12 475 48.30 M2. Some/moderate <0.0001 986 30.23 461 27.87 467 31.22 409 39.80 problems M3. Extreme problems 36 0.96 14 0.66 29 1.70 24 1.99 Non-respondence 200 8.06 133 9.24 117 8.97 100 9.91 Self-management SM1. No problems 2583 83.68 1312 83.33 1124 81.05 791 79.21 SM2. Some/moderate 0.0413 251 7.52 117 6.52 145 9.52 110 10.32 problems SM3. Extreme problems 26 0.74 11 0.84 9 0.52 7 0.56 Non-respondence 200 8.06 134 9.31 116 8.91 100 9.91 Daily activities DA1. No problems 2332 76.21 1217 77.74 996 72.72 678 68.95 DA2. Some/moderate 0.0002 487 14.59 211 12.42 258 16.85 216 19.78 problems DA3. Extreme problems 41 1.14 13 0.59 24 1.51 13 1.32 Non-respondence 200 8.06 133 9.24 116 8.91 101 9.95 Pain/Inconvenience PI1. No problems 1849 61.09 956 60.84 780 57.93 535 53.70 PI2. Some/moderate 0.0392 874 26.58 412 25.73 407 27.75 308 30.28 problems PI3. Extreme problems 133 4.13 72 4.12 91 5.41 63 5.95 Non-respondence 204 8.20 134 9.31 116 8.91 102 10.06 Anxiety/Depression AD1. No problems 2477 80.01 1260 80.21 1065 76.11 727 73.04 AD2. Some/moderate 0.001 352 10.81 168 9.88 180 13.06 159 15.46 problems AD3. Extreme problems 28 1.03 13 0.66 29 1.58 20 1.54 Non-respondence 203 8.14 133 9.24 120 9.25 102 9.96 EQ-5D (1) index (2) 0.82 a 0.008 0.821 a 0.011 0.800 ab 0.010 0.773 b 0.012 <0.0001 (Mean, SE)
(1) EQ-5D: Euro Quality of Life-5 Dimension. (2) EQ-5D index = 0.05 + 0.096(M2) + 0.418(M3) + 0.046(SM2) +
0.136(SM3) + 0.051(DA2) + 0.208(DA3) + 0.037(PI2) + 0.151(PI3)+ 0.043(AD2) + 0.158(AD3) + 0.05(N3: The case
given at least two points or more in more than one item). a,b different superscript letters mean significantly
different among groups at the α = 0.05 level by Tukey’s multiple range comparison.
3.10. Relationship between the Frequency of Eating Alone and Quality of Life
Table 10 presents the results of the relationship between the frequency of eating alone
and quality of life. Using the “eating together” group as a reference, the unadjusted
Model 1 showed significantly decreasing quality of life as the frequency of eating alone
increased. In Models 2 and 3, with stepwise adjustment for age, gender, energy intake,
family size, exercise, alcohol consumption, stress status, smoking, obesity status, food
security, snacking, and the frequency of eating out per week, quality of life tended to
decrease as the frequency of eating alone increased (p for trend < 0.05). In contrast, no
significant difference was found in Model 4, which was adjusted additionally for food
security, snacking, eating out frequency per week, marital status, occupation, education level, and household income.
Nutrients 2023, 15, 2085 13 of 18
Table 10. Relationship between daily consumption of eating alone and quality of life. Eating Together 1/Day 2/Day 3/Day p for Trend
Dependent Variable: Quality of Life Model 1 0 (1) 0.0077 (−0.0019~0.0174) (2)
−0.0152 (−0.0269~−0.0037)
−0.0347 (−0.0482~−0.0211) <0.0001 (−) Model 2 0 0.0074 (−0.0019~0.0166) −0.0030 (−010140~0.0079)
−0.0205 (−0.0333~−0.0077) 0.0057 (−) Model 3 0 0.0056 (−0.0034~0.0146) −0.0024 (−0.0129~0.0080)
−0.0153 (−0.0271~−0.0034) 0.0273 (−) Model 4 0 0.0066 (−0.0025~0.0156) 0.0047 (−0.0058~0.0152) −0.0040 (−0.0173~0.0091) 0.9571 (−)
(1) Reference, (2) β-coefficients (95% Confidence Interval), Model 1: Unadjusted; Model 2: Adjusted for gender,
age, and energy intake; Model 3: Adjusted for gender, age, energy intake, family size, exercise, alcohol con-
sumption, stress status, smoking, obese status, food security, snack, and eating-out frequency per week; Model 4:
Adjusted for gender, age, family size, energy intake, exercise, alcohol consumption, stress status, smoking, obesity
status, food security, snacking, eating-out frequency per week, marital status, occupation, education level, and household income. 4. Discussion
The “eating alone” population is increasing due to the increase in single-person
households and other relevant societal changes, including individualization. Additionally,
such a phenomenon is not merely due to personal preferences but also reflects social,
structural, and cultural changes [24]. Several previous studies have reported that eating
alone negatively influences health for various reasons without clarifying the reasons behind
its increase [18,24,41–43]. Reports suggest that a lack of diverse nutrient and food intake
should be associated with increased levels of social isolation, depression, and decreased
quality of life [24,44]. This study identified 7037 older adults from the 2016–2020 KNHANES
database and examined their health, diet, food and nutrient intakes, depression, and quality
of life that depended on the frequency of eating alone.
Previous studies about eating alone using the KNHANES dataset defined eating alone
based on respondents answering “no” to the dietary life survey question about eating
meals (i.e., breakfast, lunch, and dinner) together with family members and other people.
In contrast, this study analyzed more objectively the frequency of eating alone and the
presence or absence of eating together using the 24-h dietary recall method. We found
a gender difference in the “eating alone” condition. The proportion of men was higher
than that of women only in the “eating together” group, whereas the proportion of women
was higher in all other “eating alone” groups. In a previous study on Korean adults aged
19 years or older, the male ratio was higher than that of females in the “eating together”
and “1/day eating alone” groups. Compared to the higher proportion of women in the
other “eating alone” groups, i.e., eating alone for two or three meals per day, we found
that the frequency of eating alone was higher among women than among men in older
adults. The average ages of subjects in the “eating together” and “eating alone” groups
were 72.82 and 74.19 years, respectively. Thus, the higher the frequency of eating alone,
the higher the age. In research involving adults and eating alone, the average age of those
who ate alone for one meal per day and three meals per day was 45.3 and 54.7 years,
respectively [44]. Previous studies reported that 7% or 12.2% of Korean adults eat three
meals alone a day, whereas our study targeted older adults and found that those eating all
three meals alone per day (3/day eating alone) were as high as 13.95%, higher than the adult
group [45,46]. We also analyzed the data after classifying the subjects into “65–74 years old”
and “≥75 years old” groups. The rate at which the frequency of eating alone increased
gradually decreased in the “65–74 years of age” group, while for the “≥75 years old or
older” group, “eating alone once a day”, “twice a day”, and ”thrice a day” were 35.07%,
43.69%, and 50.3%, respectively. Thus, the older respondents were, the more often they ate a daily meal alone.
The results of analyzing the frequency of eating alone (a solo daily meal) among
subjects in this study show that for those who have one meal alone per day, the solo meal
was breakfast, lunch, or dinner 40.28%, 38.99%, and 20.73% of the time, respectively. Thus,
the rate of eating alone is higher for breakfast or lunch than for dinner, which is consistent
with the results of a study with Korean adults [46]. Additionally, most subjects answered
“two” regarding family size. Older adults were more likely to eat together with family
Nutrients 2023, 15, 2085 14 of 18
members than other people who were not family members. The highest rate of eating all
three meals alone daily was 55.06% for those with a single-member family. This indicates
that older adults eating alone are more significantly affected by the number of family
members. For older adults who live alone, the frequency of eating alone will likely increase,
leaving them deficient in healthy eating and nutrient consumption. Thus, interventions
must be taken to prevent imbalanced meals and maintain correct dietary habits.
In the “cooking place of solo meal” survey item for the subjects of this study, the ratio
of “only at home” was 65.82% in all eating alone groups regardless of the frequency of
eating alone, meaning that most of the solo meals were prepared at home, which is higher
than that for adults. Thus, providing services such as nutrition management that focus on
homemade, balanced and healthy meals may be beneficial for older adults who eat alone.
Looking at the subject’s “food security”, the rates of “enough food security” (i.e., all
members within the family could eat a sufficient quantity and variety of foods) were higher
in the “eating together” and “1/day eating alone” groups. In contrast, the proportion
of “mild food insecurity” (i.e., everyone in the family ate enough food, but not a good
variety) was high in the “eating alone two meals a day” and “eating alone three meals”
groups. This indicates that the higher the frequency of eating alone, the lower the food
security. This can be interpreted to mean that the frequency of eating alone is higher in lower-income households.
Furthermore, the more frequently people eat alone, the less frequently they eat out.
Snack intake also decreased as the frequency of eating alone increased. Thus, the number
of meals eaten alone was related to total food intake, food safety, snack intake, and the frequency of eating out.
Looking at the consumption of food groups according to the frequency of eating alone,
food groups such as vegetables, fruit, meat, poultry, seaweed, and seasoning showed a
significantly lower intake as the frequency of eating alone increased (p for trend < 0.05). The
total intake of “fruit” and “vegetables” in the “eating together” group was 301.2 g, while it
was 304.2 g, 250.1 g, and 266.2 g in the “eating alone” groups, i.e., one meal a day, two meals
a day, and three meals a day, respectively. Thus, in all groups, the consumption was less
than 400 g, which the World Health Organization (WHO) and the World Cancer Research
Fund (WCRF) recommend. This is consistent with the results from previous studies on
middle-aged adults eating alone that found the frequency of eating alone increased as the
frequency of vegetable and fruit intake decreased. It is also consistent with the results
from studies on older Japanese adults eating alone that found the consumption of green
and yellow vegetables and fruits was lower in the older adults eating alone than that in
older adults eating together with others [18–20,32,45]. This means that people who eat
alone consume relatively fewer vegetables and fruit and overall fruit and vegetable intake
was low for older adults in all groups. In particular, the consumption of fresh fruit and
vegetables was insufficient to a greater degree in older adults who ate alone more frequently,
indicating that this population needs a varied diet that includes fresh fruit and vegetables,
new recipes, and the development of food products, and education emphasizing the intake
of fruit and vegetables to maintain a healthy and balanced life [46].
Food groups were affected by the frequency of eating alone. The intake of “meat,
poultry, and their products” was significantly lower as the frequency of eating alone
increased. A previous study of Korean adults eating alone also reported a lower intake
of the same food group. In a study of middle-aged men, the more men ate alone, the
less calcium and protein-based energy they consumed, while their fat intake increased.
Therefore, “meat, poultry, and their products” have become a common food group, of
which both adults and older people ate less when they ate alone more frequently [32,47].
This explains the result of significantly reduced protein intake concurrent with gradually
increasing carbohydrate intake for an increasing number of people eating alone. Our study
targeted older adults and showed that “meat, poultry, and their products” intake was
significantly reduced, pointing towards lower protein intake. Thus, we learned that protein
intake could be lowered as the number of people eating alone increases, regardless of age.
Nutrients 2023, 15, 2085 15 of 18
We examined the relationship between the number of people eating alone and the
stress subjects felt. The higher the frequency of eating alone, the more significant the
proportion of “feel it very much” responses. This indicates that a high frequency of
eating alone might be related to older adult stress. Examining the connection between
depression and the frequency of eating alone in models adjusted for gender, age, and
energy intake, we found that depression was significantly higher in the “eating three meals
a day alone” group. No significant difference was found when the model was adjusted for
other variables. However, previous studies investigating depression revealed a relationship
between dinner accompanied by other people and depression in Korean adults. Other
studies reported that the greater the number of solo meals, the higher the rate of depression.
Notably in a previous study on older adults, eating alone was reported as a significant risk
factor for high PHQ-9 scores, indicative of depression [30,44,48]. This result is consistent
with a previous study using the geriatric depression scale (GDS) in the elderly over 65 years
of age, which indicated that older adults who ate alone had higher rates of depression than
those who ate with others [46].
The frequency of eating alone differed in terms of the areas of residence. In the case of
urban residents, it was shown to be gradually increasing along with the frequency of eating
alone, consisting of 73.51%, 81.19%, 80.9%, and 78.75% in the “eating together”, “eating
alone one meal a day”, “eating alone two meals a day”, and “eating alone three meals a
day” groups. Conversely, rural residents reported a slower decline in the frequency of
eating alone than urban residents.
Rural residents are less likely to eat alone than urban dwellers. Additionally, they
frequently engage in social support or activities more closely tied to women’s organizations
and village halls, enhancing their sense of community. These might help them mitigate the
feeling of loneliness and lower their level of depression. Thus, encouraging community
activities for healthier and more regular meals as well as providing community kitchens
for older adults residing in urban areas who frequently eat alone—the population of lone
eaters would be large in urban areas—may assist in securing mutual exchange, interaction,
and food security among older adults, ultimately improving their mental health and quality
of life [49,50]. Evaluating older adults’ quality of life in relation to eating alone extends
the concept of health to cover the disease-free state, including overall well-being, social
well-being, and mental health. This study also investigated quality of life using the EQ-5D
score to find that the higher the frequency of eating alone, the lower the quality of life. We
also found a significant relationship between older adults’ eating alone habits and quality
of life scores, confirming its close relationship with various health variables [30].
This study has several limitations, which are described as follows. First, it is a cross-
sectional study using the KNHANES dataset, so a causal relationship between eating
behaviors depending on the frequency of eating alone, nutrient intake, and mental health
could not be identified. Additionally, there was no information on the reasons for eating
alone, i.e., whether it was voluntary or involuntary; information on eating snacks, whether
alone or with others, was absent. The characteristics of eating habits, including the number
of meals, meal time, and whether the meal was cooked or was an instant food, were not
reflected in this study. Furthermore, an individual’s routine diet might not have been
considered because intake status was analyzed using 24-h recall data. Additionally, there
are multifactorial causes of loneliness and depression among older people, including
family environment, presence or absence of a spouse, subjective health status, contact with
neighbors and friends, living conditions, living environments, sociocultural perspectives,
and other factors. A limitation of this study is that it did not include all of these factors.
Despite these limitations, this study targeted older adults aged 65 or more from
the KNHANES dataset and conducted weighted data analysis to secure the sample’s
representativeness for older Korean adults.
This study identified the relationship between dietary behavior, food and nutrient
intake, and mental health in older adults eating alone, reflecting current social and cultural
conditions. Previous studies defined eating alone as answering “no” to a dietary life
Nutrients 2023, 15, 2085 16 of 18
survey question about eating together with family members or others based on meals
(i.e., breakfast, lunch, and dinner). In contrast, this study is advantageous because we
used objective data based on the 24-h dietary recall method to categorize the frequency
of eating alone and analyze the prevalence of eating together. Therefore, eating alone is
not a mere act of eating; it is closely related to one’s health status and influences mental
health and quality of life. Thus, older adults who often eat alone deserve attention not
only in terms of meal improvement, but also in terms of social, cultural, and social welfare
perspectives—developing appropriate health policies and nutrition education programs to
promote dietary life management and mental health. Our findings in this study could be
used as substantial evidence for establishing guidelines for dietary management among
older adults who frequently eat alone. 5. Conclusions
Among older adults who frequently eat alone throughout the day, the intake of
“vegetables”, “fruit”, “meat, poultry, and their products”, “seaweed”, “milk and dairy
products”, and “seasonings” was reduced, exhibiting low nutritional intakes of protein,
sodium, potassium, vitamin A, carotene, and niacin. Although the food groups and single
nutrient intakes used in this study could not determine the overall composition of the diet,
they showed how meal patterns might differ depending on how often one eats alone. Thus,
the results from our study could be useful for appropriate nutrition management and meal
planning for older adults who frequently eat alone. Additionally, our results show that
a higher frequency of eating alone influences depression and quality of life, indicating
a need for future welfare services customized for older adults that could improve their health status.
Older adults who eat alone have different characteristics from age groups, so studies
about eating alone improve our understanding of its frequency and the patterns of the
meals eaten alone based on different genders and regions. The results from such studies
could help establish suitable strategies for adequate nutrition and health management
among older adults who frequently eat alone.
Author Contributions: Conceptualization, S.K., Y.-K.P., K.H.H. and Y.K.; study design S.K., Y.-K.P.,
K.H.H. and Y.K. methodology, Y.K.; formal analysis, S.K. and Y.-K.P.; investigation, S.K. and Y.K.;
writing—original draft preparation, S.K., K.H.H. and Y.K.; writing—review and editing, S.K., K.H.H.
and Y.K.; validation, S.K., K.H.H. and Y.-K.P.; visualization, S.K. and Y.-K.P.; supervision, S.K., Y.-K.P.
and Y.K. All authors have read and agreed to the published version of the manuscript.
Funding: This research was funded by the agro-food based basic research of the Korea Rural Devel-
opment Administration grant (Project No. PJ017251).
Institutional Review Board Statement: The KNHANES data used in this study were approved by
the KDCA Institutional Review Board (IRB approval numbers: 2018-01-03-P-A, 2018-01-03-C-A, and
2018-01-03-2C-A). Among these, KNHANES was exempt from review regarding research ethics based
on the Bioethics and Safety Act from 2015 to 2017.
Informed Consent Statement: Not applicable.
Data Availability Statement: All data were obtained from the Korea Disease Control and Prevention
Agency and are available with the permission of the Korea Disease Control and Prevention Agency.
The data in this study were from the Korea National Health and Nutrition Examination Survey.
Conflicts of Interest: The authors declare no conflict of interest. References 1.
Lee, H.J.; Yoon, J.Y. The Effect of Eating with Others on Depression among Community-dwelling Older Adults by Family
Arrangement. Korea Gerontol. Soc. 2019, 39, 415–427. [CrossRef] 2.
Jung, T.Y. Historical and Cultural Analyses of Collective Features of Korean Society. Korean J. Soc. Personal. Psychol. 2010, 24, 53–76.
Nutrients 2023, 15, 2085 17 of 18 3.
Nam, S.Y. Proposal of application service for ‘Honbab-jok’according to increasing single households focused on service design
methodology. J. Commun. Des. 2016, 55, 114–125. 4.
Jo, M.; Choen, H. People who eat alone: Characteristics by types and their satisfaction. Consum. Policy Educ. Rev. 2018, 141, 127–148. [CrossRef] 5.
Lee, E.J.; Lee, K.R. Comparison of solo eating perception and dietary behaviors according to gender in the Seoul and Gyonggi-do
regions. J. Korean Soc. Food Cult. 2018, 33, 531–542. 6.
Herman, C.P.; Polivy, J. Normative influences on food intake. Physiol Behav. 2005, 86, 762–772. [CrossRef] [PubMed] 7.
Park, J.N.; Cheon, H.J. Leisure-alone Folks: Their Experiences and Meaning. J. Leis. Stud. 2012, 10, 87–105. 8.
Park, M.; Ahn, B. Impacts of food consumption lifestyle on the expenditure for the processed food: Using cluster analysis and
matching method. J Rural Dev. 2014, 37, 25–58. 9.
Statistics Korea. Available online: https://www.kostat.go.kr/portal/korea/kor_nw/1/1/index.board?bmode=read&aSeq=4154
46 (accessed on 29 January 2023). 10.
Jung, H. Y The Effects of Solo Diners’ Self-Determined Motivation for Solitude and Solo Dining Propensity on Solo Dining
Satisfaction. Master’s Thesis, Sejong University, Seoul, Republic of Korea, 2017. 11.
Chae, W.; Ju, Y.J.; Shin, J.; Jang, S.I.; Park, E.C. Association between eating behaviour and diet quality: Eating alone vs. eating
with others. Nutr J. 2018, 17, 117. [CrossRef] 12.
Lee, Y.; Oh, Y.J.; Cho, W.; Jo, P.K. Differences in solo eating perceptions and dietary behaviors of university students by gender. J.
Korean Diet. Assoc. 2015, 21, 57–71. [CrossRef] 13.
Lee, S.H. The main choice menu for the eating-alone group. In ‘Food Safety Day’ Weekly Honbap Symposium; Ministry of Food and
Drug Safety: Osong, Republic of Korea, 2017; pp. 13–33. 14.
Shin, G.; Kim, Y.; Kim, M. Nutritional evaluation of convenience meals in convenience stores near the universities. Korean J.
Community Nutr. 2017, 22, 375–386. [CrossRef] 15.
Ford, E.S. Prevalence of the metabolic syndrome defined by the international diabetes federation among adults in the U.S. Diabetes
Care 2005, 28, 2745–2749. [CrossRef] [PubMed] 16.
Kim, M.R.; Kim, H.J.; Kim, J.H.; Park, B. Sex difference in the relationship between evening meal-sharing and prevalence of
metabolic syndrome: The 2013–2014 Korean National Health and Nutrition Examination Survey. Korean J. Fam. Pract. 2018, 8, 125–130. [CrossRef] 17.
Kimura, Y.; Wada, T.; Okumiya, K.; Ishimoto, Y.; Fukutomi, E.; Kasahara, Y.; Matsubayashi, K. Eating alone among community-
dwelling Japanese elderly: Association with depression and food diversity. J. Nutr. Health Aging 2012, 16, 728–731. [CrossRef] 18.
Reicks, M.; Davey, C.; Anderson, A.K.; Banna, J.; Cluskey, M.; Gunther, C.; Jones, B.; Richards, R.; Topham, G.; Wong, S.S.
Frequency of eating alone is associated with adolescent dietary intake, perceived food-related parenting practices and weight
status: Cross-sectional Family Life, Activity, Sun, Health, and Eating (FLASHE) Study results. Public Health Nutr. 2019, 22, 1555–1566. [CrossRef] 19.
Ishikawa, M.; Takemi, Y.; Yokoyama, T.; Kusama, K.; Fukuda, Y.; Nakaya, T.; Nozue, M.; Yoshiike, N.; Yoshiba, K.; Hayashi, F.;
et al. “Eating Together” Is Associated with Food Behaviors and Demographic Factors of Older Japanese People Who Live Alone.
J. Nutr. Health Aging 2017, 21, 662–672. [CrossRef] [PubMed] 20.
Tanaka, I.; Kitamura, A.; Seino, S.; Nishi, M.; Tomine, Y.; Taniguchi, Y.; Yokoyama, Y.; Narita, M.; Shinkai, S. Relationship between
eating alone and dietary variety among urban older Japanese adults. [Nihon Koshu Eisei Zasshi]. Jpn. J. Public Health 2018, 65, 744–754. 21.
Tani, Y.; Kondo, N.; Noma, H.; Miyaguni, Y.; Saito, M.; Kondo, K. Eating alone yet living with others is associated with mortality
in older men: The JAGES cohort survey. J. Gerontol. B Psychol. Sci. Soc. Sci. 2018, 73, 1330–1334. [CrossRef] 22.
Huang, Y.C.; Cheng, H.L.; Wahlqvist, M.L.; Lo, Y.T.C.; Lee, M.S. Gender differences in longevity in free-living older adults who
eat-with-others: A prospective study in Taiwan. BMJ Open 2017, 7, e016575. [CrossRef] 23.
Li, C.L.; Tung, H.J.; Yeh, M.C. Combined effect of eating alone and a poor nutritional status on cognitive decline among older
adults in Taiwan. Asia Pac. J. Clin. Nutr. 2018, 27, 686–694. 24.
RYU, H.S.; Lee, M.A. Eating Alone and Depressive Symptoms of Korean Older Adults: Examining Differential Effects by Gender.
Surv. Res. 2019, 20, 1–27. [CrossRef] 25.
Jung, S.H.; Kim, J.H. The Relationship Between Eating Breakfast with Someone and Depression: Based on Korean National
Health and Nutrition Examination Survey. Health Soc. Welf. Rev. 2019, 39, 580–601. [CrossRef] 26.
Tani, Y.; Sasaki, Y.; Haseda, M.; Kondo, K.; Kondo, N. Eating alone and depression in older men and women by cohabitation
status: The JAGES longitudinal survey. Age Ageing 2015, 44, 1019–1026. [CrossRef] [PubMed] 27.
Kuroda, A.; Tanaka, T.; Hirano, H.; Ohara, Y.; Kikutani, T.; Furuya, H.; Iijima, K. Eating alone as social disengagement is strongly
associated with depressive symptoms in Japanese community-dwelling older adults. J. Am. Med. Dir. Assoc. 2015, 16, 578–585. [CrossRef] 28.
Yiengprugsawan, V.; Banwell, C.; Takeda, W.; Dixon, J.; Seubsman, S.A.; Sleigh, A.C. Health, happiness and eating together: What
can a large Thai cohort study tell us? Glob. J. Health Sci. 2015, 7, 270–277. [CrossRef] 29.
Ford, E.S.; Li, C. Metabolic syndrome and health-related quality of life among US adults. Ann. Epidemiol. 2008, 18, 165–171. [CrossRef]
Nutrients 2023, 15, 2085 18 of 18 30.
Song, E.G.; Yoon, Y.S.; Yang, Y.J.; Lee, E.S.; Lee, J.H.; Lee, J.Y.; Park, S.Y. Factors associated with eating alone in Korean adults:
Findings from the sixth Korea National Health and Nutrition Examination Survey, 2014. Korean J. Fam. Pract. 2017, 7, 698–706. [CrossRef] 31.
Eckel, R.H.; Barouch, W.W.; Ershow, A.G. Report of the national heart, lung, and blood institute-national institute of diabetes and
digestive and kidney diseases working group on the pathophysiology of obesity-associated cardiovascular disease. Circulation
2002, 105, 2923–2928. [CrossRef] 32.
Kim, H.K.; Chung, J. Associations of the eating alone behavior with nutrient intake, obesity and metabolic syndrome in middle-
aged adults based on the 2013~2017 korean national health and nutrition examination survey. J. Nutr. Health 2019, 52, 435–448. [CrossRef] 33.
Cha, S.; Lee, H. Analyzing adolescent family meal vs. alone meal: Focusing on adolescent time use and family characteristics. J.
Fam. Relat. 2018, 22, 135–156. [CrossRef] 34.
Sung, S.; Kwon, S. Effect of eating with family or alone on the self-rated mental or physical health-the elementary school children
in daejeon area. Korean J. Community Nutr. 2010, 15, 206–226. 35.
Cho, S.E.; Nam, B.; Seo, J.S. Impact of eating-alone on depression in korean female elderly: Findings from the sixth and seventh
korea national health and nutrition examination survey, 2014 and 2016. Mood Emot. 2018, 16, 169. 36.
Yang, J.S.; Bae, E.J.; Hong, J.E.; Kang, J.; Jeon, W.J. Eating alone among korean elderly association with depressive symptoms: The
korean national health and nutrition examination, 2013. Korean J. Fam. Pract. 2017, 7, 904–908. [CrossRef] 37.
Oh, K.; Lee, J.; Lee, B.; Kweon, S.; Lee, Y.; Kim, Y. Plan and Operation of the 4th Korea National Health and Nutrition Examination
Survey (KNHANES IV). Korean J. Epidemiol. 2007, 29, 139–145. 38.
Korea Centers for Disease Control and Prevention. Guideline for Seventh Korea National Health and Nutrition Examination Survey
(KNHANES VII); Korea Centers for Disease Control and Prevention: Osong, Republic of Korea, 2018; pp. 1–303. 39.
Shim, J.S.; Oh, K.W.; Nam, C.M. Association of Household Food Security with Dietary Intake; Based on the Third (2005) Korea
National Health and Nutrition Examination Survey (KNHANES III). J. Nutr. Health 2008, 41, 174–183. 40.
Lee, S.J.; Lee, K.W.; Oh, J.E.; Cho, M.S. Nutritional and health consequences are associated with food insecurity among Korean
elderly: Based on the fifth (2010) Korea National Health and Nutrition Examination Survey (KNHANES V-1). J. Nutr. Health 2015, 48, 519–529. [CrossRef] 41.
Kong, J.S.; Min, K.B.; Min, J.Y. Temporary Workers’ Skipping of Meals and Eating Alone in South Korea, The Korean National
Health and Nutrition Examination Survey for 2013–2016. Int. J. Environ. Res. Public Health 2019, 16, 2319. [CrossRef] 42.
Rah, W.; So, J.; Park, E.C.; Lee, S.A.; Jang, S.I. Association between family dinner and BMI in adults: Data from the 2013 to 2015
Korean National Health and Nutrition Examination Survey. Public Health Nutr. 2019, 22, 681–688. [CrossRef] 43.
Son, H.; Kim, H. Influence of Living Arrangements and Eating Behavior on the Risk of Metabolic Syndrome: A National
Cross-Sectional Study in South Korea. Int. J. Environ. Res. Public Health 2019, 16, 919. [CrossRef] 44.
Ahn, J.H.; Park, Y.K. Frequency of eating alone and health related outcomes in Korean adults: Based on the 2016 Korea National
Health and Nutrition Examination Survey. J. Korean Diet. Assoc. 2020, 26, 85–100. 45.
Lee, K.W.; Shin, D. Association between Eating Alone Patterns and Mental Health Conditions by Region among Korean Adults.
Korean J. Community Nutr. 2021, 26, 441–454. [CrossRef] 46.
Tani, Y.; Kondo, N.; Takagi, D.; Saito, M.; Hikichi, H.; Ojima, T.; Kondo, K. Combined effects of eating alone and living alone
on unhealthy dietary behaviors, obesity and underweight in older Japanese adults: Results of the JAGES. Appetite 2015, 95, 1–8. [CrossRef] [PubMed] 47.
Kwon, Y.; Kim, S. How Much Does Plant Food (Fruits and Vegetables) Intake Affect the Prevention of Periodontal Disease in the
Korean Elderly? Nutrients 2022, 14, 4589. [CrossRef] [PubMed] 48.
Donini, L.M.; Savina, C.; Cannella, C. Eating habits and appetite control in the elderly: The anorexia of aging. Int. Psychogeriatr.
2003, 15, 73–87. [CrossRef] [PubMed] 49.
Williams, K.L.; Galliher, R.V. Predicting depression and self–esteem from social connectedness, support, and competence. J. Soc.
Clin. Psychol. 2006, 25, 855–874. [CrossRef] 50.
Mundel, E.; Chapman, G.E. A decolonizing approach to health promotion in Canada: The case of the Urban Aboriginal
Community Kitchen Garden Project. Health Promot. Int. 2010, 25, 166–173. [CrossRef]
Disclaimer/Publisher’s Note: The statements, opinions and data contained in all publications are solely those of the individual
author(s) and contributor(s) and not of MDPI and/or the editor(s). MDPI and/or the editor(s) disclaim responsibility for any injury to
people or property resulting from any ideas, methods, instructions or products referred to in the content.
Document Outline
- Introduction
- Materials and Methods
- Research Data
- Subjects
- Meal Pattern According to the Frequency of Eating Alone
- General Characteristics
- Health Related Characteristics
- Dietary Behavior
- Food and Nutrient Intake
- PHQ-9
- EQ-5D
- Statistical Analysis
- Results
- General Characteristics
- Meal Pattern According to the Frequency of Eating Alone
- Health-Related Characteristics According to the Frequency of Eating Alone
- Dietary Behavior According to the Frequency of Eating Alone
- Food Intake in Their Meal According to Consumption Frequency of Eating Alone
- Nutrient Intake Depending on the Consumption Frequency of Eating Alone
- Depression-Related Survey Results
- Association between the Prevalence of Depression and the Frequency of Eating Alone
- Quality of Life Survey Results
- Relationship between the Frequency of Eating Alone and Quality of Life
- Discussion
- Conclusions
- References
Tài liệu liên quan:
-

Ung dung game hoa trong cac chien dich MKT
43 22 -
Bao cao Chi so TMDT Viet Nam 2025
42 21 -
Thông tư quy định về việc phân quyền, phân cấp và phân định thẩm quyền quản lý nhà nước về giáo dục cho chính quyền địa phương
47 24 -
Nghị quyết về phát huy các giá trị di sản văn hóa gắn với phát triên du lịch bền vững tỉnh Khánh Hòa đến năm 2025, định hướng đến năm 2030
46 23 -
Quyết định phê duyệt Chiến lược phát triển du lịch Việt Nam đến năm 2030
31 16