How GDP measure of the well-being ? môn Kinh tế vĩ mô | Học viện Nông nghiệp Việt Nam
Gross Domestic Product (GDP) is commonly used as a measure of anation's economic health, but how well does it reflect the overall well-being of society? This essay delves into the core function of GDP, analysing its advantages in tracking economic growth, guiding
policy, and enabling international comparisons.Tài liệu giúp bạn tham khảo ôn tập và đạt kết quả cao. Mời bạn đọc đón xem.
Môn: Kinh tế vĩ mô (HVNN) 12 tài liệu
Trường: Học viện Nông nghiệp Việt Nam 2.4 K tài liệu
Tác giả:


Preview text:
lOMoAR cPSD| 48599919 I. Introduction
- Gross Domestic Product (GDP) is commonly used as a measure of a nation's economic
health, but how well does it reflect the overall well-being of society? This essay delves into the
core function of GDP, analysing its advantages in tracking economic growth, guiding policy,
and enabling international comparisons. However, it also highlights its significant limitations,
such as excluding income distribution, environmental costs, and non-market activities like
unpaid labour. Finally, we will explore alternative metrics like the Human Development Index
(HDI) and the Genuine Progress Indicator (GPI)..., which provide a more comprehensive
understanding of societal well-being.
By examining both the strengths and limitations of GDP, this essay aims to offer a balanced
perspective on its effectiveness in measuring not only economic performance but also the true
welfare of a society. Alternative measures will be considered to present a broader view of what
constitutes progress and well-being in a country. II. Body of Essay 1 . Understanding GDP 1.1 . Definition of GDP
+ GDP stands for "Gross Domestic Product" and represents the total monetary value of all
final goods and services produced (and sold on the market) within a country during a period ( typically 1 year ).
+ GDP is an accurate indicator of the output of an economy, and the GDP growth rate is
probably the single best indicator of economic growth. - Components of GDP
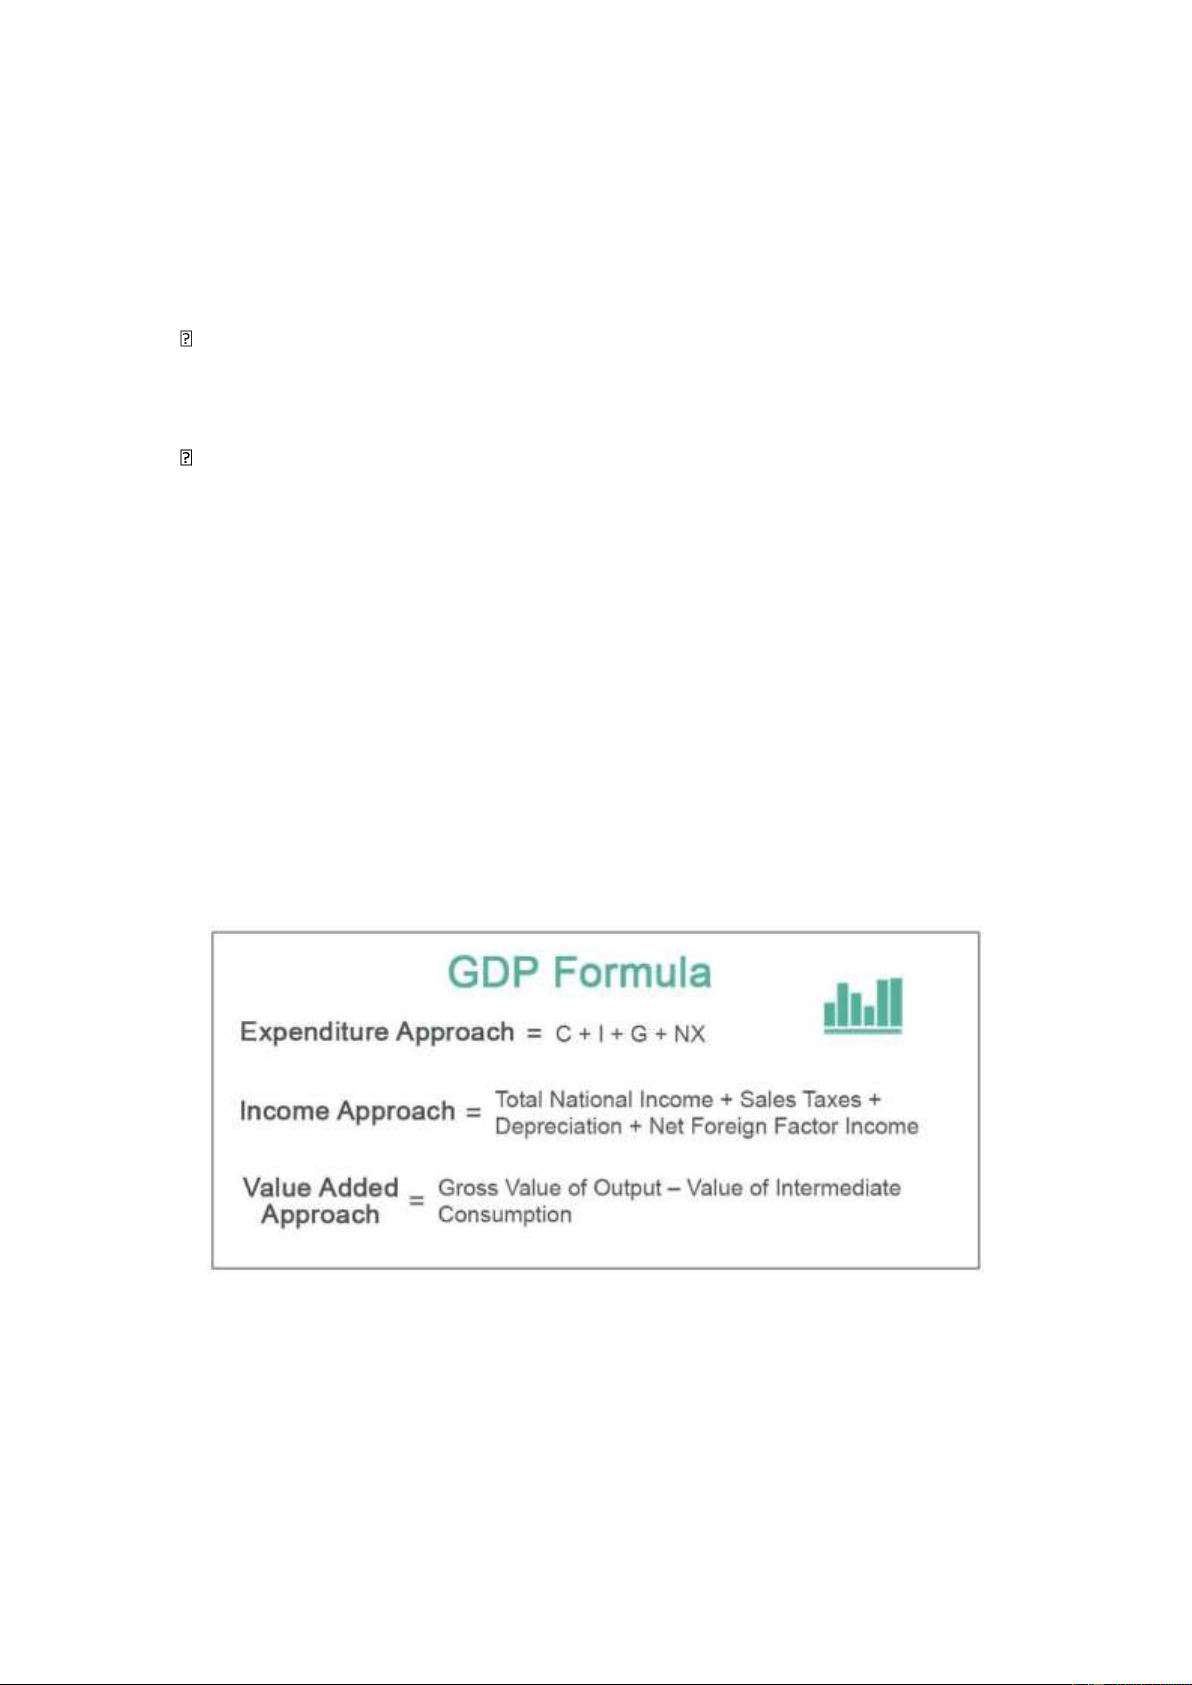
+ Equation for GDP: GDP= C + I + G + NX Where: • C = Consumption • I = Investment • G = Government Spending • NX= Net exports
- GDP comprises five elements: consumption expenditures, investment, government
purchases, and net exports. Consumption expenditures are the spending made by households
on goods and services, not including spending on new houses. Investment is the spending by
firms on new factories, office buildings, machinery, and additions to inventories, plus
spending by households and firms on new houses. Government purchases are federal, state,
and local government spending on goods and services. Net exports are exports minus imports.
- Three Approaches to measure GDP
+ There are three approaches to measuring GDP: expenditures, income, and value-added. 1 lOMoAR cPSD| 48599919 1.2 . Expenditures Approach
- The total spending on all final goods and services Consumption (C) + Gross Investments
( I) + Government Purchases (G) + Exports (X) – Imports (M )) GDP = C + I + G + (X-M) 1.3. Income Approach GDP = W + R + I + P + T − S Where: • W: Wages • R: Rent • I: Interest • P: Profits • T: Taxes • S: Subsidies 1.4 . Value-added Approach -
Value added, which is the additional market value a firm gives to a product, is totalled
up to calculate the value of GDP. Figure 1: GDP Formula - Importance of GDP : + Why is GDP widely used?
Gross Domestic Product (GDP) is one of the most widely used measures of an economy’s output or production. 2 lOMoAR cPSD| 48599919
GDP is widely utilized for several important reasons:
• Economic Performance Indicator: GDP serves as a primary gauge of a country's
economic health. It reflects the economic activities and overall productivity of a nation.
• Policy Making: Governments and policymakers rely on GDP data to make informed
decisions regarding fiscal and monetary policies. It helps in planning budgets, tax
policies, and public spending.
• Investment Decisions: Investors analyze GDP trends to assess the potential for returns
on investments. A growing GDP often attracts foreign investment, signaling a robust economy.
• International Comparisons: GDP allows for the comparison of economic performance
across different countries. This helps in understanding global economic standings and competitiveness.
• Standard of Living Insights: While GDP alone doesn’t measure well-being, it is often
correlated with higher living standards and improved quality of life in many contexts. - History
+ The first basic concept of GDP was invented at the end of the 18th century. The modern
concept was developed by the American economist Simon Kuznets in 1934 and adopted as the
main measure of a country's economy at the Bretton Woods conference in 1944.
• Paul A. Samuelson and William Nordhaus neatly sum up the importance of the national
accounts and GDP in their seminal textbook “Economics.”
“While GDP and the rest of the national income accounts may seem to be arcane
concepts, they are truly among the great inventions of the twentieth century.”
• They liken the ability of GDP to give an overall picture of the state of the economy to
that of a satellite in space that can survey the weather across an entire continent.
2 . Strengths of GDP as a Measure of Well-being
o GDP is the best single measure of the economic well-being of a society.
o GDP per person tells us the income and expenditure of the average person in the economy.
o Higher GDP per person indicates a higher standard of living o GDP can reflect part of
well-being, but it is not a perfect measure: -
Comprehensive Economic Growth Indicator :
+ GDP is designed to capture the total value of all goods and services produced within a
country's borders in a given period. This comprehensive approach allows for a broad overview
of economic activity, making it an essential metric for understanding the general health and performance of an economy.
References: World Bank. (2021). GDP as a Measure of Economic Activity. 3 lOMoAR cPSD| 48599919 -
Correlation with Living Standards :
+ Although GDP is not a direct measure of living standards, there is generally a positive
correlation between GDP growth and improvements in living conditions. As GDP increases,
the average income level tends to rise, offering people better access to various goods, services,
and opportunities. Consequently, higher GDP can lead to enhanced public services, better
educational opportunities, and improved healthcare facilities. Nevertheless, it is crucial to
remember that GDP is not a perfect indicator of living standards, as income inequality and
distribution, social welfare, and other factors can impact the overall well-being of a population.
References: Krugman, P. (2013). The Role of GDP in Economic Analysis. - Policy-Making Tool :
+ GDP serves as a valuable tool for policymakers in making informed decisions and
formulating effective policies. By tracking GDP growth rates, governments can assess their
economic performance and identify areas requiring improvement or intervention. GDP data
can help guide resource allocation, budget planning, and the development of fiscal and
monetary policies. Policymakers also utilize GDP trends to evaluate the effectiveness of
implemented policies and initiatives.
References: IMF. (2020). The Use of GDP in Policymaking. - Comparability:
+ GDP allows for straightforward comparisons of economic performance across countries
and regions. International benchmarking enables the assessment of relative economic strength
and competitiveness. Additionally, tracking GDP trends over time offers insights into
economic growth rates and development stages, facilitating comparative analysis among nations.
References: OECD. (2022). Comparing Economic Performance: The Role of GDP. -
Some things that contribute to well-being are not included in GDP : • The value of leisure •
The value of a clean environment. •
The value of almost all activity that takes place outside of markets, such as the value
of the time parents spend with their children and the value of volunteer work 4 lOMoAR cPSD| 48599919
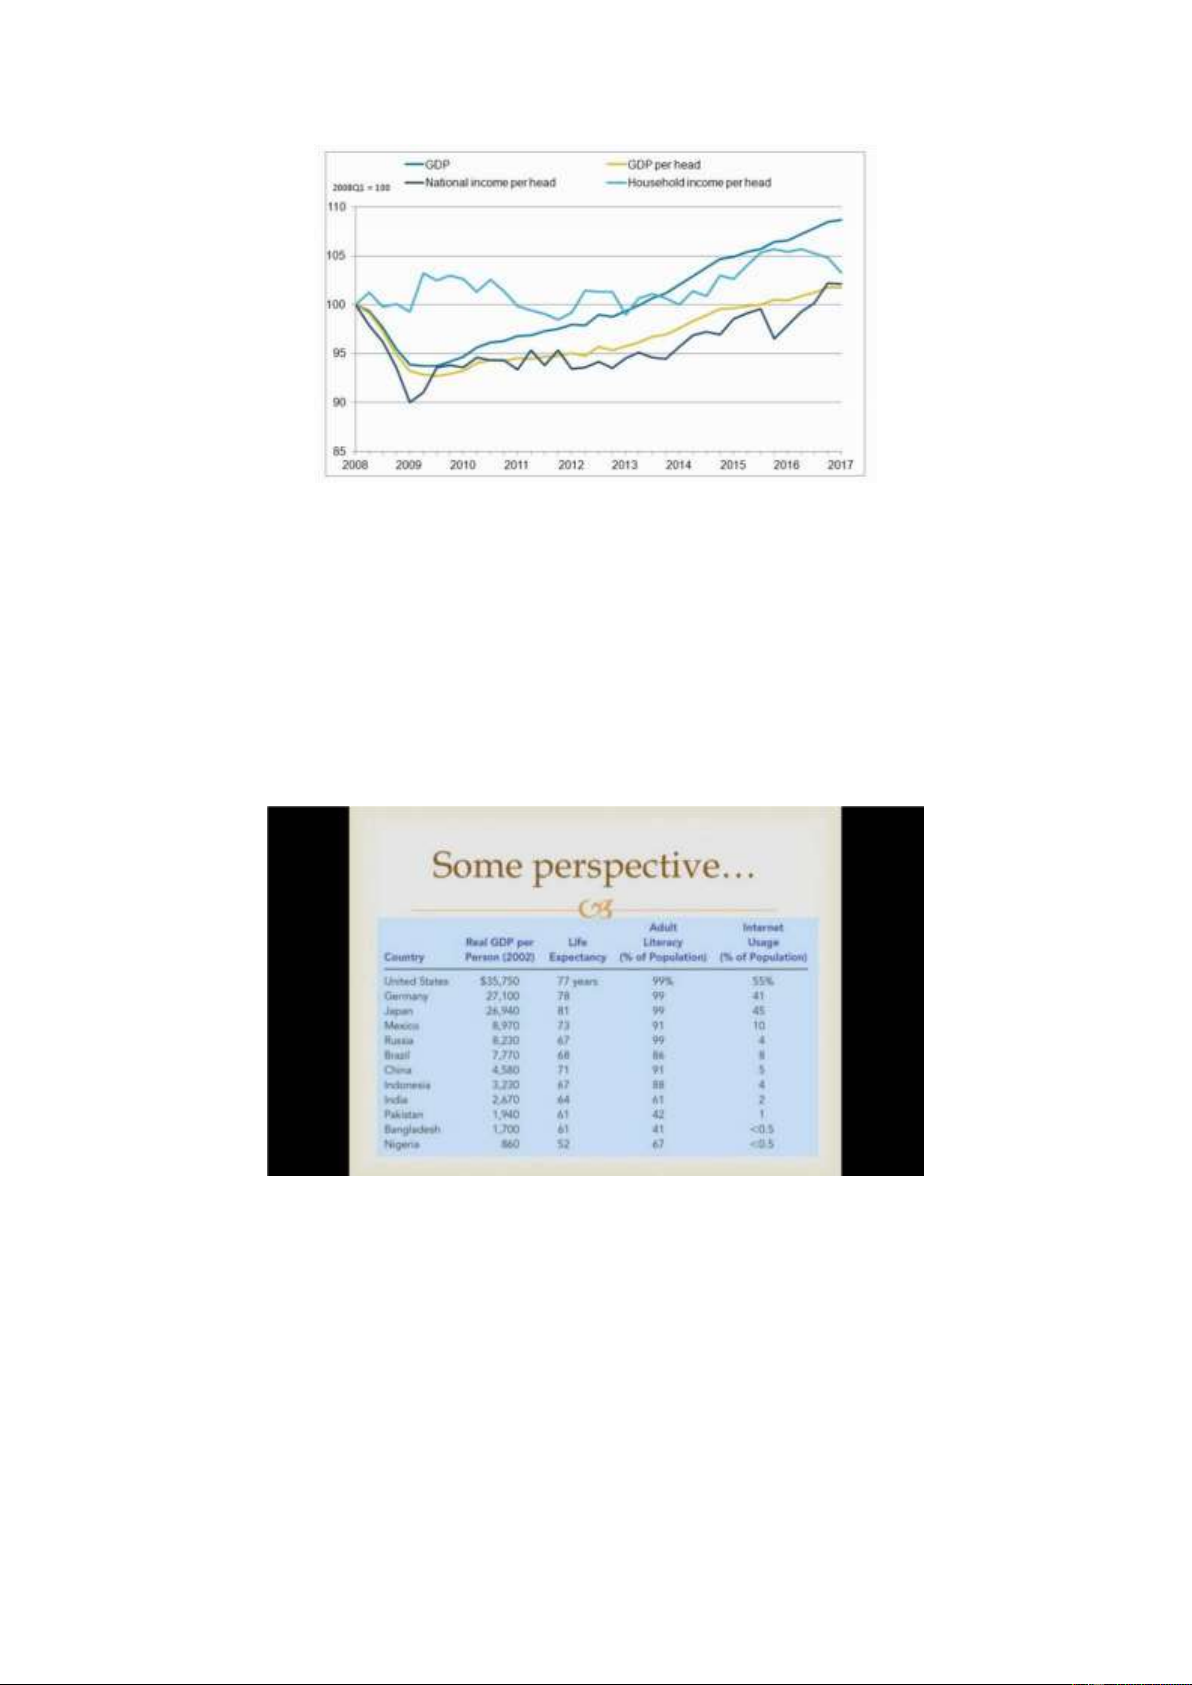
Figure 2: GDP compared with 3 measures of economic well-being, 2008 Q1 – 2017
References: Fletcher, M. (2017, July 6). Beyond GDP: Measuring the economic well-being of individuals. -
Three of the main indicators – GDP per head, national income per head (net national
disposable income per head), and household income per head (real household disposable
income per head) – tell a different story about growth in the UK, and offer a more holistic view of economic well-being.
Figure 3: GDP and economic well-being
3 . Limitations of GDP in Measuring Well-being
3.1 Ignores Non-Market Activities -
GDP only measures market transactions (i.e., goods and services bought and sold in
markets) and excludes non-market activities, such as: -
Household work like cooking, cleaning, and childcare. -
Volunteer work, which can significantly contribute to well-being. 5 lOMoAR cPSD| 48599919
=> By ignoring these, GDP underestimates the true economic value of these activities and
their impact on people's quality of life.
3.2 Does Not Account for Income Distribution -
GDP measures the total output of an economy but says nothing about how income is
distributed. Even if GDP is rising, it could benefit only a small portion of the population,
exacerbating inequality, which can negatively affect societal well-being.
3.3 Overlooks Environmental Degradation -
GDP growth may come at the expense of the environment. Activities that harm the
environment (e.g., deforestation, pollution) can increase GDP in the short term, but they
reduce long-term well-being by degrading natural resources. GDP does not account for: • Resource depletion.
• Pollution and environmental damage.
=> As a result, GDP may rise while overall well-being declines due to environmental degradation.
3.4 Neglects Quality of Life Factors -
GDP focuses solely on economic output and doesn’t consider many quality of life factors such as: • Health and life expectancy. • Education levels. • Work-life balance. • Leisure time and happiness.
=> These elements are critical to human well-being but are not reflected in GDP measurements.
3.5 Counts “Bad” as “Good” -
Certain activities that may harm society can contribute positively to GDP, such as:
• Crime: The costs of policing, legal procedures, and imprisonment contribute to GDP,
even though they reflect societal problems.
• Natural disasters: Reconstruction efforts increase GDP, even though they represent efforts to recover from loss.
=> Thus, GDP may rise in response to negative events, which contradicts the concept of improved well-being. 3.6 Ignores Externalities -
GDP does not account for positive or negative externalities. For example :
• Negative externalities like pollution or congestion that result from industrial activity
are not deducted from GDP, though they decrease well-being.
• Positive externalities like community support or the social value of culture are not
added to GDP, even though they increase well-being. 6 lOMoAR cPSD| 48599919 3.7 Short-Term Focus -
GDP emphasises short-term production and consumption, while well-being often
depends on long-term investments in areas like: • Education. • Healthcare. • Sustainability.
=> A growing GDP may reflect short-term economic gains at the expense of long-term wellbeing.
3.8 Subjective Well-being is Ignored -
GDP does not measure how people feel about their lives, i.e., their subjective well- being. Studies have shown that:
Happiness or life satisfaction often does not correlate directly with GDP growth.
Countries with similar GDP levels can have vastly different levels of happiness,
indicating that factors beyond economic output (such as social trust and equality) play a role in well-being.
4 . Alternatives To GDP
4.1 Human Development Index (HDI ) -
The Human Development Index (HDI) is a composite statistic used to rank countries
based on human development levels rather than just economic output. It was introduced by the
United Nations Development Programme (UNDP) in 1990 as part of its Human Development Reports. 4.1.1 . Purpose of HDI : -
The HDI aims to provide a broader measure of development beyond income,
incorporating elements that directly impact people’s quality of life. -
It shifts the focus from national income as the sole indicator of development to include
social dimensions, thus offering a more comprehensive picture of well-being. 4.1.2 . Components of HDI : -
The HDI is composed of three key dimensions, each reflecting a fundamental aspect of human development:
a. Life Expectancy at Birth (Health Dimension): - What Does It Measure?
+ Life expectancy at birth is an estimate of the average number of years a newborn is
expected to live, assuming that current mortality rates remain constant throughout their lifetime. - Importance: 7 lOMoAR cPSD| 48599919
+ It reflects the general health conditions in a country, including access to healthcare, quality
of medical services, and overall living conditions.
+ Longer life expectancy is generally associated with higher standards of living, better
nutrition, and improved public health systems. - Challenges:
+ While life expectancy provides a snapshot of health, it doesn't account for the quality of
those years, such as the prevalence of chronic diseases or disability. b. Education Index (Education Dimension): - What It Measures:
+ The Education Index is a combination of two indicators:
• Mean Years of Schooling: The average number of years of education received by people aged 25 and older.
• Expected Years of Schooling: The total number of years of schooling that a child
entering the education system is expected to receive if current enrollment patterns persist. - Importance:
• Education is a critical factor in enhancing human capabilities and achieving higher economic productivity.
• Higher education levels are associated with better job opportunities, higher incomes,
and improved social outcomes. - Challenges:
• The index primarily measures access to education, not the quality of education, which
can vary significantly between countries and regions.
• It also doesn’t account for informal or vocational education, which can be crucial in some economies.
c. Gross National Income (GNI) per Capita (Standard of Living Dimension) - What Does It Measure?
+ GNI per capita is the total income of a country's residents, including income from abroad, divided by the population.
+ It is adjusted for purchasing power parity (PPP) to account for cost of living differences across countries. - Importance:
+ This measure reflects the material well-being of a population, indicating the average
income available to individuals for consumption, savings, and investment.
+ Higher GNI per capita typically suggests better access to goods, services, and infrastructure. - Challenges: 8 lOMoAR cPSD| 48599919
+ GNI per capita is an average and doesn’t reflect income distribution within a country.
High-income inequality can mean that significant portions of the population do not benefit from national income growth.
+ It also does not consider non-market activities like household work or the informal
economy, which can be substantial in some countries. 4.1.3 . Calculation of HDI : -
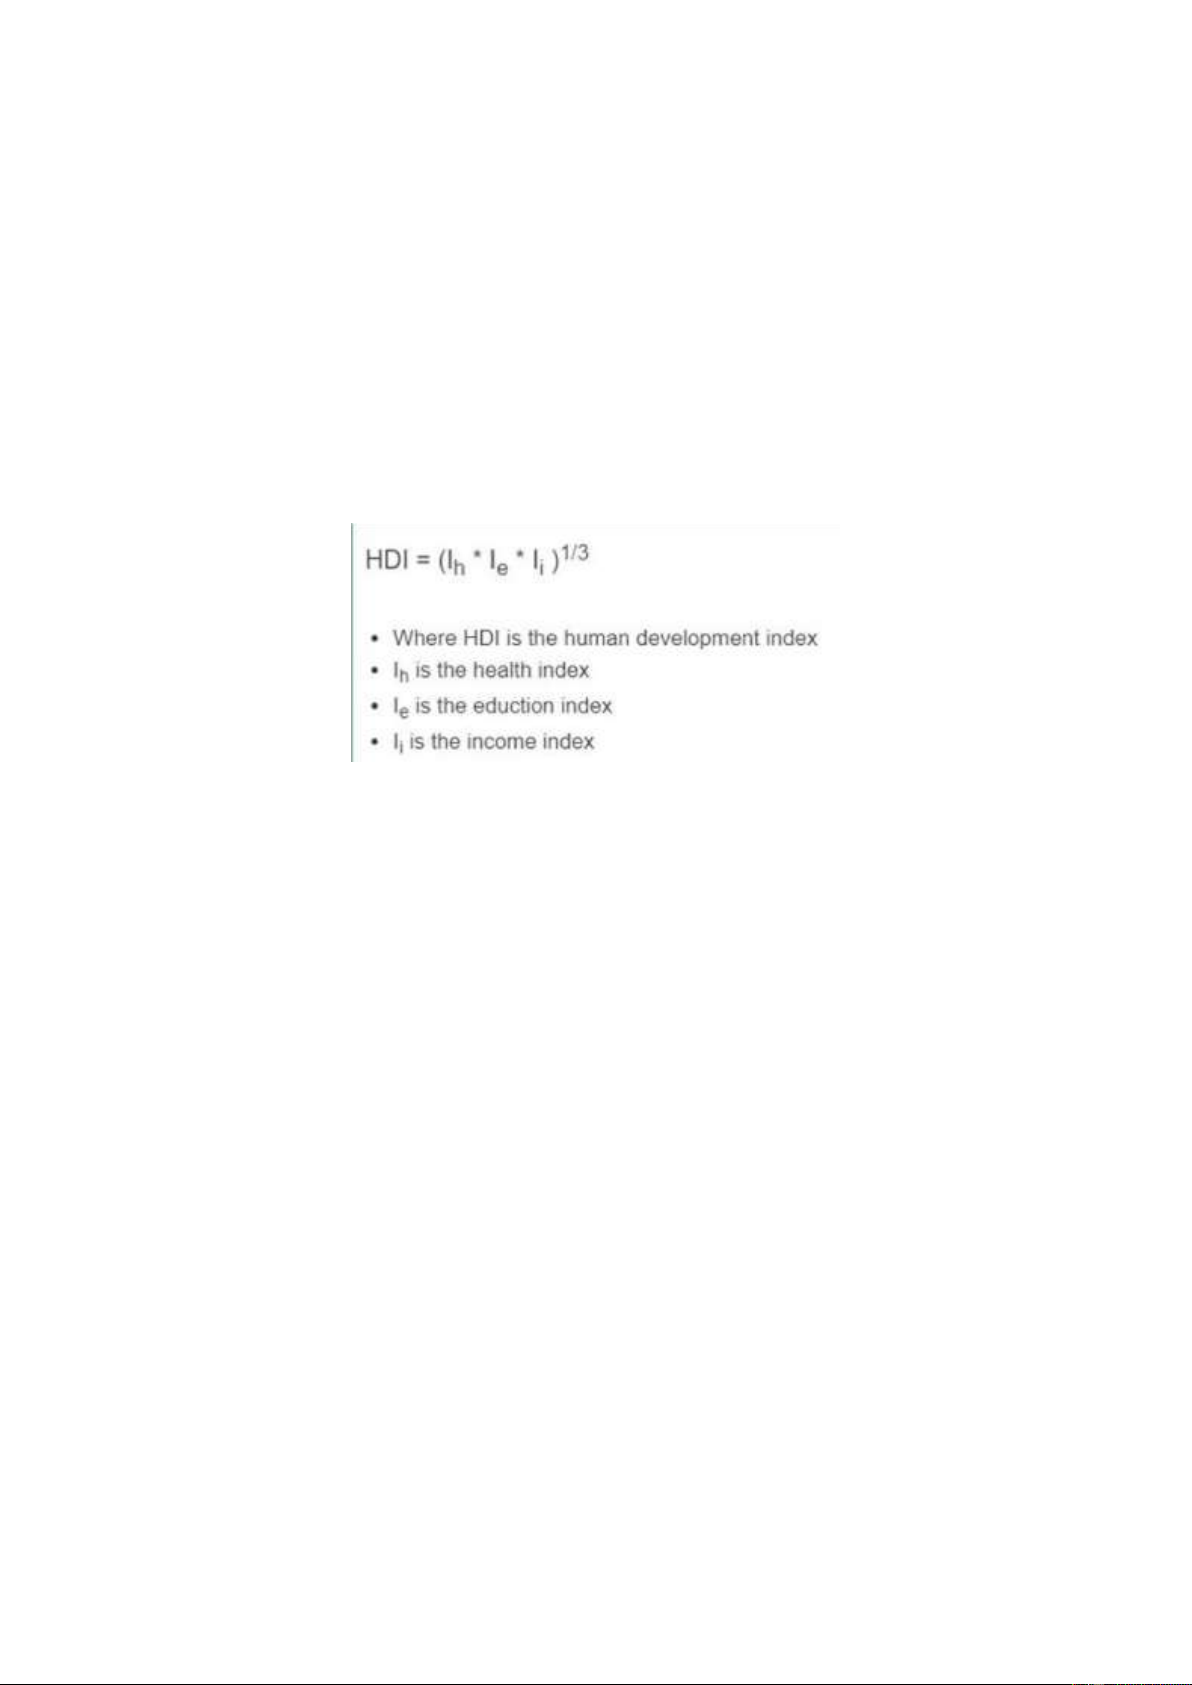
Each of the three dimensions (life expectancy, education, and income) is normalized to a scale of 0 to 1. -
The geometric mean of these normalised indices is then calculated to produce the HDI
value, which ranges from 0 (lowest human development) to 1 (highest human development).
Figure 4: HDI formula References:
Calculator Academy. (n.d.). HDI Calculator 4.1.4 . Categories of HDI : -
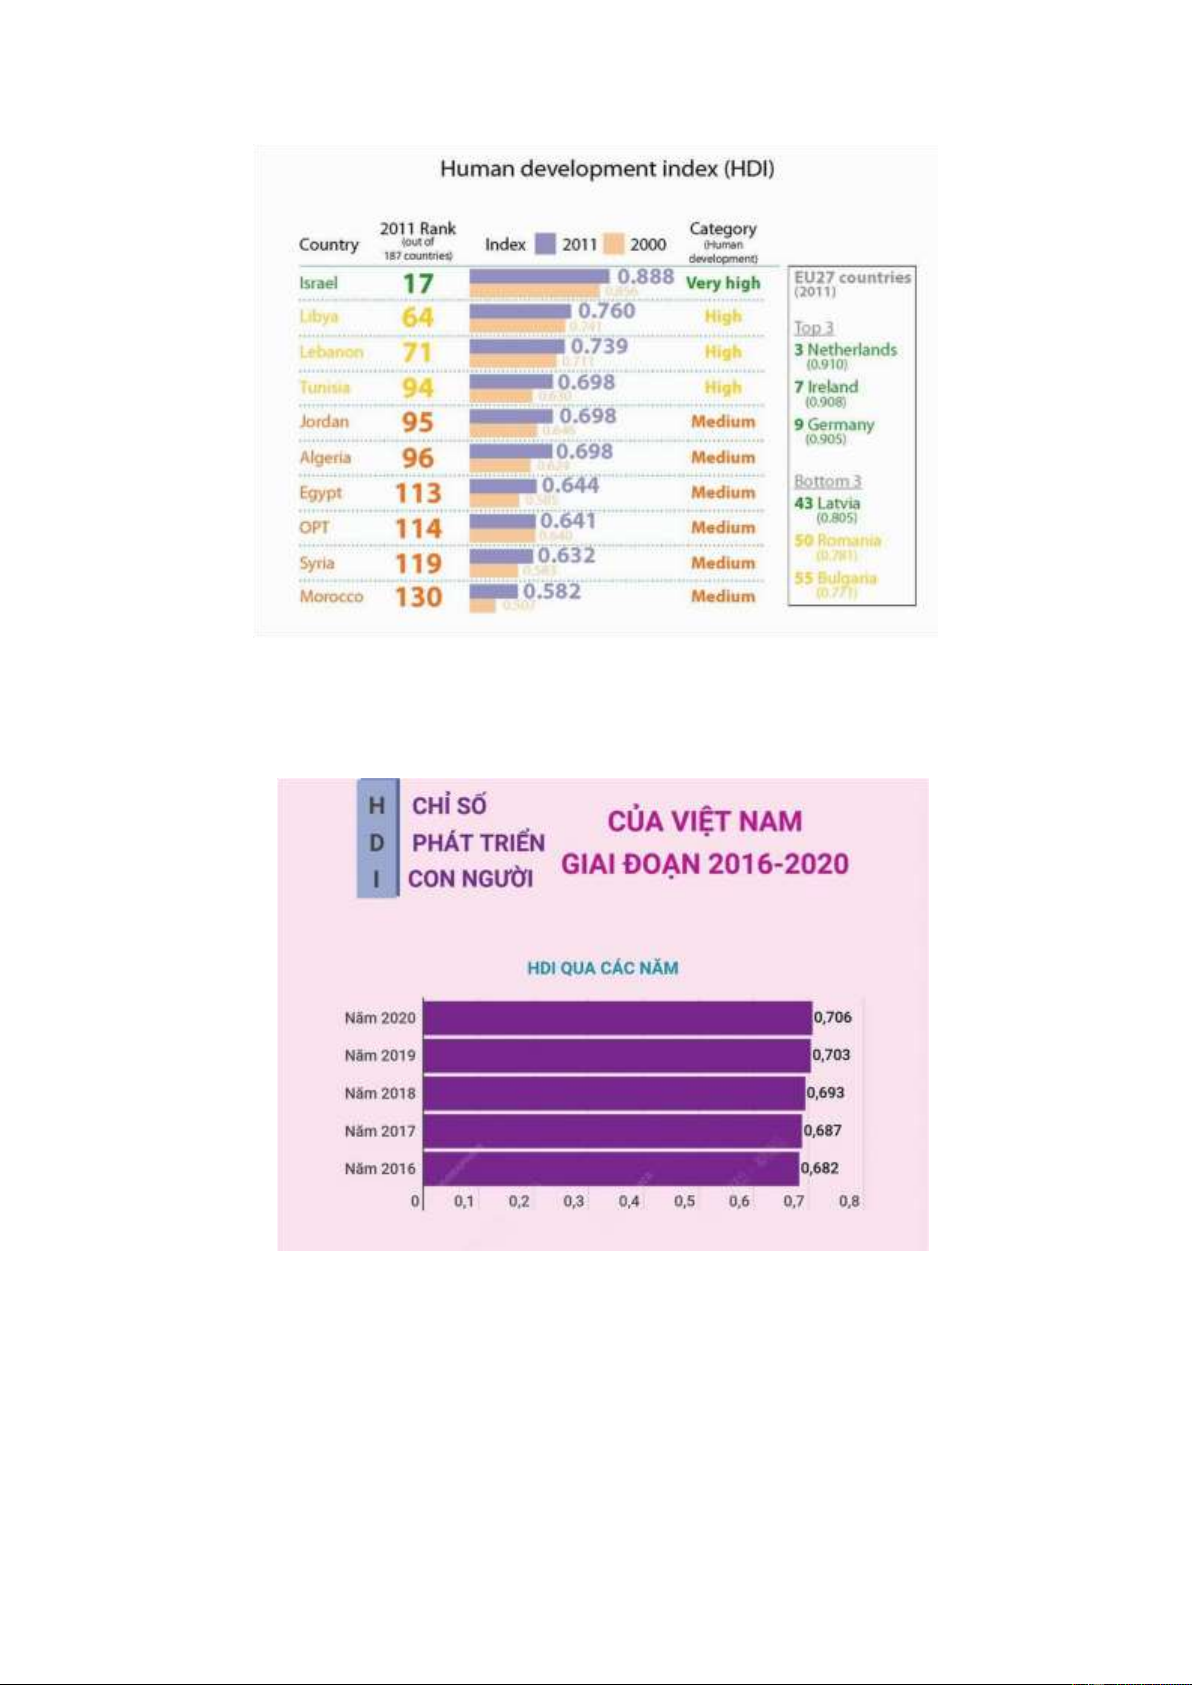
Countries are ranked into different levels of human development :
+ Very High Human Development: HDI of 0.8 and above.
+ High Human Development: HDI between 0.7 and 0.799.
+ Medium Human Development: HDI between 0.55 and 0.699.
+ Low Human Development: HDI below 0.55. 9 lOMoAR cPSD| 48599919
Figure 4: Human development index (HDI) of the EU’s southern Mediterranean neighbours
References: European Parliamentary Research Service. (2013, January 24). The EU’s southern
Mediterranean neighbours. European Parliamentary Research Service.
Figure 5: Vietnam's HDI index from 2016-2020
References: Vietnam News Agency. (n.d.). Giai đoạn 2016-2020: HDI của Việt Nam chuyển
từ nhóm trung bình lên nhóm cao. 4.1.5 . Advantages and Limitations of HDI - Advantages of HDI :
+ Holistic Measure: It integrates multiple aspects of development, offering a more balanced view than GDP alone. 10 lOMoAR cPSD| 48599919
+ Policy Guidance: HDI can help guide policy decisions by highlighting areas where
countries may lag in education or health, despite high income levels.
+ Global Comparisons: It allows for easy comparison of development levels across countries,
helping to identify success stories and areas needing improvement. - Limitations of HDI :
+ Simplicity: While simplicity is a strength, it can also be a limitation as the HDI doesn’t
capture other important aspects of human development such as inequality, environmental
sustainability, or political freedom. -
Data Reliability: The accuracy of HDI depends on the quality of data provided by countries, which can vary.
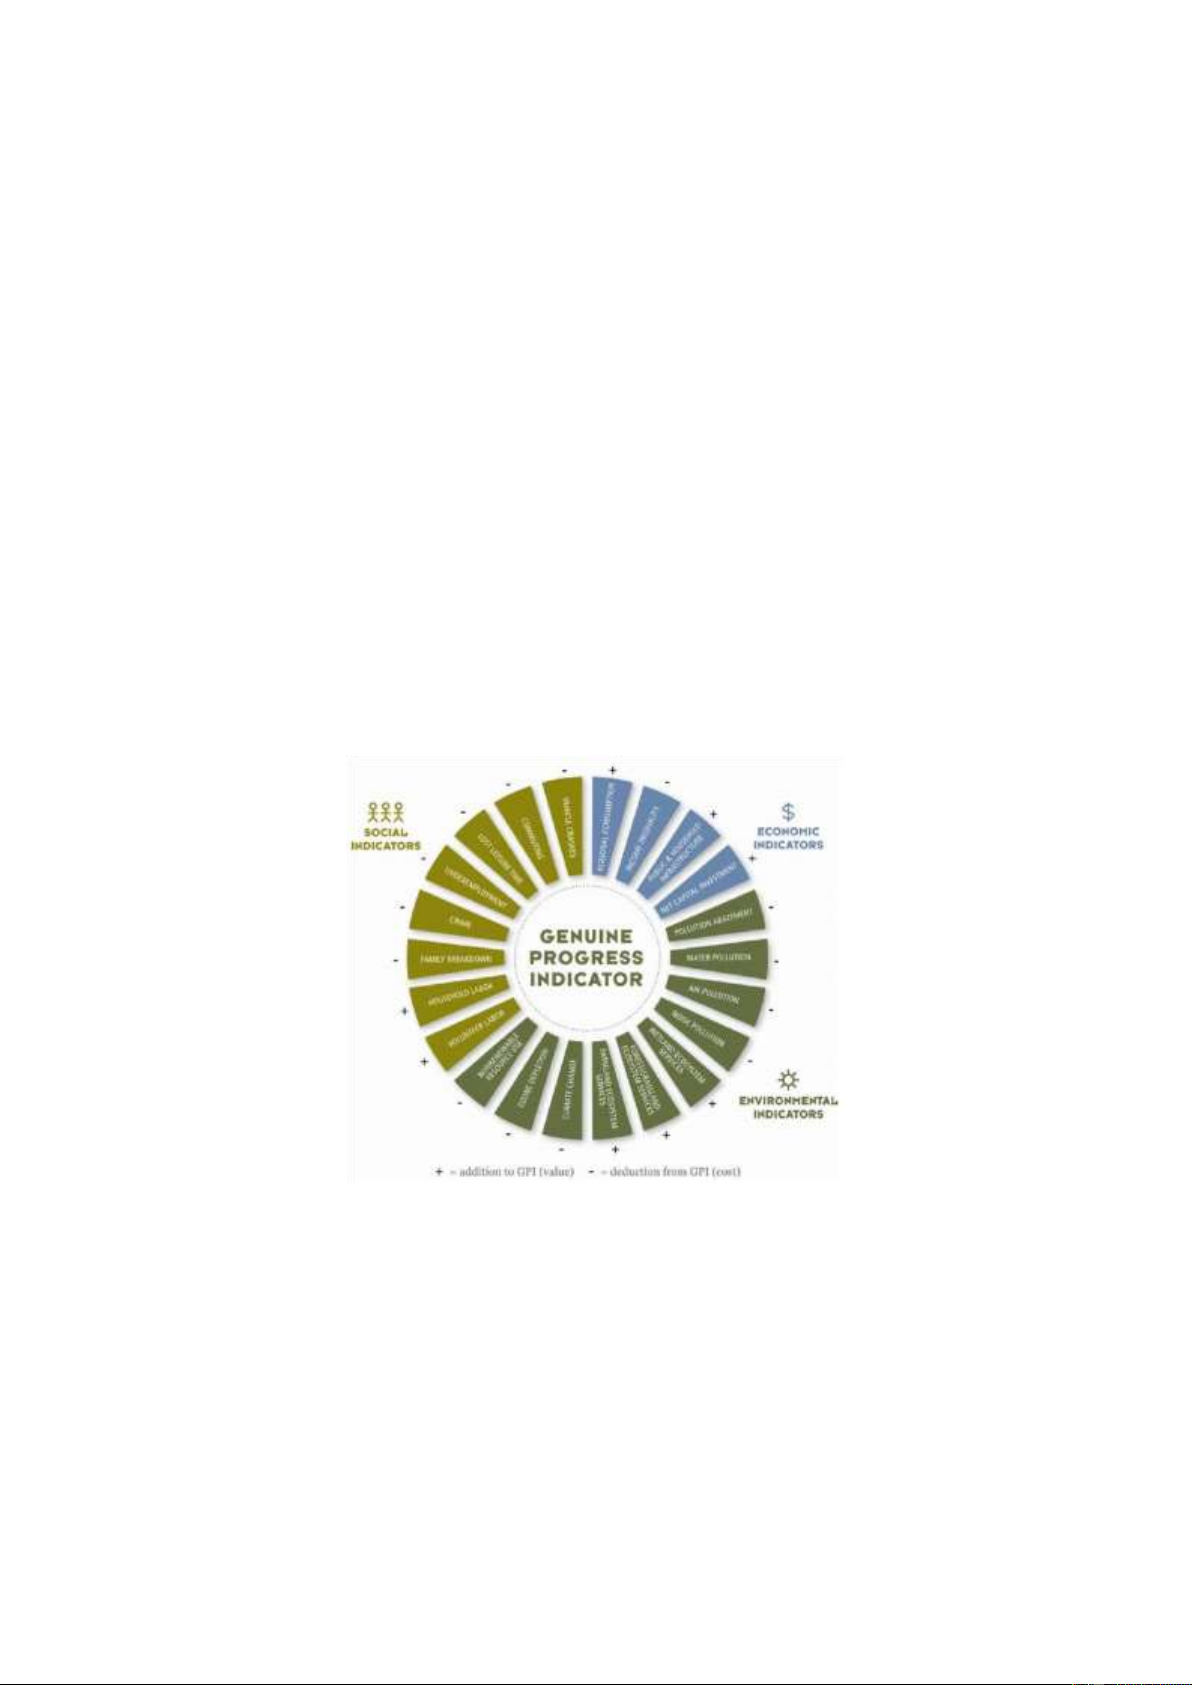
4.2 . Genuine Progress Indicator (GPI ) -
The Genuine Progress Indicator (GPI) is a multi-dimensional composite indicator that
estimates the quantity and distribution of net benefits of the embedded economic system on the
larger social and environmental systems.
References: Kubiszewski, I., Zakariyya, N., & Costanza, R. (2019). The Genuine Progress
Indicator (GPI) as a measure of economic welfare: A review of the literature and prospects.
Figure 6: Factors affecting GPI
References: VietnamBiz. (2020). Chỉ số Tiến bộ Thực (Genuine Progress Indicator - GPI) là
gì? Đặc điểm và so sánh với chỉ số GDP.
4.2.1 . Key Adjustments in GPI : 1. Income Distribution : -
Adjustment: GPI adjusts GDP to reflect income inequality. If wealth is
concentrated among a few, the GPI will show a lower value, indicating that economic
growth benefits only a small portion of the population. 11 lOMoAR cPSD| 48599919 -
Importance: This adjustment highlights the impact of inequality on societal
well-being, emphasizing the need for policies that promote a more equitable distribution of wealth. 2. Environmental Costs : -
Adjustment: GPI subtracts the costs associated with environmental degradation,
such as pollution, deforestation, and resource depletion, from economic growth. -
Importance: This recognizes that economic activities often have negative
environmental impacts that reduce long-term sustainability and quality of life. By
accounting for these costs, GPI provides a more realistic picture of whether economic growth is truly beneficial. 3. Unpaid Work : -
Adjustment: GPI includes the value of non-market activities, such as household
work, caregiving, and volunteer efforts, which are not accounted for in GDP. -
Importance: These activities contribute significantly to societal well-being but
are often overlooked in traditional economic measures. Including them in GPI
underscores their importance in overall economic welfare.
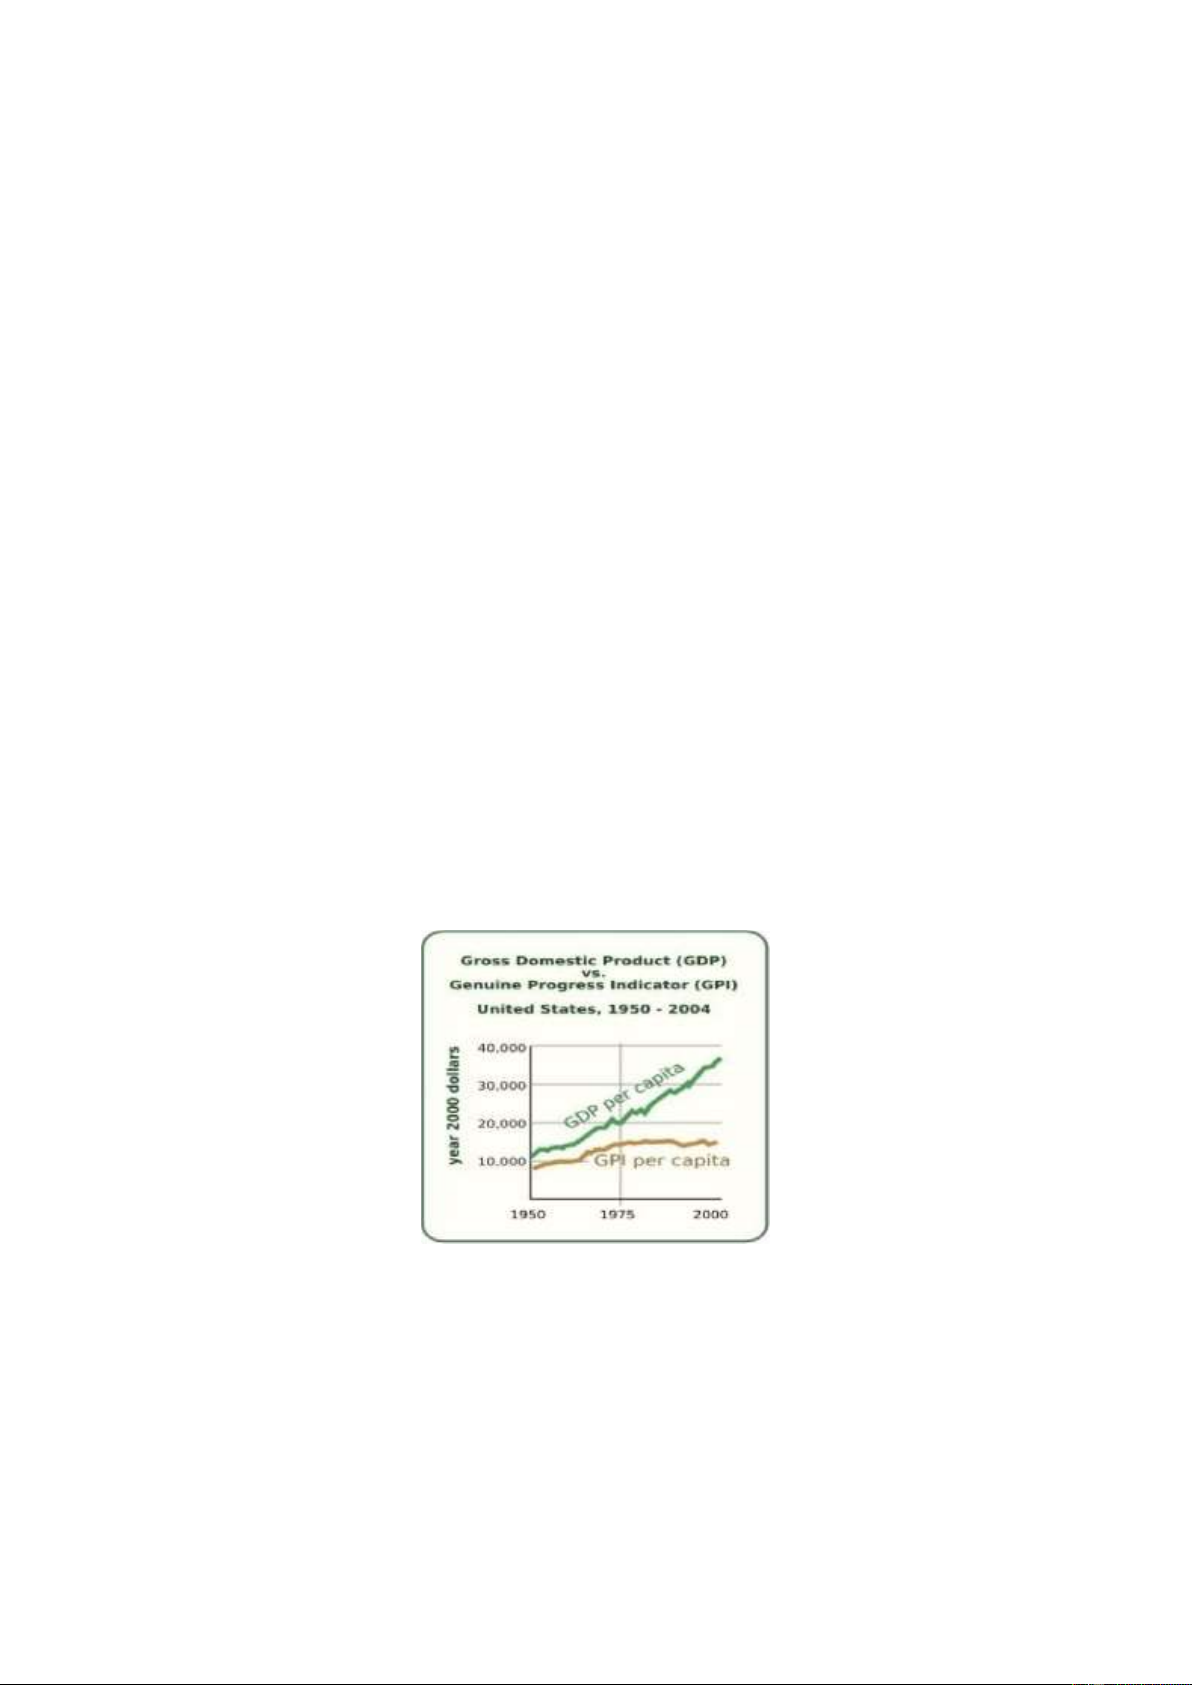
4.2.2 . Other Considerations : -
Social Costs: GPI also deducts the costs of social issues like crime, family breakdown,
and loss of leisure time, which can detract from well-being. -
Public Infrastructure: It adds the value of investments in infrastructure and human
capital, recognizing their long-term benefits.
Figure 7: GDP vs CPI in U.S (1950-2004)
References: Genuine Progress Indicator. (2024, August 31). Genuine progress indicator. In
Wikipedia, The Free Encyclopedia.
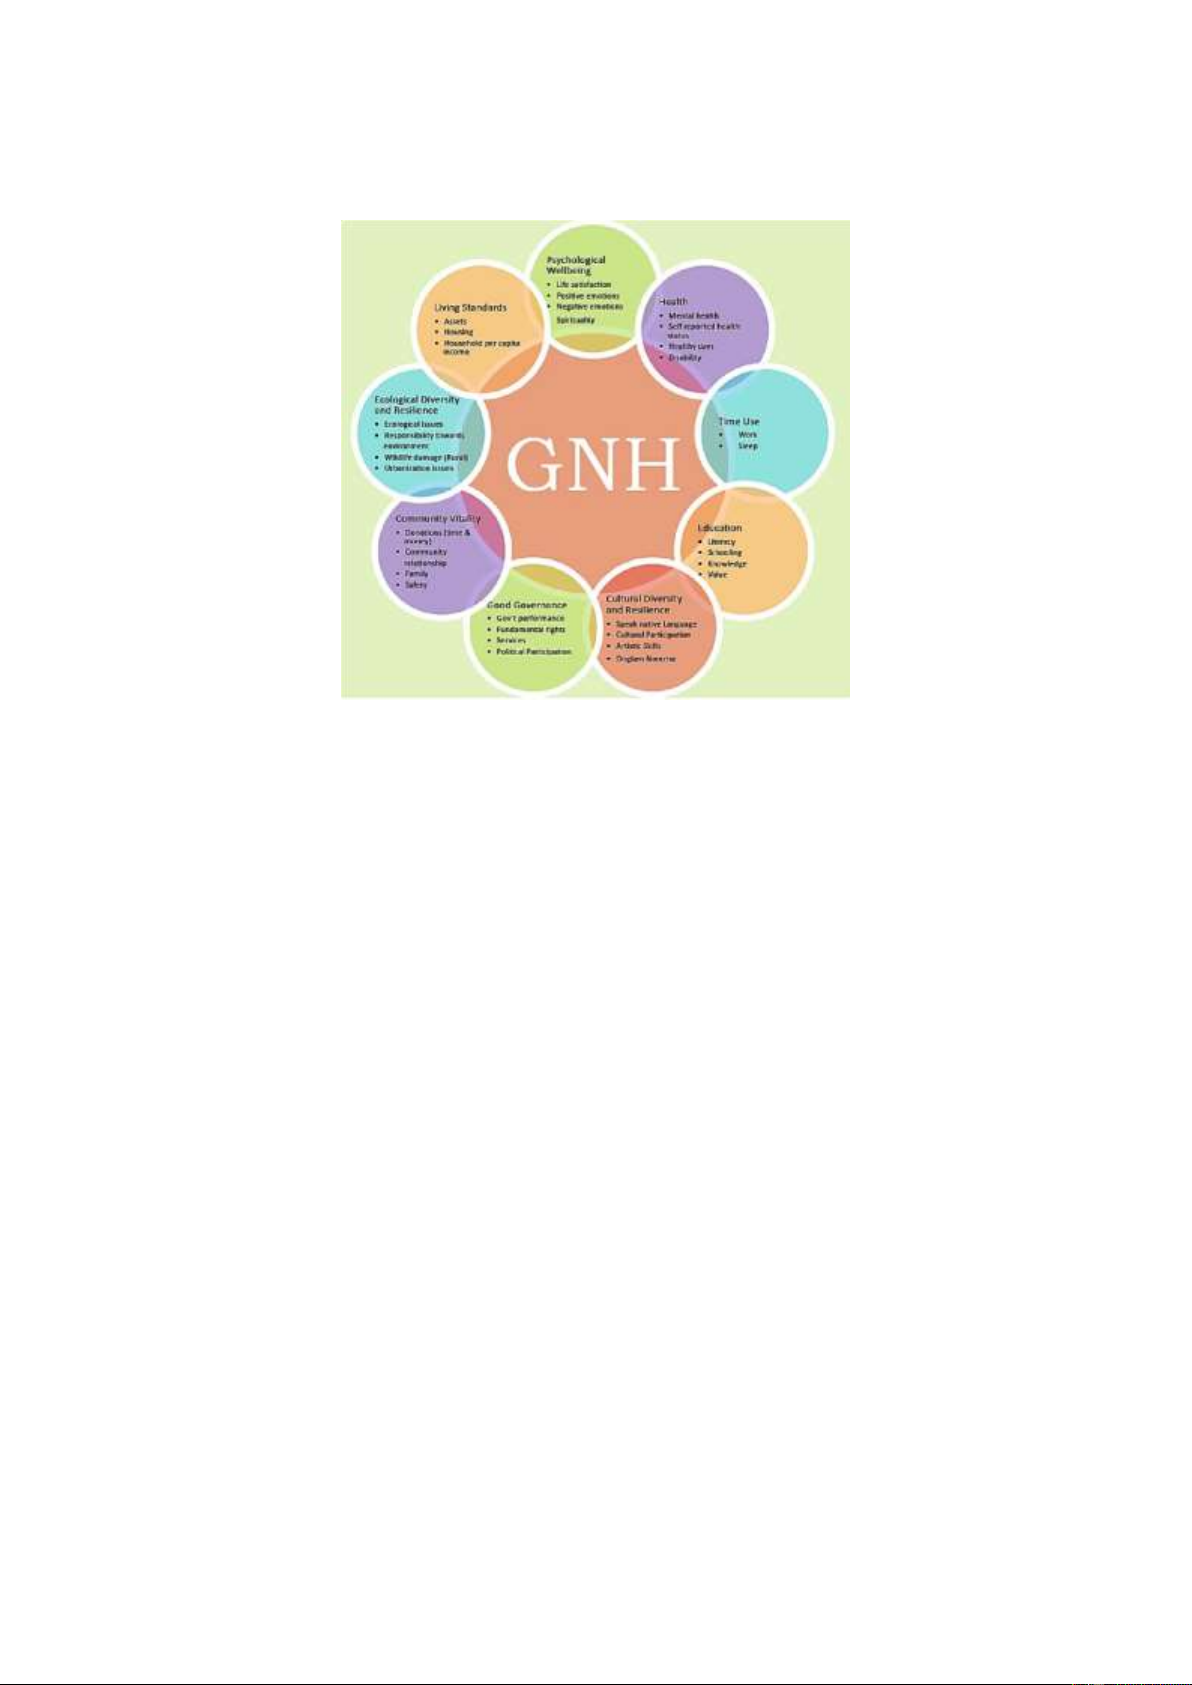
4.3 . Gross National Happiness (GNH )
- Gross National Happiness (GNH) is an interesting concept developed by Bhutan as a
measure of well-being that goes beyond traditional economic indicators like GDP. It focuses
on the holistic development of society and aims to ensure that economic progress is balanced 12 lOMoAR cPSD| 48599919
with the enhancement of cultural, environmental, and spiritual well-being. The GNH
framework includes nine domains:
Figure 8: GNH 9 Domains of Measurement References:
Gross National Happiness USA. (n.d.). Gross national happiness. 1.
Psychological Well-being: Happiness, mental health, and life satisfaction. 2.
Health: Physical health, access to healthcare, and health services. 3.
Education: Access to education, quality of education, and lifelong learning. 4.
Time Use: Work-life balance and the time available for leisure and family. 5.
Cultural Diversity and Resilience: Preservation of cultural heritage and the ability to adapt to changes. 6.
Good Governance: Participation in decision-making processes and the effectiveness of governance. 7.
Community Vitality: Social cohesion, community support, and the strength of social networks. 8.
Ecological Diversity and Resilience: Environmental sustainability and the
preservation of natural resources. 9.
Living Standards: Basic material needs and economic security.
References: Investopedia. (n.d.). Gross national happiness (GNH). Investopedia.
Retrieved September 4, 2024 13 lOMoAR cPSD| 48599919
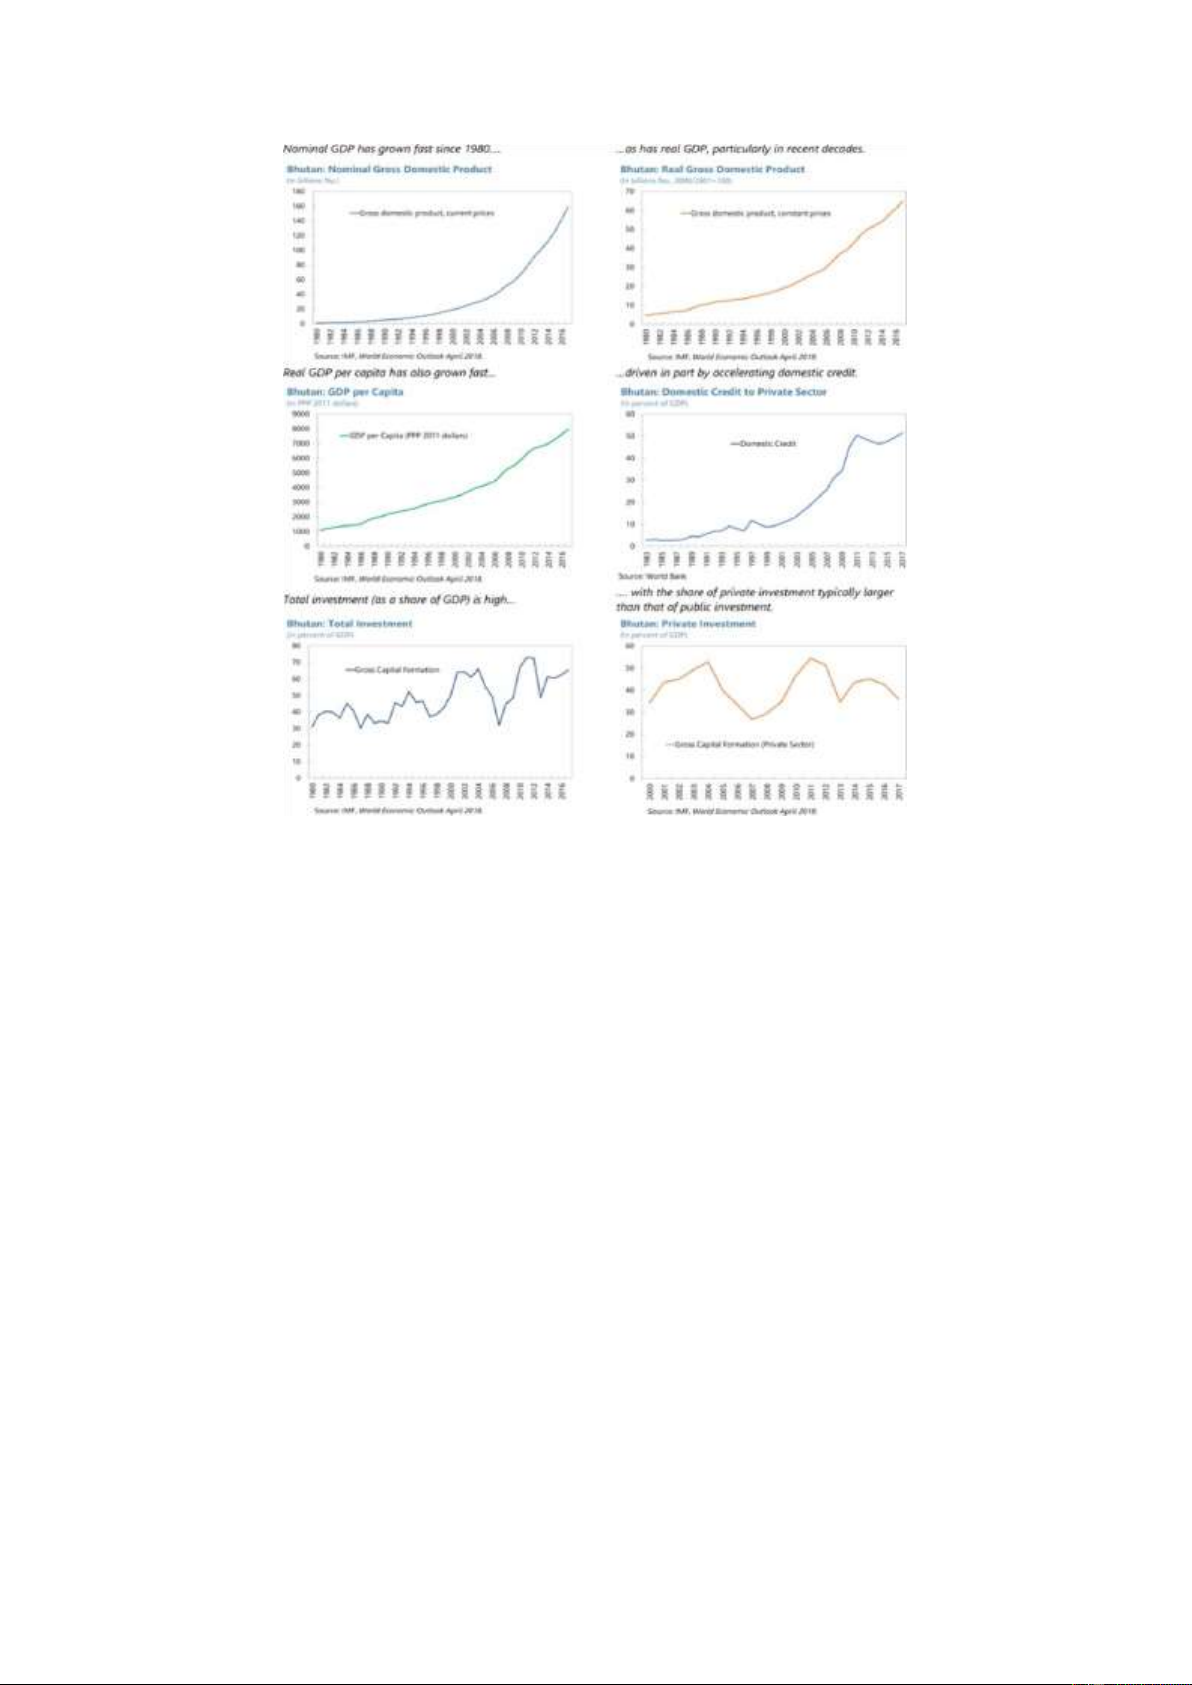
Figure 9: Bhutan: Macroeconomic Developments 1980–2017
References: Sachs, J. D., & McArthur, J. W. (2019). The role of the International Monetary
Fund in a new global development agenda. IMF eLibrary. - Advantage :
+ Holistic Perspective: GNH provides a comprehensive view of well-being that includes
psychological health, cultural preservation, and environmental sustainability. This holistic
approach ensures that development considers multiple dimensions of human life, not just
economic growth. For example, by focusing on community support and mental health, GNH
promotes a more balanced and fulfilling quality of life.
References: Investopedia. (n.d.). Gross national happiness (GNH). Investopedia. - Limitation :
+ Subjectivity of Measures: The subjective nature of happiness and well-being assessments
can make it challenging to accurately measure and compare these aspects across different
contexts. Variations in personal perceptions and cultural norms can affect the reliability of self-
reported data, potentially leading to inconsistencies in assessing true wellbeing.
4.4 . SocialProgress Index (SPI ): -
The Social Progress Index (SPI) measures the well-being of a society by observing
social and environmental outcomes directly rather than the economic factors. The social and 14 lOMoAR cPSD| 48599919
environmental factors include wellness (including health, shelter and sanitation), equality,
inclusion, sustainability and personal freedom and safety
References: Social Progress Index. (2024, August 31). Social progress index. In Wikipedia, The Free Encyclopedia
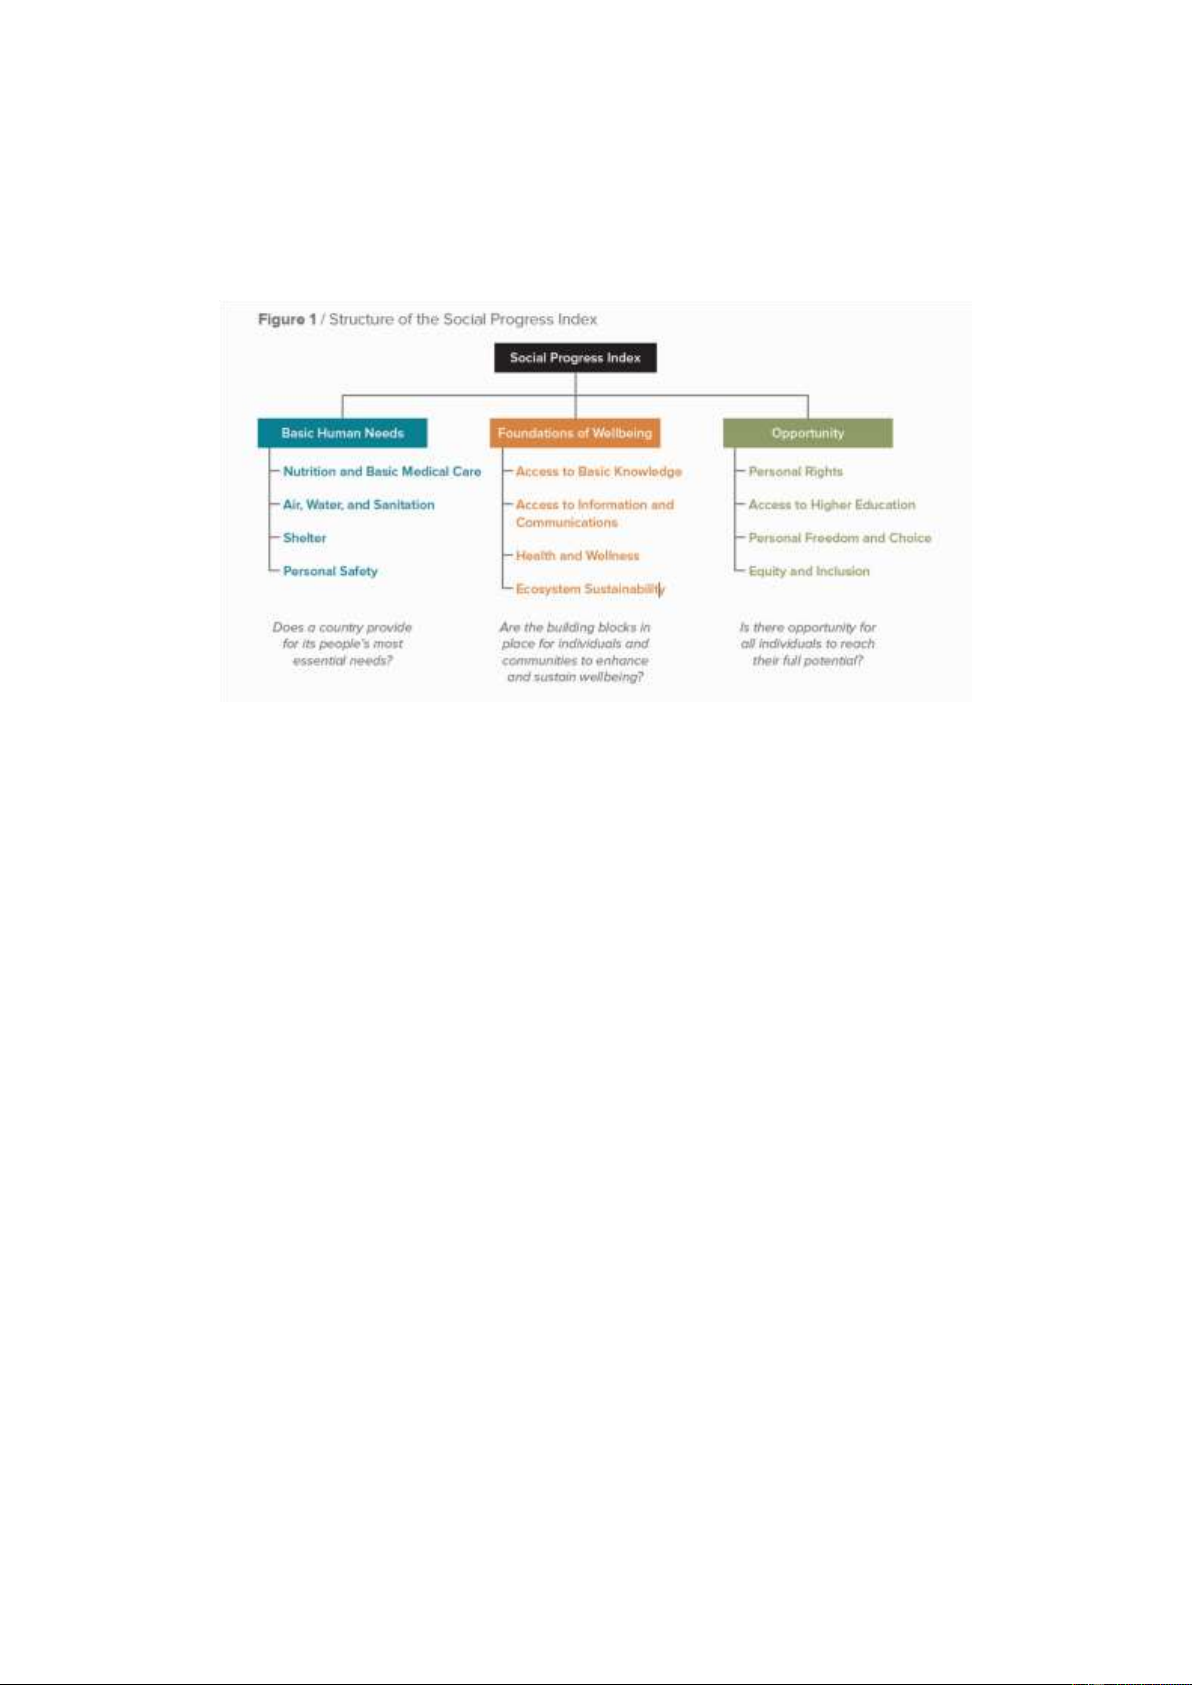
Figure 10: Structure of the Social Progress Index
References: Moran, J. (2013, April 12). The social progress index: An introduction. * Key Focus Areas of SPI: - Basic Human Needs :
• Indicators: Access to clean water and sanitation, adequate food and nutrition, housing, and personal safety.
• Measurement: Evaluates how well basic needs are met for all members of society,
providing a foundation for overall well-being. - Foundations of Well-being :
• Indicators: Access to basic education, health care, and information. Includes indicators
like literacy rates and child mortality.
• Measurement: Assesses the availability and quality of essential services that support
personal development and health. - Opportunity :
• Indicators: Personal freedom and choice, tolerance and inclusion, and access to higher
education and economic opportunities.
• Measurement: Examines the extent to which individuals have opportunities to improve
their lives and participate fully in society. 15 lOMoAR cPSD| 48599919
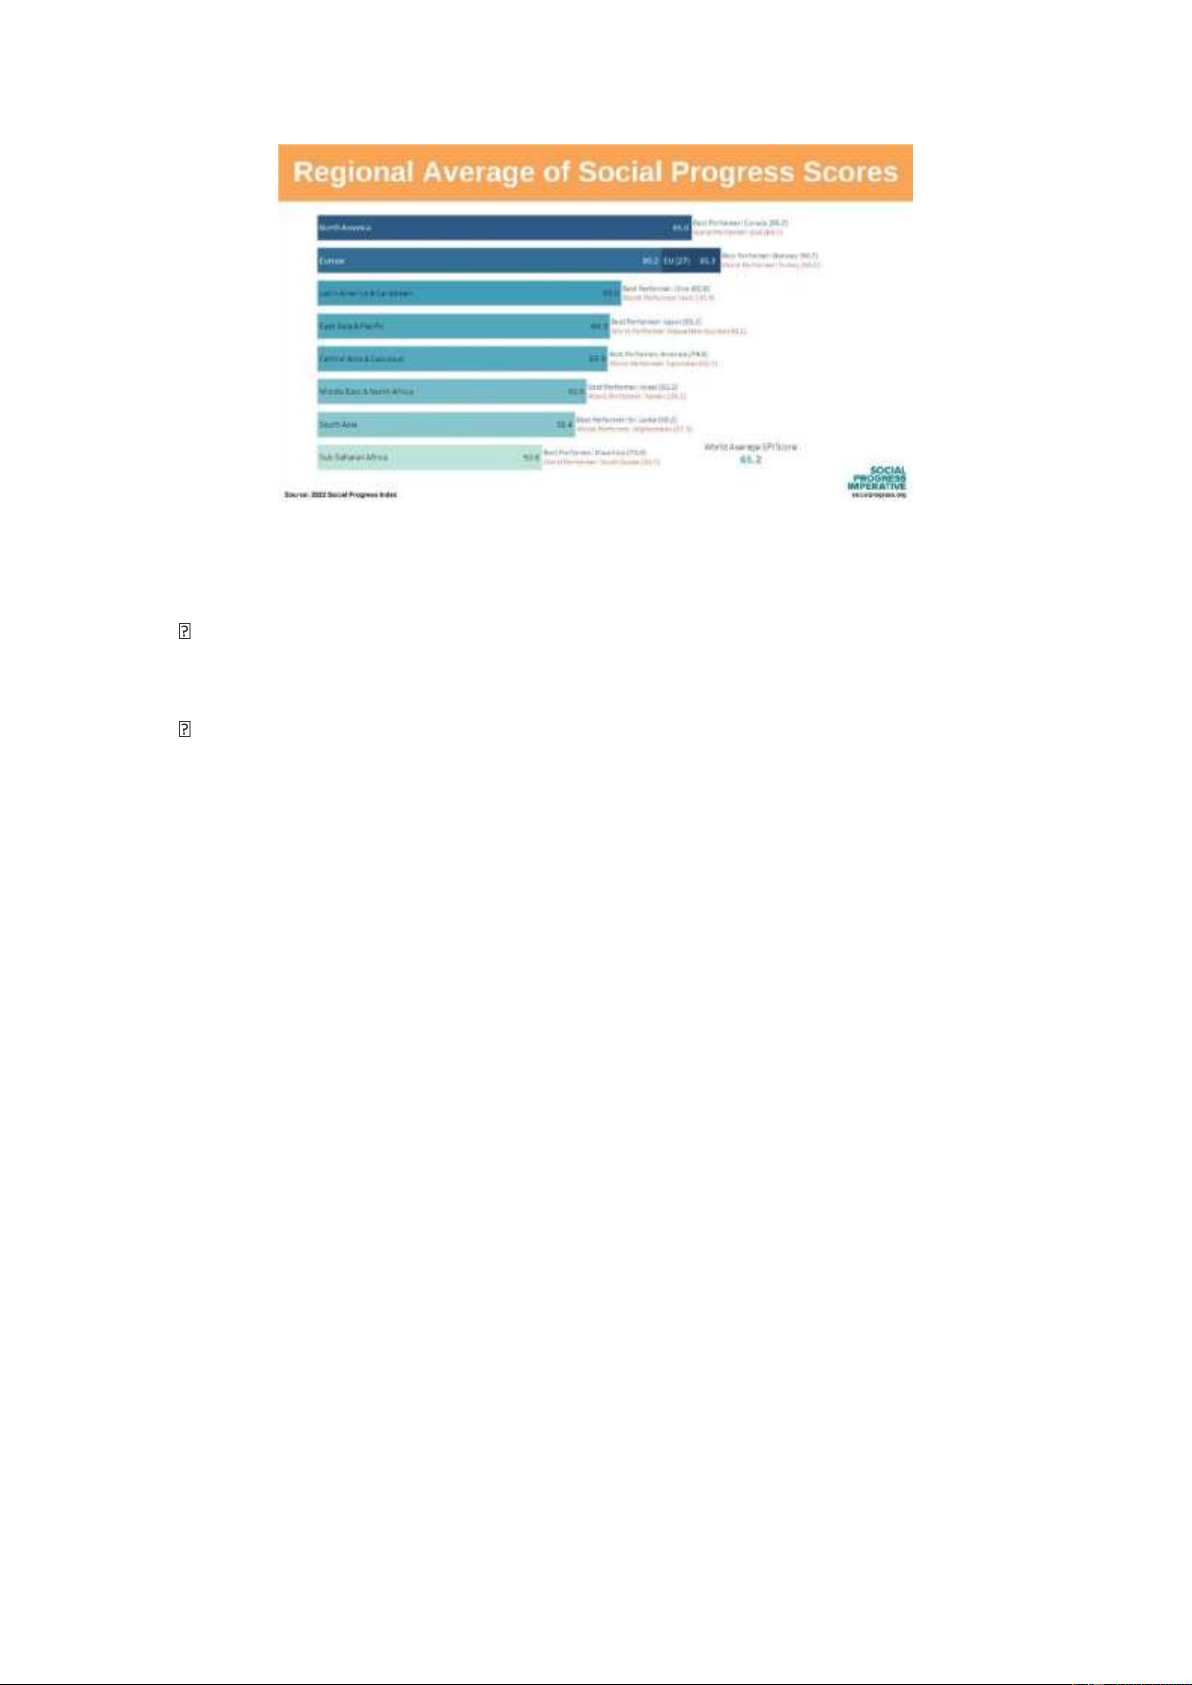
Figure 11: 2020 Social Progress Index
References: Social Progress Imperative. (n.d.). Social progress across the world’s regions.
A significant disparity in social progress across the regions of the world is observed.
While North America (85.0 points) and Europe (80.2 points) outperform other regions,
South Asia (58.4 points) and Sub-Saharan Africa (50.8 points) are obvious laggards.
Most regions are lacking in the component of inclusiveness. It is a particular bottleneck
for Middle East & North African countries. - Advantage :
+ Holistic Assessment: SPI offers a comprehensive view of societal well-being by
incorporating social and environmental indicators. This approach highlights areas like safety,
education, and environmental health, which are crucial for understanding the quality of life
beyond just economic measures. - Limitation :
+ Data Availability Issues: The effectiveness of SPI can be limited by the availability and
reliability of data, especially in lower-income or conflict-affected regions. This can affect the
accuracy and completeness of the index in assessing well-being across different contexts. 5 . Case Studies 5.1 Country Comparisons
5.1.1 Examples of countries with high GDP but low well-being (e.g., high inequality) a. United States 16 lOMoAR cPSD| 48599919
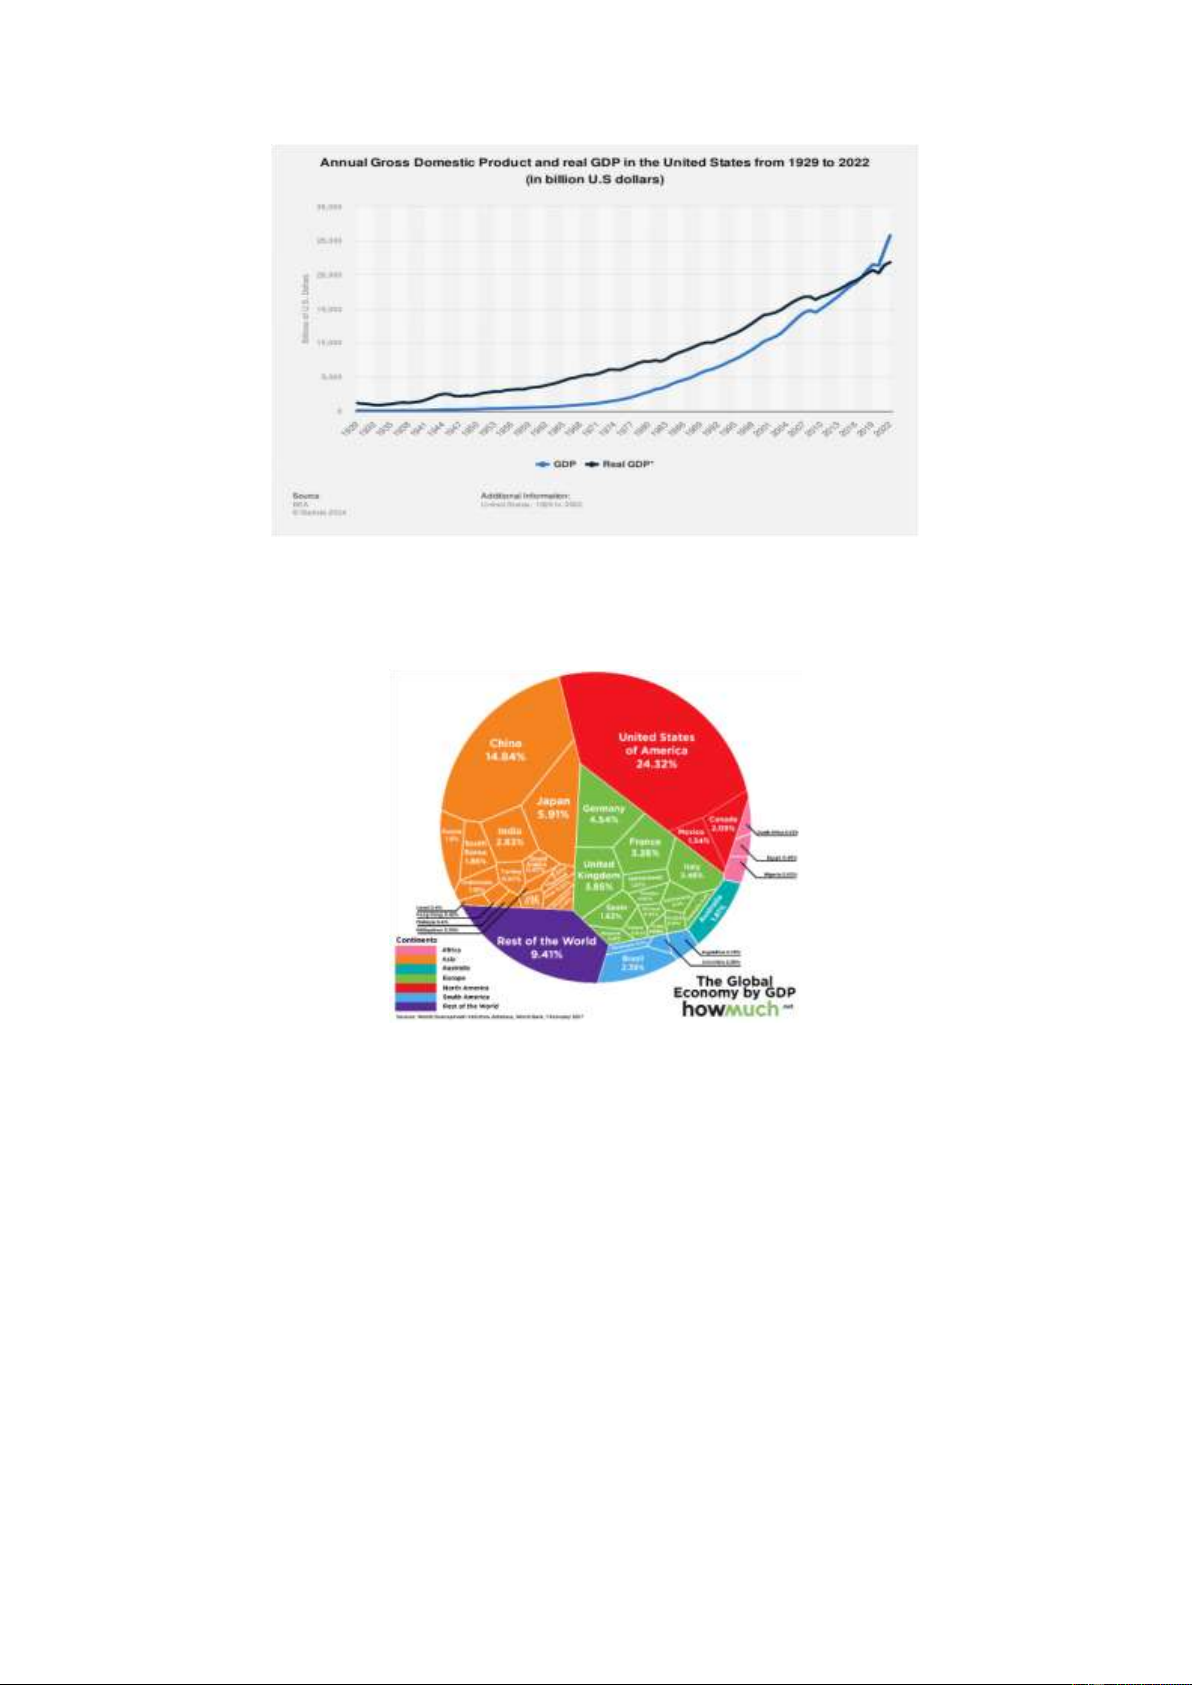
Figure 12: GDP and Real GDP of the U.S (1929-2022) References:
Oramerlina. (n.d.). US GDP Growth 2024
Figure 13: World GDP chart References:
Mungfali. (n.d.). World GDP Chart.
• High GDP: The U.S. consistently ranks among the top economies globally in terms of
GDP. America’s gross domestic product in 2022 was more than 40% greater than that
of China, the world No. 2. Even more striking, U.S. GDP was over five times that of
the next two largest economies, Japan and Germany.
References: U.S. News & World Report. (n.d.). The top 10 economies in the world.
• Income Inequality: The U.S. has one of the highest levels of income inequality in
developed nations. The wealth gap between the rich and poor is significant, with top
earners capturing a disproportionate share of income growth.
• Health and Social Issues: Despite its wealth, access to affordable healthcare is limited
for many, and life expectancy is lower than in other developed nations. High housing
costs, student debt, and disparities in education also contribute to lower overall
wellbeing for parts of the population. 17 lOMoAR cPSD| 48599919 b. Qatar
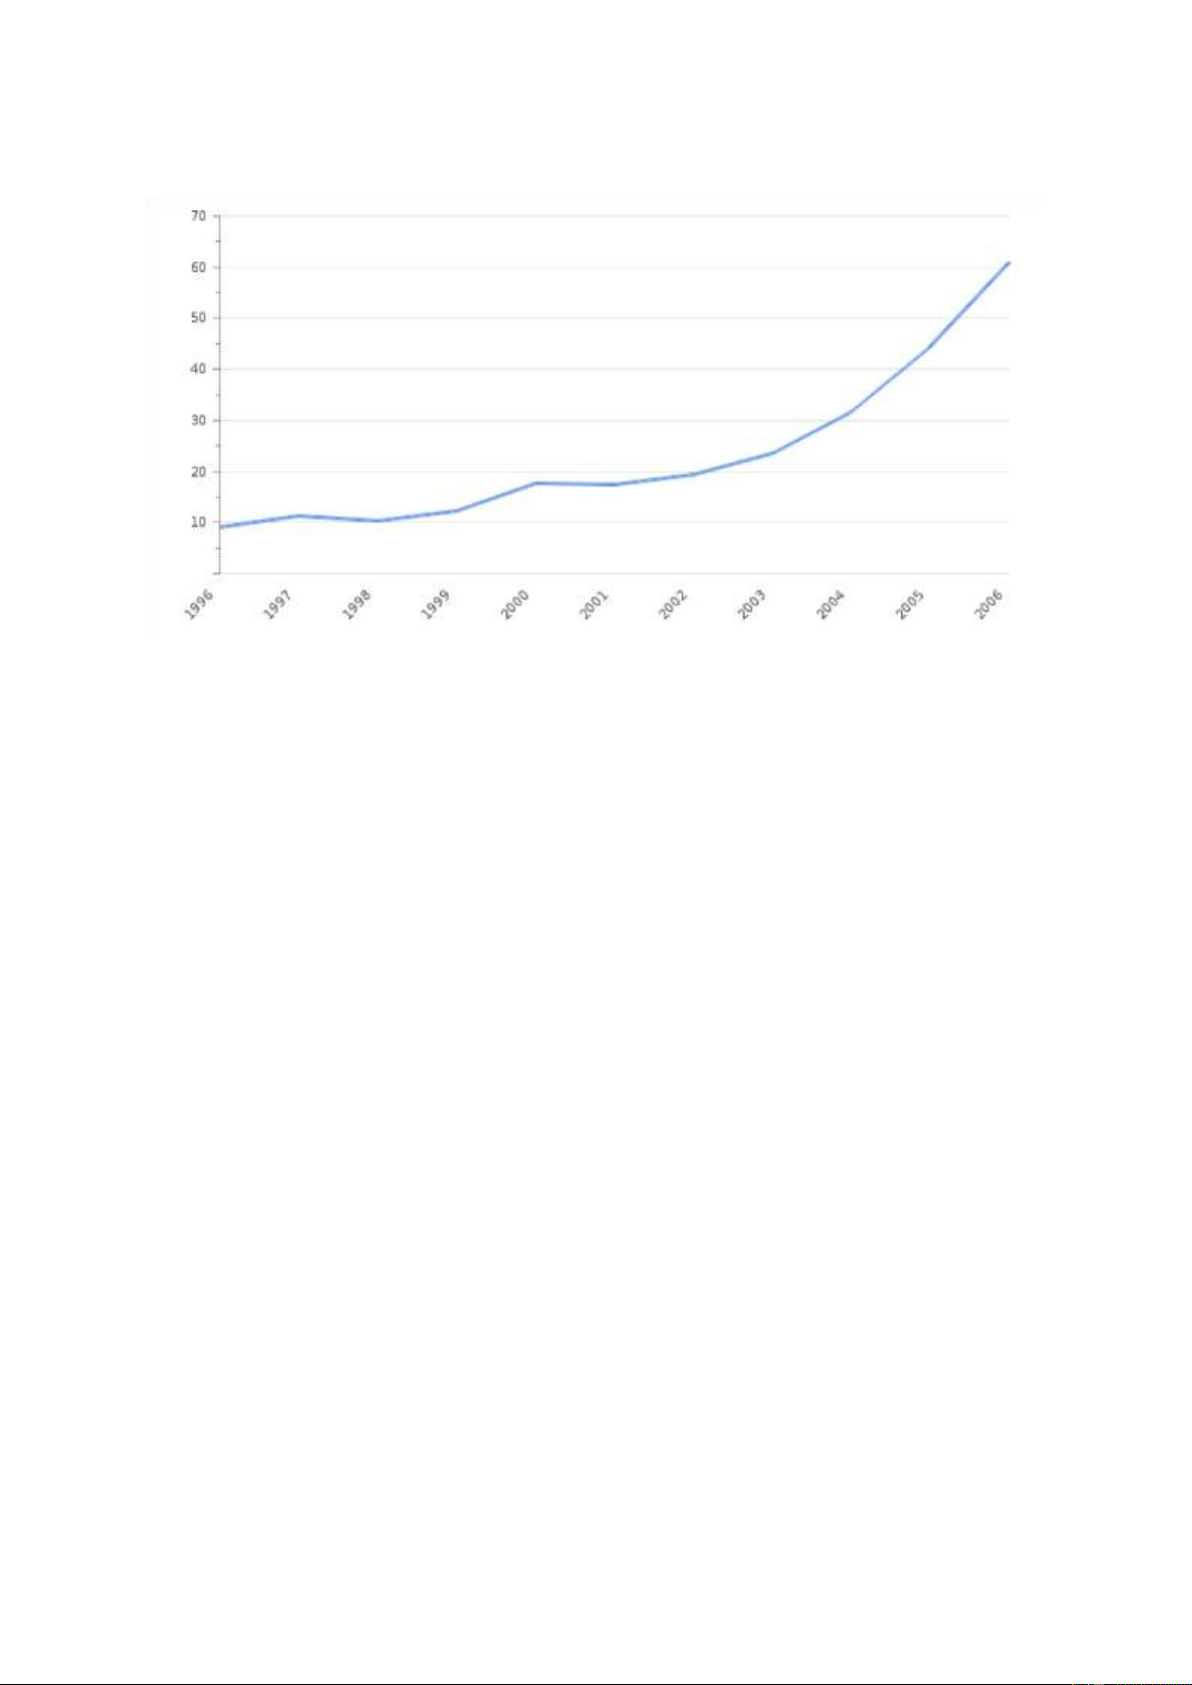
Figure 14: Quatar GDP per Capital (1996-2005) References:
Take-profit.org. (n.d.). Qatar GDP.
• High GDP per Capita: Qatar has one of the highest GDP per capita figures. The GDP
per Capita in Qatar is equivalent to 502 per cent of the world's average. GDP per Capita
in Qatar averaged 61778.97 USD from 2000 until 2022, reaching an all-time high of
73493.27 USD in 2011 and a record low of 51565.05 USD in 2001, driven by its vast oil and gas reserves.
References: Trading Economics. (n.d.). Qatar GDP per capita.
• Inequality Among Migrant Workers: While its citizens enjoy high living standards, the
country faces criticism for the treatment of its large migrant labour force, who often
live and work in poor conditions.
• Migrant workers make up the majority of the workforce and experience limited legal
protections and low wages, affecting their well-being despite Qatar's high GDP.
• Wealth Disparity: The wealth generated from oil primarily benefits Qatari citizens,
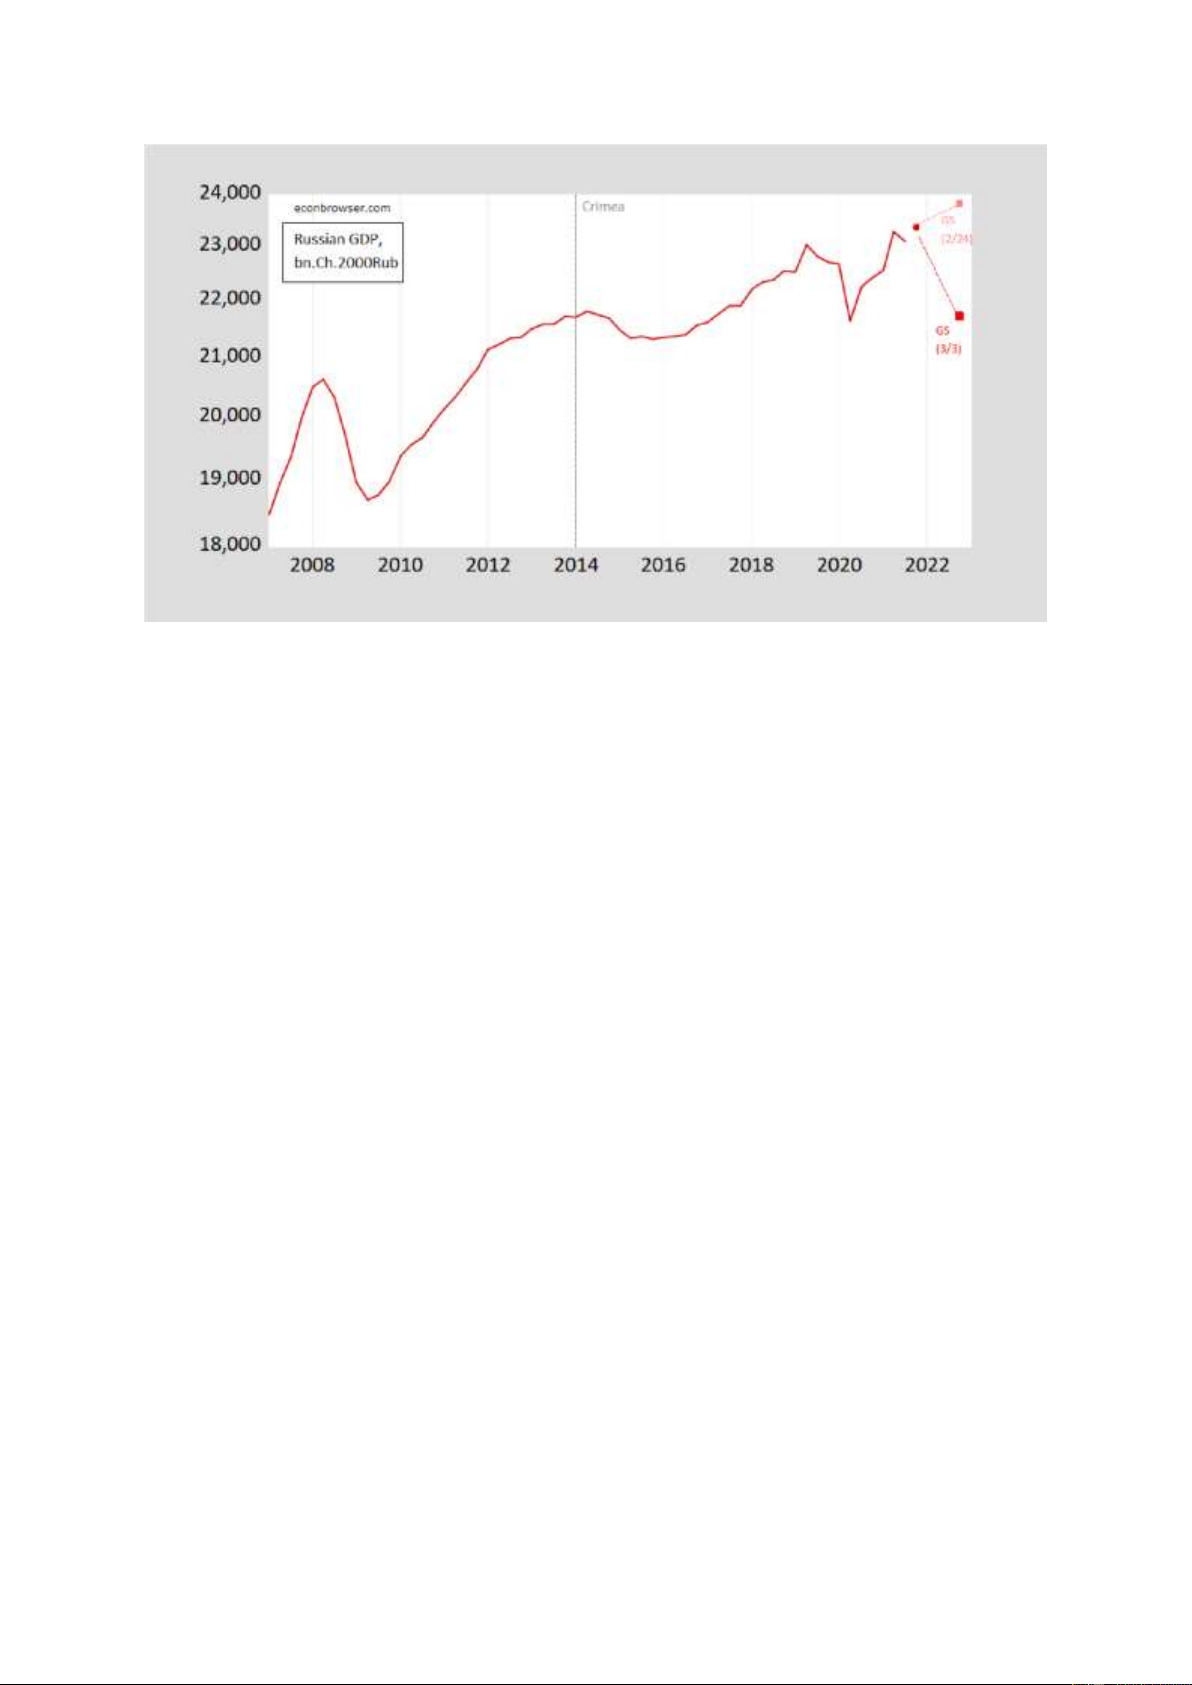
leading to disparities in living standards within the population. c. Russia: 18 lOMoAR cPSD| 48599919
Figure 15: Russian GDP in billions Ch.2000Rubles (red), IMF January WEO forecast (red
circle), GS forecasts of 3/3 (red square), of 2/24 (salmon square), all on a log scale. Levels
for 2021Q4, 2022Q4 were calculated using growth rates.
References: OECD via FRED, IMF, Goldman Sachs, and author’s calculations.
• High GDP: Russia has a large economy, primarily driven by natural resources like oil
and gas. Russia’s economy is significantly influenced by its vast natural resources.
Natural resources like oil and gas contribute to about 60% of Russia’s GDP. This heavy
reliance on natural resources makes Russia one of the world’s top oil and natural gas producers.
• Income Disparities: Economic gains are unevenly distributed, with a significant
proportion of wealth concentrated in the hands of a small elite, while many regions suffer from poverty.
• Social Well-being: Health outcomes, such as life expectancy, remain lower compared
to other countries with similar GDP levels. Issues like political instability, corruption,
and inadequate healthcare further contribute to lower levels of well-being for much of the population.
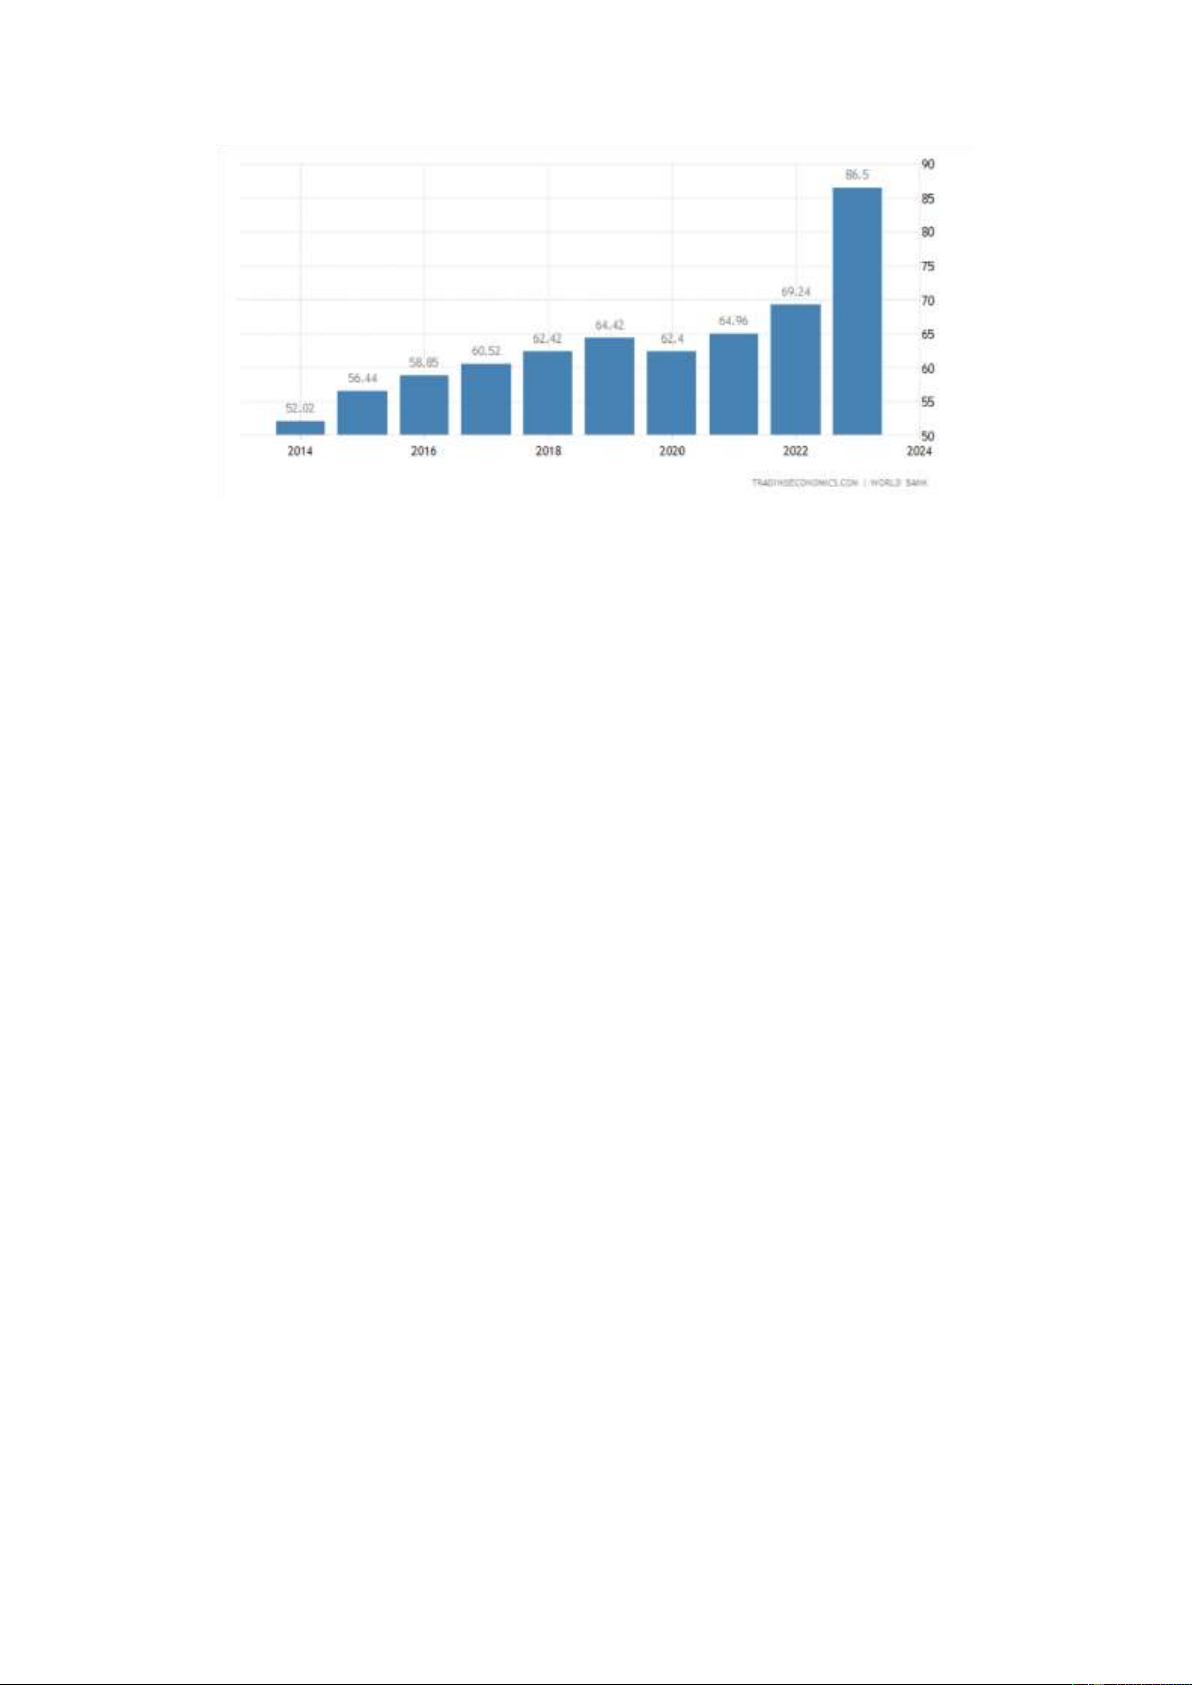
5.1.2 Examples of countries with low GDP but high well-being (e.g., strong social systems) a. Costa Rica: 19 lOMoAR cPSD| 48599919
Figure 16: Costa Rica GDP (2014-2024) References:
Trading Economics. (n.d.). Costa Rica GDP.
• Low GDP: Costa Rica's economy is smaller than those of developed nations, but it is
still relatively stable. The Gross Domestic Product (GDP) in Costa Rica was worth
86.50 billion US dollars in 2023, according to official data from the World Bank. The
GDP value of Costa Rica represents 0.08 per cent of the world economy.
References: Trading Economics. (n.d.). Costa Rica GDP.
• High Well-being: The country prioritizes education, healthcare, and environmental
sustainability. It has no military, diverting resources to social services, which results in
high life expectancy and consistently high rankings in the Happy Planet Index. Costa
Rica has universal healthcare and free public education.
• Environmental Focus: Nearly all of Costa Rica’s energy comes from renewable
sources, and the government prioritizes sustainability and conservation, contributing to
the population's overall well-being. b. Bhutan
• Low GDP: Bhutan’s economy is small and largely rural, with agriculture and
hydropower being the main sectors. Bhutan is among the richest by gross domestic
product (nominal) per capita in South Asia, at $3,491 as of 2022, but it still places
153rd, and among the poorest in the world. The total gross domestic product is only
$2,653 million, and 178th according to IMF.
References: Wikipedia. (n.d.). Economy of Bhutan.
• High Well-being: Bhutan measures success through Gross National Happiness (GNH),
emphasizing well-being over material wealth. GNH includes metrics like psychological
well-being, community vitality, and environmental conservation.
• Environmental and Cultural Emphasis: Bhutan places a strong emphasis on maintaining
its cultural heritage and protecting the environment, with policies focused on
sustainable development, which has led to a high sense of life satisfaction. c. New Zealand 20
Tài liệu liên quan:
-
Chương 2 độ co giãn cầu, cung và lý thuyết hành vi Người tiêu dùng môn Kinh tế học vĩ mô | Học viện Nông nghiệp Việt Nam
147 74 -
Chương 2 độ co giãn cầu, cung và lý thuyết hành vi Người tiêu dùng (4) môn Kinh tế học vĩ mô | Học viện Nông nghiệp Việt Nam
199 100 -
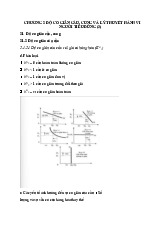
Chương 2 độ co giãn cầu, cung và lý thuyết hành vi Người tiêu dùng (3) môn Kinh tế học vĩ mô | Học viện Nông nghiệp Việt Nam
149 75 -
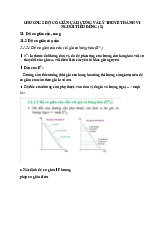
Chương 2 độ co giãn cầu, cung và lý thuyết hành vi Người tiêu dùng (2) môn Kinh tế học vĩ mô | Học viện Nông nghiệp Việt Nam
134 67 -

Lý thuyết hành vi của doanh nghiệp Chương 4 môn Kinh tế học vĩ mô | Học viện Nông nghiệp Việt Nam
154 77