Jll vietnam property market overview 4q20 2020 q4 Tài liệu tham khảo | Đại học Hoa Sen
Jll vietnam property market overview 4q20 2020 q4 Tài liệu tham khảo | Đại học Hoa Sen và thông tin bổ ích giúp sinh viên tham khảo, ôn luyện và phục vụ nhu cầu học tập của mình cụ thể là có định hướng, ôn tập, nắm vững kiến thức môn học và làm bài tốt trong những bài kiểm tra, bài tiểu luận, bài tập kết thúc học phần, từ đó học tập tốt và có kết quả cao cũng như có thể vận dụng tốt những kiến thức mình đã học.
Môn: Econnomics (Econ 101) 78 tài liệu
Trường: Trường Đại học Hoa Sen 5.3 K tài liệu
Tác giả:


Preview text:
Vietnam | January, 2021 Research Vietnam Property Market Brief 4Q20
Source:: 136712407, Moment RF Photographer: Patrick Foto Contents
VIETNAM’S ECONOMIC BACKDROP 3 HO CHI MINH CITY 5 HANOI 10 Office 5 Office 10
With new completions, vacancy rises in 4Q20
Two Grade B buildings enter the market
More weakening demand in Grade A than
Negative net absorption recorded across the segment Grade B Rents stabilise in 4Q20
Rents decrease slightly across the market Retail 6 Retail 11
New supply comes from renovated department stores
One new completion enters the market
Demand shows signs of recovery with positive
Occupancy rate varies across Prime and Non-Prime malls net absorption Rents remain stable
Rents remain largely stable in 4Q20 Apartment for Sale 7 Apartment for Sale 12
Limited new supply continues, yet signs of improvement
Supply additions drop in 4Q20, following the are clearer surge last quarter
Affordable and Mid-end segments continue to
Thu Duc City now becomes the market spotlight lead the sales
Price increment in suburban market records a
Most developers remain confident in their pricing new high
Ready-built Landed Property 8
New Supply volumes return to a low level
Buyers’ sentiment shows strong in the quarter
Primary Prices remain at a high level Industrial 9
Most of the recent land transactions take place via online platform
Southern supply still takes the lead in Vietnam
Land prices reach a new peak IMPORTANT NOTES
The effects of the Covid-19 will inevitably vary from market-to-market, and the true impact and recovery will manifest in forthcoming
quarters. We will continue to monitor the situation on the ground across the country and will provide real-time updates to our clients on
new and emerging trends, as this situation evolves.
Since the beginning of 2019, JLL Research applies a new grading system and methodology for processing market data to better reflect the
market situation. This might subsequently result in some changes in historical data. VIETNAM’S ECONOMIC BACKDROP Vi V e i t e n t a n m a co c n o t n i t n i u n e u s s to t re r c e o c r o d r d a a po p s o i s ti t v i e v e
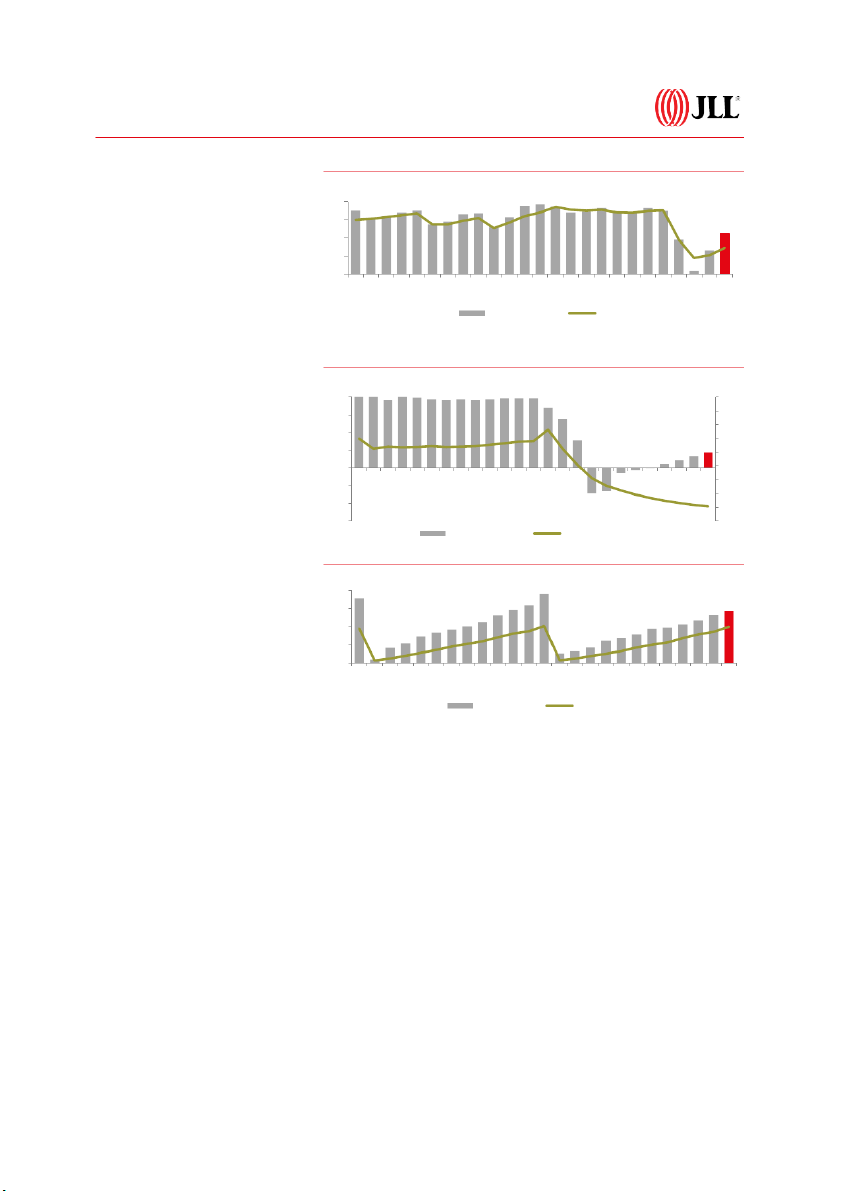
Figure 1: Real GDP Growth (y-o-y) GD G P D g r g o r wt w h t in 4 Q 4 2 Q 0 2 : :Vietnam’s GDP was
estimated to grow 4.48% y-o-y in 4Q20. %
This positive economic growth was 8
bolstered by the strong containment of 6
Covid-19 which coupled with the EVFTA 4
effective from 01/08/2020, supported 2
economic activities to return to normal. 0
In full year 2020, GDP grew 2.91% y-o-y. 4.14 4.15 4.16 4.17 4.18 4.19 4.20
Although this was the lowest growth rate Q Q Q Q Q Q Q
in 2011-20 period, it is considered Quarterly GDP GDP YTD
Vietnam’s great success given the
outbreak of Covid-19 globally. With this
growth, Vietnam was among the world’s
Figure 2: Retail Sales vs. International Arrivals Growth (year-to-date, - y o-y) best performers in 2020. % %
Of the growth, the industrial and 12 80
construction sectors rose the most with 60 9
3.98% y-o-y, followed by the agriculture, 40 6
forestry and fishery sector with 2.34%. 20
The services sector recorded the lowest 3 0
increase with 2.34%, which was also the 0 -20 9 9 9 0 0 0
most modest rise in the 2011-20 period -40 -3 -19 -1 r-19 -19 -19 -20 -2 -20 -20 n l-19 g-1 l-20 ct-19 v-1 ar-20 r-20 n g-2 ct-20 v-2
as Covid-19 has dealt a heavy blow to ec-18 ar-19 p ay-19 u ep o ec-19 p ay-20 Ju u ep o ec-20 -60 D Jan Feb M A M Ju Ju A S O N D Jan Feb M A M Ju A S O N D -6
commercial activities and services. -80 -9 -100 Real Retail Sales International Arrivals (RHS) Re R t e a t i a li sa s l a e l s e ke k e e p e r e r c e o c v o er e i r n i g n wh w ilie e Figure 3: FDI (year-t - o date) in i t n er e n r a n t a i t o i n o a n l a a r a ri r v i a v l a s l co c nt n i t n i u n e u to o USD billion. pl p u l m u m m e m t:
t :While Covid-19 was spreading 40
rapidly around the world, it was well 30
contained in Vietnam, leading to good
performance of trade and consuming 20
services in the last few months of the 10 year. 0 9 9 9 0 0 0
Domestic transportation activities were -19 -1 r-19 -19 l-19 -19 v-1 -20 -2 r-20 -20 l-20 -20 v-2 ec-18 ar-19 p ay-19 n g-1 n g-2 Ju u ep ct-19 o ec-19 ar-20 p ay-20 Ju u ep ct-20 o ec-20
gradually recovering, although overseas D Jan Feb M A M Ju A S O N D Jan Feb M A M Ju A S O N D
transportation and tourism remained FDI Registered FDI Disbursement
challenged. The total retail sales of
Source: General Statistics Office
consumer goods and services were
estimated to rise by 6.4% q-o-q and 8% y- Vi V e i t e n t a n m a ’ m s ’ FD F I D fa f l a lls l : :Although
lead at nearly USD13.6 billion,
o-y. For the whole of 2020, total sales of
goods and services ticked up by 2.6% y-
thousands of experts and investors
accounting for 47.7% of the total o-y.
have been supported to enter Vietnam,
registered investment. Electricity
a large number have yet to make it,
production with USD 4.3 billion ranked
On the other hand, international visitors
creating constraints for the investment
in second place, equivalent to 18% of
to Vietnam remained largely foreign
and business expansion in Vietnam.
the total. This was followed by real
experts and skilled labour as Vietnam’s
Total foreign investment amounted
estate investment and retail sales with
borders remained closed to international
USD 28.5 billion in 2020, down 25% y-
USD 4.2 billion and above USD 1.6
tourists. There were a total of more than o-y. Also, Covi - d 19 hit many
billion respectively. In terms of
3.8 million international visitors to
production and business activities,
investment partners, Singapore took
Vietnam in 2020, down 78.7% y-o-y.
leading to a slight decline in FDI
the lead in 2020 with nearly USD 9
disbursement this year compared to
billion, accounting for 31.5% of the
2019. Specifically, FDI disbursement
total investment. This was followed by
totalled USD 19.98 billion, down 2% y-
South Korea and China with USD 3.9
o-y. Of the 19 sectors invested in 2020, billion and USD 2.46 billion
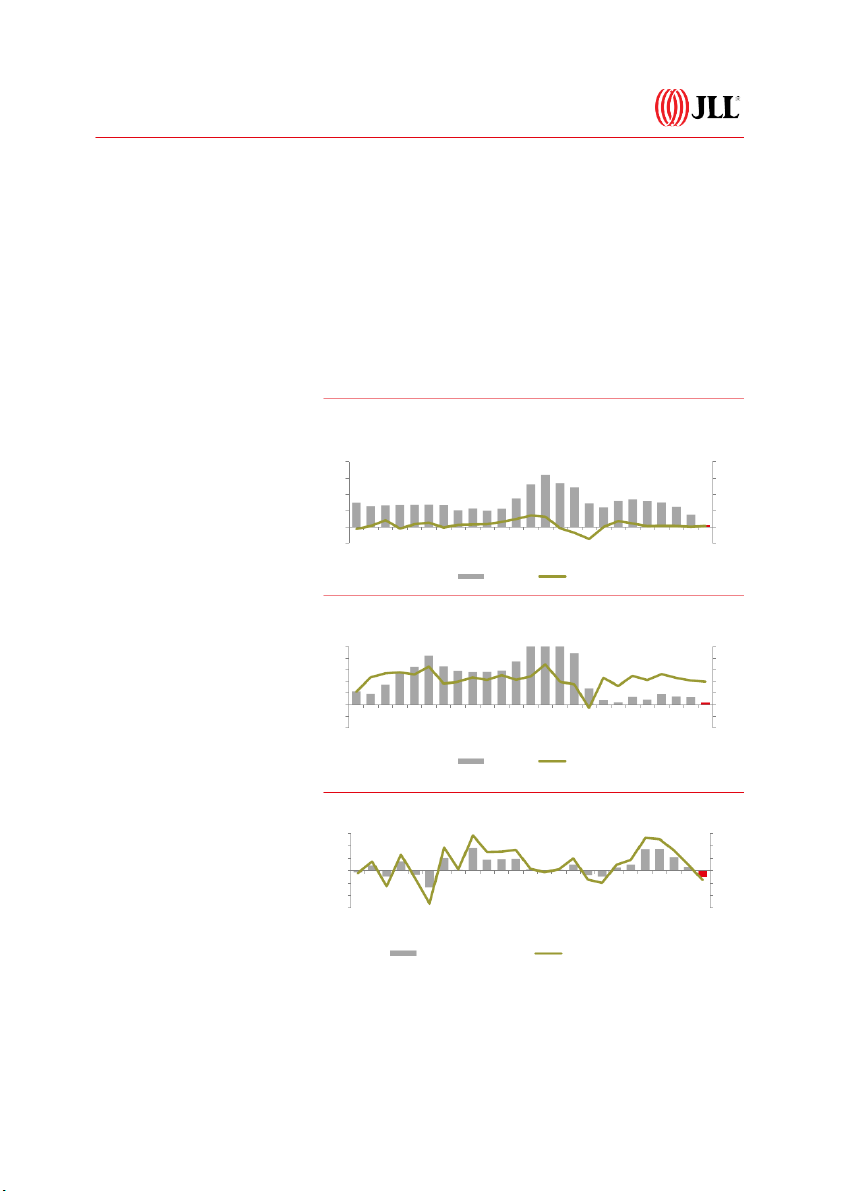
the manufacturing industry took the respectively. 3 VIETNAM’S ECONOMIC BACKDROP CP C I sta t bi b liilse s s e : s :Average CPI increased Bu B s u i s n i e n s e s s re r g e i g st s r t a r ti t on o ha h s a po p s o i s t i i t v i e v
technology, consulting, services,
0.22% q-o-q and 1.38% y-o-y in 4Q20. On re r s e u s l u t l s
t : : In 2020 as a whole, Vietnam
design and advertising posted annual
average, CPI rose 3.23% y-o-y in 2020,
has 134.9 thousand newly registered
increases in newly established
well below the 4% target set by the
enterprises with a total registered
enterprises in 2020. Meanwhile, all National Assembly.
capital of more than VND 2,235.6
remaining industries saw decreases in
trillion, down 2.3% y-o-y in the quantity
the number of newly established
The CPI increased in 2020 since(1) food
of enterprises but up 29.2 % y-o-y in
enterprises over the same period.
prices climbed over the same period
registered capital. The average
during the year. Particularly, pork prices
Particularly, in real estate business registered capital of a newly
jumped by 57.23% y-o-y in 2020. The rice alone, there were 6,694 newly
established enterprise reached VND
price also hiked 5.14% y-o-y as the export
established businesses, down 15.5% y- 16.6 billion, up 32.3% y-o-y.
price and domestic consumption
o-y, and 978 businesses completing demand rose. (2) Prices of
By economic sector, those industries dissolution procedures.
pharmaceuticals and medical equipment
like agriculture, forestry, fishery and
were also up since the Covid-19 epidemic
the production of electricity, water and
has raised demand for these items. (3)
gas, mining industry, science,
Also, the price of educational services Figure 4: CPI – Overall
rose by 4.32% y-o-y due to tuition fees
increasing as set out in the Decree No. 86/2015 / ND-CP.
In the opposite direction, a number of % % 8.0 8.0
factors contributed to curbing CPI growth
in 2020, including the prices of essential 6.0 6.0
commodities such as gasoline, oil, and 4.0 4.0
gas. In addition, the demand for travel 2.0 2.0
and tourism fell amid the epidemic, 0.0 0.0 9 9 0 0
resulting in a drop in travel package 9 0 -2.0 -19 -1 -19 l-19 -19 -20 -2 -20 l-20 -20 -2.0 r-19 n g-1 v-1 r-20 n g-2 v-2
prices, as well as transportation costs. ec-18 ar-19 p ay-19 u ep ct-19 ec-19 ar-20 p ay-20 u ep ct-20 ec-20 D Jan Feb M A o o M Ju Ju A S O N D Jan Feb M A M Ju Ju A S O N D
Besides, the Government also rolled out y-o-y m-o-m (RHS)
packages such as electricity price cuts to
Figure 5: CPI – Housing & Construction Materials
cope with Covid-19, helping to control CPI. % % 5.0 3.0 To T t o a t l lex e p x o p rt r -i - m i p m o p r o t r tu t rn r o n v o e v r r ri r se s s e in n 4.0 2.0 20 2 2 0 0 2 :
0 2020 marked a strong performance 3.0 1.0 2.0 0.0
of export and import activities while 1.0 -1.0
Covid-19 was disrupting trade services 0.0 -2.0
around the world. Total export-import -1.0 9 9 9 0 0 0 -3.0 -19 -1 r-19 -19 -19 -20 -20 n l-19 g-1 v-1 -20 -2 r-20 n l-20 g-2 v-2
turnover amounted to USD 543.9 billion, -2.0 ec-18 ar-19 p ay-19 ct-19 ec-19 ar-20 p ay-20 ct-20 ec-20 -4.0 u ep u ep D Jan Feb M A o o M Ju Ju A S O N D Jan Feb M A M Ju Ju A S O N D
up 5.1% y-o-y. Of the total, export values
were estimated at USD 281.5 billion in y-o-y m-o-m (RHS)
2020, up 6.5% y-o-y, while imports were
Figure 6: Merchandise Trade Balance
USD 262.4 billion, up 3.6% y-o-y in 2020.
The country remained in trade surplus
territory at USD 19.1 billion in 2020, USD billion %
reaching a new high over the last five 6.0 15.0
years since 2016. While the United States 4.0 10.0
and China were the two largest export 2.0 5.0 0.0 0.0
markets of Vietnam, China and South -2.0 -5.0
Korea were the two major import -4.0 -10.0 markets. -6.0 -15.0 9 9 9 0 0 0 -19 -1 r-19 -19 l-19 -19 -20 -2 r-20 -20 l-20 -20 ec-18 ar-19 p ay-19 n g-1 g-2 u v-1 v-2 ep ct-19 ec-19 ar-20 p ay-20 n u ep ct-20 ec-20 D Jan Feb M A o o M Ju Ju A S O N D Jan Feb M A M Ju Ju A S O N D Monthly Actual Levels % of Merchandise Exports (RHS)
Source: General Statistics Office, General Department of Vietnam Custom 4 HCMC Office Market Rents[1]
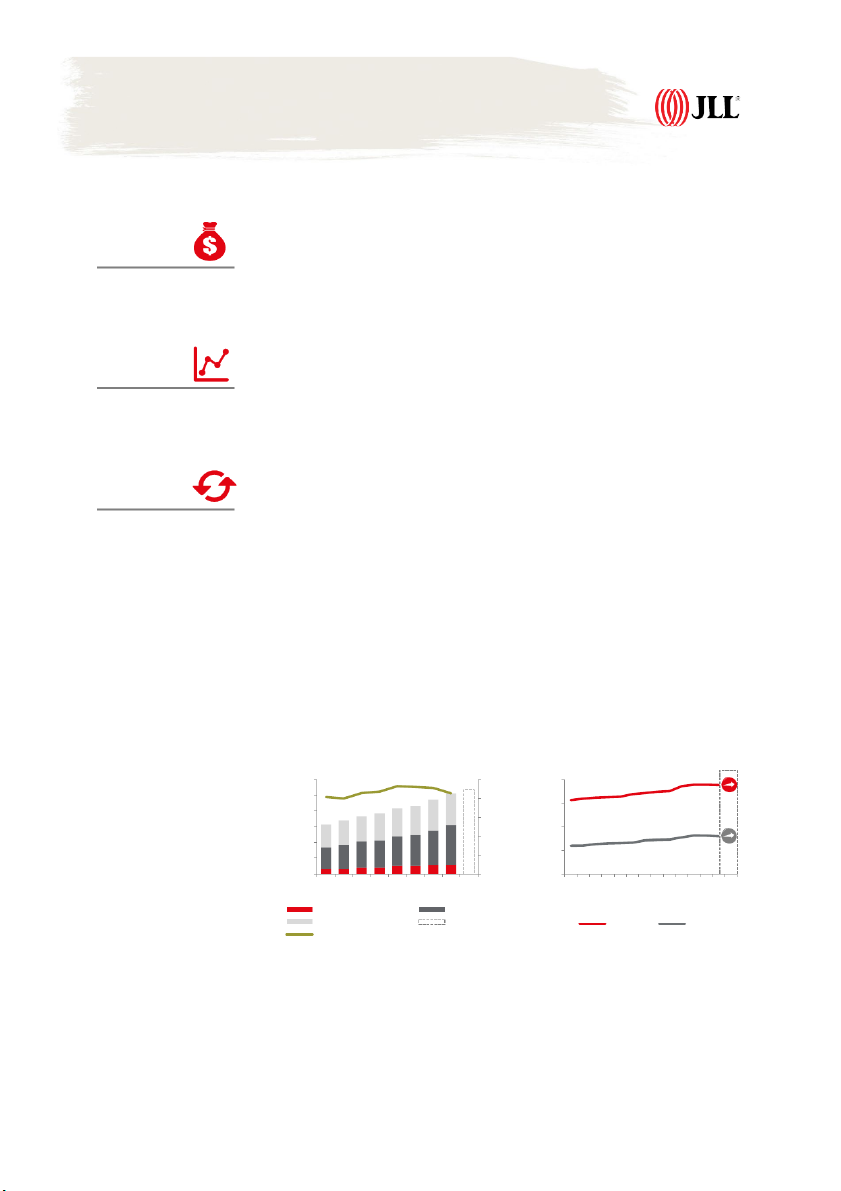
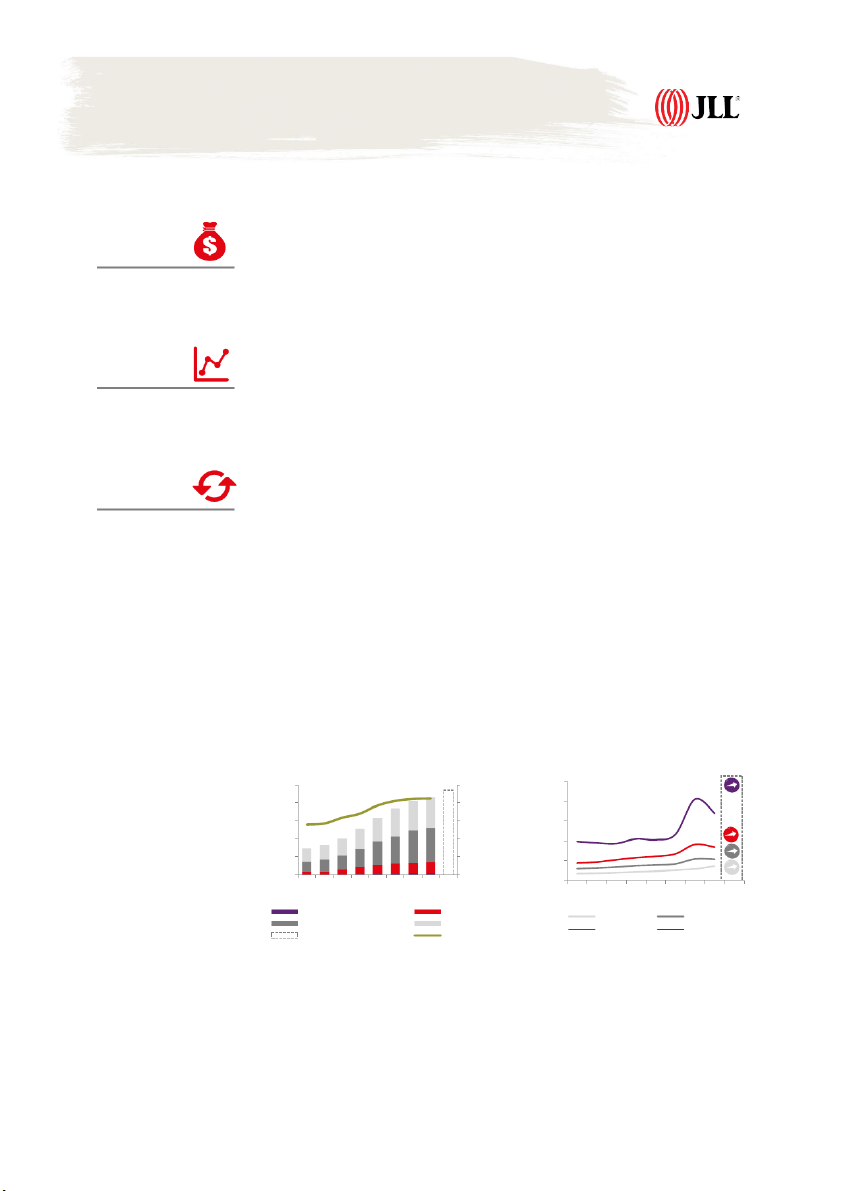
With new completions, vacancy rises in 4Q20
Two new Grade B office buildings were completed in 4Q20, providing more than 44,000 sqm to the USD 30.5
market. Both were located in the non-CBD area, namely APC building in Binh Thanh district and per sqm per month, net on NLA
UOA building in District 7. As of 4Q20, the total supply of Grade A &B reached nearly 1.5 million
sqm, up more than 155,000 sqm from the same period last year. With the new completions and
softening demand, the average vacancy in Grade A &B increased by 1.34% q-o-q and 4.42% y-o-y Rent Change y-o-y to 11.2%.
Negative net absorption recorded across the segment +4.9%
The negative impact of Covid-19 and the uncertainty of the economy have weighed on occupier
demand for HCMC offices, especially in the Grade A segment which recorded the first negative net
absorption since 2013. The occupancy rate for the Grade A market was down by 1.36% q-o-q to
90.5% in 4Q20. Meanwhile, Grade B, with negative net absorption across existing buildings Stage in Rent Cycle
coupled with the new completions, witnessed a drop in the occupancy rate to 88.4% in 4Q20. Rents stabilise in 4Q20 Stable
The average rents of Grade A&B market remained stable at USD 30.5 per sqm per month in 4Q20,
down 1% q-o-q and up 4.9% y-o-y. Rents of Grade A&B in the CBD appeared more stable than
those in non-CBD given the better location and higher tenant profile. In the CBD, rents in Grade A
office inched down by 0.3% q-o-q, while that of Grade B continued to record a positive growth of
nearly 0.4% q-o-q. On the other hand, rents of Grade B in no -
n CBD fell approximately 0.9% q-o-q
to USD 21.5 per sqm per month. Generally, most landlords have kept rents stable q-o-q regardless
of Covid-19 as they seemed to remain confident with the current tight market and expected
limited future supply. However, some newly completed buildings have been under pressure to
lease space and consequently supported tenants as much as possible with rental concessions and flexible negotiation terms. Outlook
In 2021, the market will welcome more than 65,000 sqm of new Grade B office space, mainly in the
Non-CBD area. Meanwhile, the Grade A market will remain tight next year as there are no new
completions and existing buildings are already sitting with high occupancy. The demand is
expected to slow down until the virus is globally contained. Therefore, buildings with large
vacancy will likely reconsider their asking rents and leasing strategies to maintain the required Fi o gcu
c ruep 7a: nOcfyf.i ce Total Stock
Figure 8: Office Average Rents (‘000 sqm NLA) (USD/sqm/month) 3,000 100% 50 2,500 80% 40 2,000 60% 1,500 30 40% 1,000 20 20% 500 0 0% 10 17 18 18 18 18 19 19 19 19 20 20 20 20 2013 2014 2015 2016 2017 2018 2019 2020 2021 4Q 1Q 2Q 3Q 4Q 1Q 2Q 3Q 4Q 1Q 2Q 3Q 4Q 2021 Grade A Grade B Grade C Total future supply Grade A Grade B A&B Occ. Rate (RHS) Note:
[1] Rent value refers to average net rent of the Grade A and B office markets, excluding VAT and service charges.
[2] Flexible space represents a variety of workspaces used by occupiers to increase their portfolio flexibility through short- to medium-term leases.
[3] CBD area refers to District 1. Non-CBD area refers to the rest of the city. Source: JLL Research 5 HCMC Retail Market Rents [1]
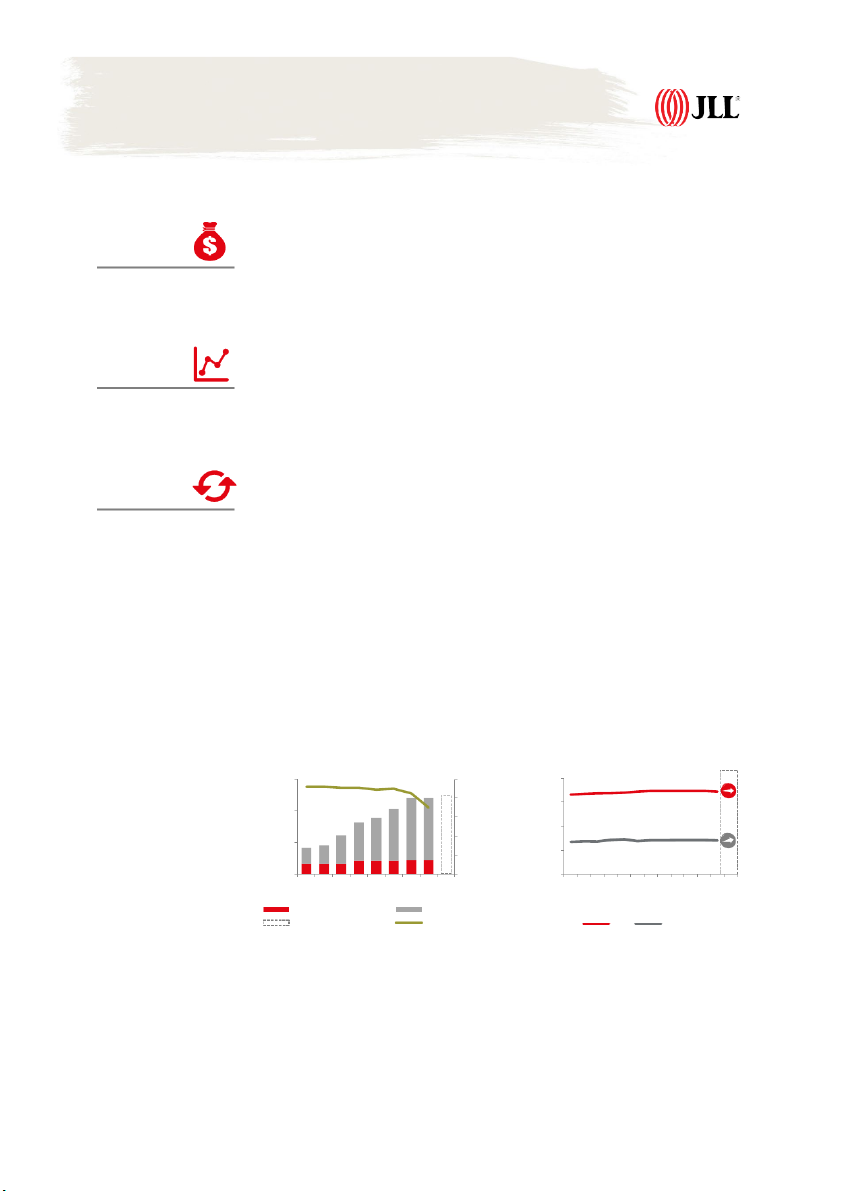
New supply comes from renovated department stores
In 4Q20, HCMC Retail market welcomed more than 10,000 sqm NLA from Menas Mall which was USD 45.6
the renovation of Parkson CT Plaza. Besides, Parkson Saigontourist Plaza released approximately per sqm per month, gross on GLA
3,800 NLA in the second and third floor after a long period of renovation. The reopening of these
two projects brought up the total retail space in HCMC to 1.8 mil sqm GFA, equivalent to 1.2 mil sqm NLA at end- 2020. Rent Change y-o-y
Occupancy rate varies across Prime and Non-Prime malls -0.7%
Occupancy rate varied across the malls, depending on the development quality rather than the
location only. Out of the current 40 malls in HCMC, 12 malls were categorised as Prime, based on
JLL’s set of criteria[3]. The average occupancy rate of Prime malls increased by 0.5% q-o-q to
96.1% in 4Q20, and the net absorption also returned to a positive level of 2,447 sqm this quarter.
This was attributable to the recovering market sentiment. On the other hand, Non-Prime malls Stage in Rent Cycle
were struggling to find tenants and occupancy rates remained low, at 70% on average. Most of the
malls attracted an increasing footprint this quarter, supported by many events and promotion Stable
programs during the holiday seasons. Therefore, most big brands also appeared confident to expand this quarter. Rents remain stable
Average gross rents of shopping malls were recorded at USD 45.6 per sqm per month in 4Q20,
stabilising y-o-y. As the market developed, the mutual relationship between landlords and tenants
also improved, though a collaborative approach to Covid-19. Therefore, the model of revenue
sharing and marketing costs sharing, depending on the specific industry, will continue to remain
the main focus of both landlords and tenants in the future. Outlook
Socar Mall – the first mall in Thu Thiem NUA is set to open in 2021 and expected to bring 38,000
sqm NLA to the market. Meanwhile, the retail podium of some completed mixed-use
developments are still looking for tenants and have yet to define the grand opening date. Healthy
occupancy and stable rents are expected to continue in Prime malls in near term.
The retail space per capita in HCMC will remain the lowest in SEA at 0.12 sq m which paving ways
for further development in the long run. This may encourage many malls to restructure the
concepts and tenant profiles to adapt to the increasingly sophisticated demand in the market. Figure 9: Retail Total Stock
Figure 10: Retail Average Rents (‘000 sqm GLA) (USD/sqm/month) 1,500 100% 90 80% 70 1,000 60% 50 40% 500 30 20% 0 0% 10 17 18 18 18 18 19 19 19 19 20 20 20 2013 2014 2015 2016 2017 2018 2019 2020 2021 4Q 1Q 2Q 3Q 4Q 1Q 2Q 3Q 4Q 2Q 3Q 4Q 2021 District 1 (CBD) Non-CBD Total future supply Occupancy rate (RHS) CBD Non-CBD Note:
[1] Rent value refers to average gross rent across the city, including service charges but excluding VAT.
[2] CBD area refers to District 1. Non-CBD area refers to the rest of the city.
[3] [3] Prime shopping mall: refer to terminology for more explanation. Source: JLL Research 6 HCMC Apartment for Sale Market Primary Price [1]
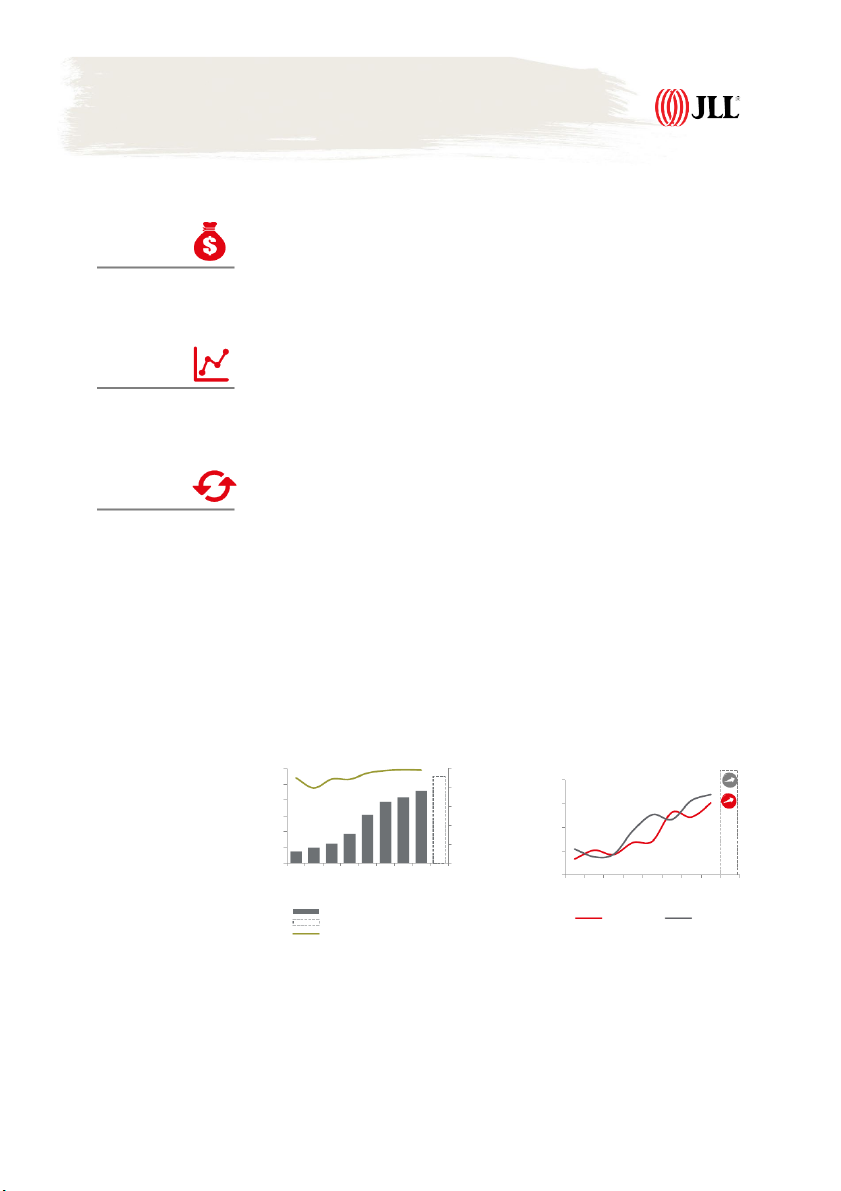
Limited new supply continues, yet signs of improvement are clearer
Limited supply continued in 4Q20 with only 3,600 units launched officially[2], down 26% q-o-q and USD 2,475
stabilising y-o-y. This brought total launches for the full year 2020 to 14,700 units, down 50% y-o-y, per sqm NFA
mostly due to unresolved legal issues. The mid-end segment continued to lead the supply. In
particular, Vinhomes Origami contributed 60% of total launch this quarter. Although the official
launches remained almost unchanged, supply sentiment has shown more signs of improvement. Price Change y-o-y
In fact, this was considered the most dynamic quarter with many soft launches gathering pace,
attracting a large number of homebuyers. The improved sentiment was a result of positive news -14.3%
around Covid-19 vaccines, and the establishment of Thu Duc City where most of the newly-
launched projects were located.
Thu Duc City now becomes the market spotlight
In line with the improving supply sentiment, the demand was also stronger, supported by both Stage in Price Cycle
owner-occupiers and investors. Sales totalled 3,488 units in 4Q20, nearly 55% of which was
contributed by Vinhomes Origami. The investment sentiment was extremely strong and Prices Rising
concentrated in Thu Duc City- the newly established city. From Masteri Centre Point in the Mid-end
segment to The River, Thu Thiem and Metropole in the Luxury segment, they all were well- received.
Most developers remain confident in their pricing
Most developers remained confident in their pricing given the limited supply and better sentiment.
Many projects were launched with the record-high prices in the areas they were located, although
a series of attractive sales policies continued in the quarter. However, the overall market was still
less active than 4Q19 when two luxury projects were released with prices over USD 9,000 per sqm.
Transactions at both have now however, paused for now. In addition, two large-scale projects in
2020 Vinhomes Origami and Akari City, although each being one of the most expensive projects in
their areas, were priced lower than the average seen in 4Q19. Therefore, the overall primary prices
declined 14.3% from 4Q19 to USD 2,475 per sqm in 4Q20. Outlook
With the Party Congress Meeting in January, many projects are expected to have their legal issues
resolved, bringing the total launches to more than 20,000 units in 2021. Developers will remain
confident in their project pricing, supported by the pent-up demand during the limited supply Fi p geurire o d1 1 o :v A e p r tar h tem p eanstt Tto w ta o ly Leaau rsn.ches [2]
Figure 12: Average Primary Prices (‘000 units) (USD/sqm) 350 100% 10,000 280 90% 8,000 210 80% 6,000 140 70% 4,000 70 60% 2,000 0 50% 0 21 2013 2014 2015 2016 2017 2018 2019 2020 13 14 15 16 17 18 19 20 21 4Q 4Q 4Q 4Q 4Q 4Q 4Q 4Q 4Q 4Q Luxury Premium Affordable Mid-end Mid-end Affordable [3] Premium Luxury Future launches Cumulative sales rates (RHS) Note:
[1] Prices exclude VAT and sinking fund.
[2] Official launch figures. Projects are considered as officially launched when the Sale Purchase Agreements are signed, typically upon foundation completion. [3] Sale rate is end-o - f period figure. Source: JLL Research 7 HCMC
Ready-built Landed property (RBL) Market Primary Price [1]
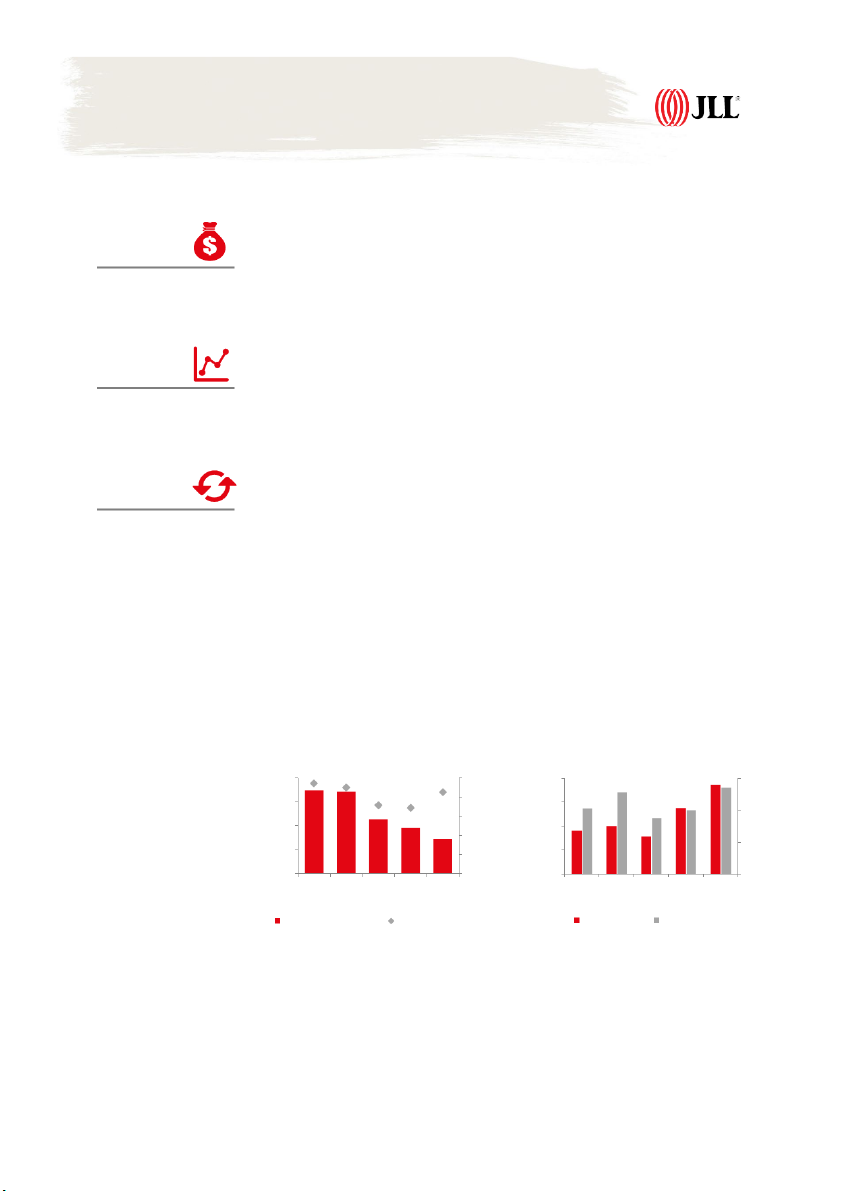
New Supply volumes return to a low level
After witnessing significant launches of more than 1,000 units in 3Q20, new supply volumes USD 5,158
returned to a low level of 131 units in 4Q20. Only two projects were officially launched in the per sqm land
quarter, one of which was a final phase of a 20-ha Lovera Park project in the south of HCMC, while
the other was the second phase of a small project in the west side. They both brought the total
new launches to about 2,200 units for the full year 2020, 50% lower than the peak of 2016-18 Price Change y-o-y
period due to the continued legal issues and limited land bank for landed properties in the city.
Buyers’ sentiment shows strong in the quarter +12.8%
Positive news around Covid-19 vaccines and the good containment of the virus in Vietnam has
boosted buyers’ sentiment further. More than 80% of the total units available in the quarter were
taken up, most of which were in large-scale integrated projects. This development model
continued to prove attractive to both owner-occupiers and investors. Stage in Price Cycle
The majority of owner-occupiers appreciated a better quality of life as those projects brought in
greenery, amenities and facilities whilst privacy was still ensured; whereas, investors looked to the Prices Rising
potential price growth or the possibility of leasing in the future.
Primary Prices remain at a high level
Primary prices continued to record double-digit growth annually with 12.8% in 4Q20. This was
mainly driven by the higher-tha -
n average price in the new integrated projects launched this year.
Yet, compared to 3Q20, the basket has changed when a few high-priced schemes last quarter sold
out, leading to a slight q-o-q decline in 4Q20.
On a project basis, many developers were seen to keep on rising prices, given the good sentiment
resulted from positive news around Covid-19 and the continued supply constraints. The average
primary prices remained at a high level of USD 5,158 per sqm land, although the attractive sales
policies observed for many quarters were becoming even more widespread in 4Q20. Outlook
2021 new launches are set to double this year, reaching more than 4,000 units, since many
projects are expected to have their legal issues resolved after the Party Congress Meeting in
January. With healthy demand, developers will remain confident in pricing, although many
attractive sales policies will continue into 2021.
Figure 13: RBL Total Launches [2]
Figure 14: Average Primary Prices (‘000 units) (USD/sqm land) 30 100% 25 5,000 80% 20 60% 4,000 15 40% 10 3,000 20% 5 2,000 0 0% 1,000 2013 2014 2015 2016 2017 2018 2019 2020 2021 13 14 15 16 17 18 19 20 21 4Q 4Q 4Q 4Q 4Q 4Q 4Q 4Q 4Q Total launches Future launches Townhouses Villas [3] Cumulative sales rate (RHS) Note:
[1] Prices exclude VAT and sinking fund. Price per sqm land = total unit value / size of the land plot on which the property is built.
[2] Official launch figures. Projects are considered as officially launched when the Sale Purchase Agreements are signed, typically upon infrastructure completion. [3] Sale rate is end-o - f period figure. Source: JLL Research 8 Southern[1] Industrial Market Land Price
Most of the recent land transactions take place via online platforms
Demand sentiment for industrial land remained strong, driven by Vietnam’s robust industrial USD 109
fundamentals as the world’s next promising industrial hub. Yet, potential investors still had per sqm per lease term [1]
challenging times entering Vietnam for site inspections, notwithstanding the fact the virus has
been well under control in Vietnam. Thus, the recent successful transactions mostly took place via
online platforms beside other domestic acquisitions, bringing up occupancy rate by 0.9% h-o-h to Price Change y-o-y 85% in 4Q20.
Southern supply still takes the lead in Vietnam +7.9%
No new IP was launched into the market in the review quarter. With large existing land banks, Binh
Duong and Dong Nai were leading industrial land supply in the South. While a few available land
sites in HCMC’s existing IPs were still facing difficulties in compensation or site clearance. In
response to upcoming investment waves, Southern provinces are oriented to operate new IPs and Stage in Price Cycle
expand the existing ones. Among those localities, Long An and Dong Nai are the most active in
new IP developments. Overall, the supply for industrial land in the South is expected to rise further Price Rising
in the next five years to capitalise the increasing demand in the region.
Land price reaches a new peak
Although the Covid-19’s impacts were still lingering and may temporarily make the upcoming
investment plans difficult, industrial properties in Vietnam remained attractive to investors given
their huge potential. Therefore, most IP developers in Southern markets maintained strong
bargaining powers and raised their land prices to a new peak of USD 109 per sqm per lease term in
the Southern region, up 7.9% y-o-y in 4Q20. RBFs rents also rose slightly to USD 3.5-5.1 per sqm
per month, backed by healthy demand from SMEs sector. Outlook
The pandemic may temporarily make it difficult to invest in Vietnam; however, as the new regional
industrial powerhouse, the country will remain attractive to investors and manufacturers,
supporting both demand and supply for industrial properties in future.
Moreover, with the escalating pandemic around the world, virtual applications and online
marketing platforms are now evolving with many innovations. These will become useful tools for
investors to weather through this challenging time.
Figure 15: Total Stock and Occupancy Rate
Figure 16: Average Land and Factory Rents[2] (ha) (USD/sqm/term) (USD/sqm/month) 8,000 100% 200 6 80% 6,000 150 4 60% 4,000 100 40% 2 2,000 20% 50 0 0% 0 0 Binh Dong BR - Long HCMC Binh Dong BR - Long HCMC Duong Nai VT An [3] Duong Nai VT An Total Leasable Area (ha) Occupancy Rate (RHS) Land Price Factory Rent (RHS) Note:
[1] In this report, Southern industrial market refers to HCMC, Binh Duong, Dong Nai, Ba Ria – Vung Tau and Long An markets only.
[2] Infrastructure maintenance, service fees and VAT are not included in the average land rent. Leasing term is the remaining years.
[3[ HCMC total supply excluding Saigon High-tech Park and Quang Trung Software Park owing to their special characteristics. Source: JLL Research 9 HanoiOffice Market Rents[1]
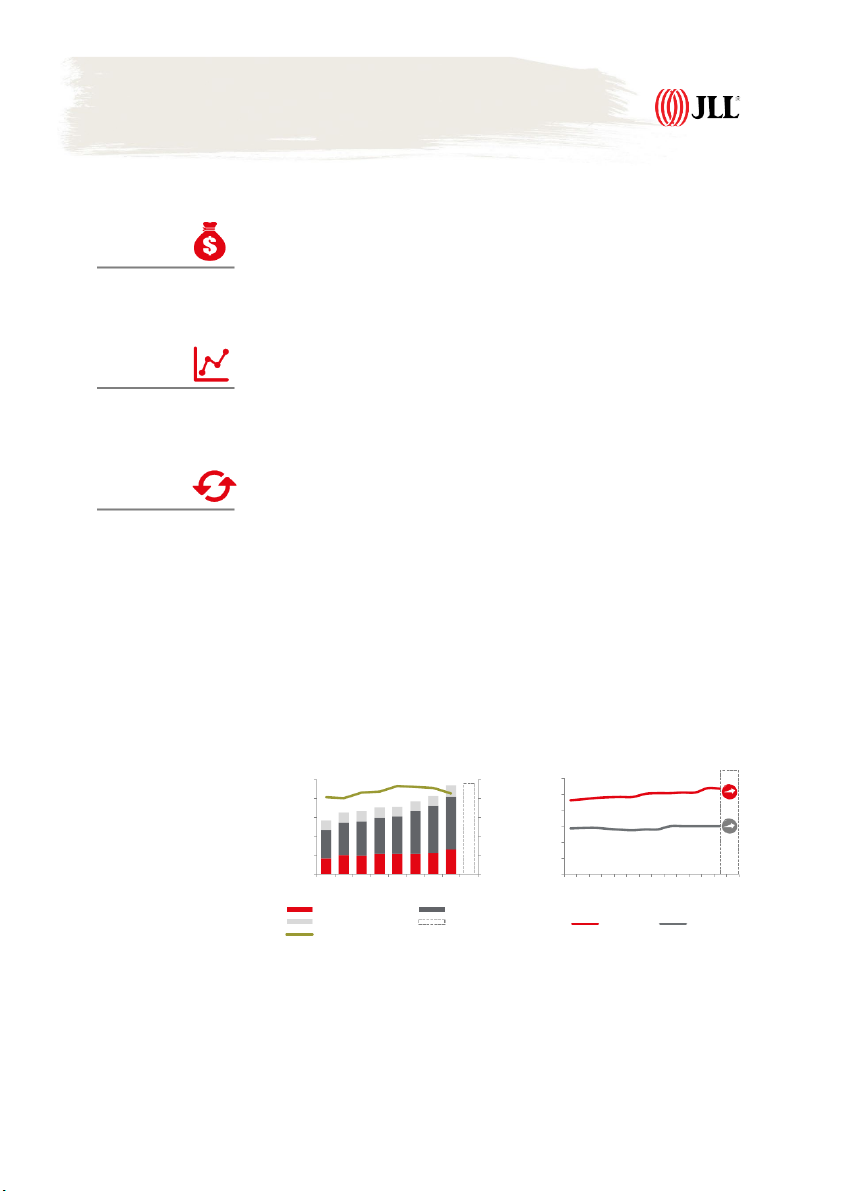
Two Grade B buildings enter the market
In 4Q20, two Grade B office buildings were completed in non-CBD area, namely Century Tower in USD 19.0
Hai Ba Trung District Tower and IDMC Duy Tan in Cau Giay District, adding 33,350 sqm to the per sqm per month,
existing stock, pushing the total stock up to 2.34 million sqm. net on NLA
More weakening demand in Grade A than Grade B
Occupancy rate of Hanoi Grade A&B market was recorded at 86.5% in 4Q20, up 1.08% q-o-q, yet Rent Change y-o-y
down 4.95% y-o-y. This was due to the continued weakening demand, which was more prevailing
in Grade A market where the occupancy rate dipped by 14.4% y-o-y to around 78.7% in 4Q20. +6.4%
Meanwhile Grade B appeared to stablise with occupancy rate up by 1.32% y-o-y to 90.8% in 4Q20.
In terms of net absorption, Grade A&B recorded a negative number of around 2,400 sqm this
quarter, most of which were attributable to Grade A which saw many tenants’ relocation to Grade
B in a move to cut cost. Whereas, nearly 60% of buildings in Grade B still recorded a positive net Stage in Rent Cycle
absorption, due to their more affordable rents.
Rents decrease slightly across the buildings Stable
Most existing buildings either kept their asking rents constant or slightly decreased. The average
net rent of Grade A declined by 1.1% q-o-q to USD 26.7 per sqm per month due to the weakening
demand. Meanwhile, Grade B rents remained largely constant at USD 15.4 per sqm per month,
although some with large vacancy had their rent cut down slightly. Across the market, most
landlords were willing to offer flexible leasing terms to support tenants during this challenging period.
However, the average net rent increased by 6.4 % y-o-y to USD 19.0 per sqm per month, since the
projects that were completed this quarter were of high-quality, in good location and commanded higher-tha - n average rents. Outlook
In 2021, Hanoi will welcome over 36,000 sqm from two projects, therein, BRG Grand Plaza in Dong
Da District constitutes 84.5% of the total new supply.
As tenants are likely to tighten their budget until the pandemic is globally contained, JLL predicts
Hanoi market rent will continue to stablise or even decrease in 2021. Figure 17: Office Total Stock
Figure 18: Office Average Rents (‘000 sqm NLA) (USD/sqm/month) 2,500 100% 30 25 2,000 80% 20 1,500 60% 15 1,000 40% 10 500 20% 5 0 0% 0 17 18 18 18 18 19 19 19 19 20 20 20 20 2013 2014 2015 2016 2017 2018 2019 2020 2021 4Q 1Q 2Q 3Q 4Q 1Q 2Q 3Q 4Q 1Q 2Q 3Q 4Q 2021 Grade A Grade B Grade C Total future supply Grade A Grade B A&B Occ. Rate (RHS) Note:
[1] Rent refers to average net rent of Grade A and B office markets, excluding VAT and service charges.
[2] CBD area consists of Hoan Kiem (core CBD), Dong Da, Ba Dinh and Hai Ba Trung. Non-CBD area refers to the rest of the city.
[3] Prime Shopping Mall: refers to Terminology section for more explanation. Source: JLL Research 10
Tài liệu liên quan:
-

Retail Market Entry Guide Vietnam- - Tài liệu tham khảo | Đại học Hoa Sen
413 207 -
Vn cb vietnam consumer retail 2020 updated - Tài liệu tham khảo | Đại học Hoa Sen
340 170 -

Vn cb consumer survey 2021 - Tài liệu tham khảo | Đại học Hoa Sen
235 118 -

Vn tax vietnam doing business 2020 - Tài liệu tham khảo | Đại học Hoa Sen
280 140