Retail Market Entry Guide Vietnam- - Tài liệu tham khảo | Đại học Hoa Sen
Retail Market Entry Guide Vietnam- - Tài liệu tham khảo | Đại học Hoa Sen và thông tin bổ ích giúp sinh viên tham khảo, ôn luyện và phục vụ nhu cầu học tập của mình cụ thể là có định hướng, ôn tập, nắm vững kiến thức môn học và làm bài tốt trong những bài kiểm tra, bài tiểu luận, bài tập kết thúc học phần, từ đó học tập tốt và có kết quả cao cũng như có thể vận dụng tốt những kiến thức mình đã học.
Môn: Econnomics (Econ 101) 78 tài liệu
Trường: Trường Đại học Hoa Sen 5.3 K tài liệu
Tác giả:


Preview text:
Retail Sector Market Entry Guide - Vietnam
Prepared by Dezan Shira & Associates
Information accurate as of March 2018
Executive Summary ...................................................................................................................................... 3
1. Vietnam Overview ..................................................................................................................................... 5
1.1 Key facts and figures about Vietnam .................................................................................................. 5
1.2 Regional overview ............................................................................................................................... 8
1.3 Country Profile .................................................................................................................................. 10
1.4 Consumption ..................................................................................................................................... 13
2. Market Overview of Retail sector ............................................................................................................ 17
2.1 Introduction ....................................................................................................................................... 17
2.2 Size of the sector .............................................................................................................................. 18
2.3 Specificities of the sector .................................................................................................................. 20
2.4 Market Trends ................................................................................................................................... 24
2.5 Key Growth Drivers – Future Outlook ............................................................................................... 28
3. Market Entry Models ............................................................................................................................... 31
3.1 Market Entry Channels – Profile ....................................................................................................... 31
3.2 Market Entry Channels .................................................................................................................... . 32
3.2 Partner Selection ............................................................................................................................... 33
3.3 Locating Partners in Vietnam ............................................................................................................ 34
3.4 Enterprise Singapore’s Plug and Play Network ................................................................................ 35
4. Regulatory and Legal framework ............................................................................................................ 36
4.1 Introduction ....................................................................................................................................... 36
4.2 Regulatory & Legal environment of the sector .................................................................................. 36
4.3 Relevance of Free Trade Agreements (TPP, ASEAN) for the sector ............................................... 40
4.4 Different retail market entry forms for Singapore SME’s: ................................................................. 49
5. Market Conditions for SMEs ................................................................................................................... 51
5.1 Potential challenges/trade barriers for SME’s in the specific sector ................................................. 51
5.2 Opportunities for SME’s in the specific sector .................................................................................. 52
6. Market Entry Checklist ............................................................................................................................ 55
7. Contact Information……………………………………………………………………………………………... Executive Summary
One of Southeast Asia’s fastest growing consumer markets, Vietnam has all the favorable conditions for the
expansion and growth of the retail sector: an impressive GDP growth rate, political stability, a young population,
a rising middle class, increasing disposable incomes, fast-paced urbanization, rising living standards, a high
literacy rate, and a strategic location.
Fuelled by a rapid economic growth and increased FDI, 2017 emerged as one of the strongest years for
Vietnam. With GDP growing at 6.81 percent, record high foreign direct investment (FDI), and trade volume
reaching an all-time high of US$400 billion, the country is forecast to continue growth into 2018 and beyond. In
the retail sector, the wholesale and retail segment grew by over eight percent in 2017, driven by a growing
middle class, young population, and rise in disposable incomes. Geographically speaking, South Vietnam,
which has one of the highest income per capita in the country, will continue to lead among other regions,
contributing the most to the national economy.
Last year, retail industry sales reached US$129 billion, growing by 10.9 percent, compared to 2016. This rise
has largely been attributed to the entry of foreign retailers, easing of investment regulations, and a rise in
consumer spending. Vietnam continues to remain among the top 10 destinations for retail investment, and will
continue to retain its rankings in the next decade. Traditional retail channels continue to lead by the number of
stores and sales contribution, however, modern retail channels, especially mini-marts and convenience stores
have grown rapidly in the last five years. Modern retail channels are predicted to account for almost half of the
market by 2020. In addition, e-commerce retailing which is at a nascent stage as of now has shown remarkable
growth in the 2017, growing by 25 percent. By 2020, the e-commerce channel is forecast to account for 5 percent of the total market.
As for the government - numerous investor-friendly reforms were implemented in 2017, in areas such as
market-entry regulations, establishment procedures, and development of intermediary payment systems. These
reforms has not only benefitted the existing players in the markets, but also made it easier for retailers who are
planning to invest in Vietnam, one of the most attractive retail markets in the world. List of Abbreviations AANZFTA
ASEAN-Australia-New Zealand Free Trade Area ACFTA ASEAN China Free Trade Area AFTA ASEAN Free Trade Area AIFTA ASEAN–India Free Trade Area AJCEP
ASEAN – Japan Comprehensive Economic Partnership AKFTA ASEAN Korea Free Trade Area ASEAN
Association of Southeast Asian Nations ATIGA
ASEAN Trade in Goods Agreement CBD Central Business District CPTPP
Comprehensive and Progressive Agreement for Trans-Pacific Partnership DPI
Department of Planning and Investment ENT Economic Need Test EU European Union EVFTA
EU-Vietnam Free Trade Agreement FDI Foreign Direct Investment FMCG Fast-Moving Consumer Goods FOE Foreign Owned enterprises FTA Free Trade Agreement GDC
General Department of Customs of Vietnam GDP Gross Domestic Product GRDI
Global Retail Development Index GSO
General Statistics Office of Vietnam IP Intellectual Property JSC Joint Stock Company JVE Joint Venture enterprises LLC Limited Liability Company LOE Law on Enterprise LOI Law on Investment MIGA
Multilateral Investment Guarantee Agency MOIT
Ministry of Industry and Trade MPAC Master Plan on ASEAN RCEP
Regional Comprehensive Economic Partnership SME
Small and medium-sized enterprises TPP Trans-Pacific Partnership TRIPS
Trade-Related Aspects of Intellectual Property Rights VND Vietnamese Dong WFOE
Wholly Foreign Owned Enterprise WTO World Trade Organization 1. Vietnam Overview
In the last 10 years, Vietnam has emerged as one of the fastest growing global economy. Largely driven by
investor-friendly government policies, young demographic, rise in urbanization, growing consumer spending,
and foreign investment, Vietnam’s is projected to grow annually around seven percent in the next few years.
However, the country has seen economic development only in a few provinces and cities, and the government
is trying to introduce investment policies focusing on less developed areas.
Sector wise, agriculture continues to dominate the country’s employment share, however services and
industry/construction sectors have increased their share in the country’s GDP. In terms of employment,
Vietnam’s employment rate has steadily dropped in the last few years, which highlights the growing need for workforce in the economy.
Being a single party country, Vietnam has managed to maintain its political stability, which has hugely benefited
the economy, especially with regards to policy implementation, expanding diplomatic relations, and attracting
foreign investments. However, more needs to be done with respect to policy development as foreign investors,
especially from Asia continue to see Vietnam as one of the best investment destinations.
1.1 Key facts and figures about Vietnam Population Size
According to the General Statistics Office (GSO) of Vietnam, Vietnam’s population was estimated at 93.7 million in 2017.1
Male population was 46.2 million, accounting for 49.3 percent; female population was 47.5 million, accounting for 50.7 percent.
Employed laborers aged 15 years and above in 2017 in urban areas accounted for 31.9 percent and those in
rural areas held 68.1 percent. Growth rate
In 2017, Vietnam’s population grew by 1.07 percent as compared to 2016 to 93.7 million.
From 2014 to 2017, the average population growth was 1.075 percent. Age structure Age Group2 Share in total Male Female population (2017 est.) 0-14 years 23.55% 11,909,326 10,735,324 15-24 years 16.22% 8,098,019 7,509,021 25-54 years 45.56% 22,087,095 21,719,615 55-64 years 8.55% 3,798,928 4,419,837 65 years and over 6.12% 2,281,923 3,601,075 Urbanization
Urban population stood at 32.9 million, accounting for 35.1 percent, while rural population stood at 60.8 percent, accounting for 64.9 percent. 1 www.gso.gov.vn
2 https://www.indexmundi.com/vietnam/demographics_profile.html GDP Growth rate
In 2017, Vietnam’s GDP grew by 6.81 percent. It increased by 5.15 percent in the first quarter; 6.28 percent in
the second quarter; 7.46 percent in the third quarter; and 7.65 percent in the fourth quarter.1
For 2018, the government is targeting a GDP of 6.7 percent. Per Capita
The 2017 nominal GDP stood at VND 5,008 trillion (US$221 billion).
GDP per capita was estimated at 53.5 million VND dongs, equivalent to US$2,385, an increase of US$ 170 compared to that in 2016.1 Sector contribution
In 2017, the services sector contributed the highest to the GDP, accounting for 41.32 percent, followed by
industry and construction at 33.34 percent, and agriculture, forestry, and fisheries at 15.34 percent.
In 2017, the fishery gained the highest growth rate of 5.54 percent, while forestry industry grew by 5.14 percent.
The agriculture sector grew by 2.07 percent.
In the industrial and construction sector, the industrial sector grew by 7.85 percent. Manufacturing sector grew
the fastest in seven years at 14.40 percent. The mining and quarrying industry declined by 7.10 percent. The
construction sector maintained its growth at 8.70 percent
In the services sector, wholesale and retail sales increased by 8.36 percent in 2017. Accommodation and
catering services grew by 8.98 percent, while financial, banking and insurance activities rose by 8.14 percent.
Finally, the real estate sector grew by 4.07 percent, the highest increase since 2011.3 FDI
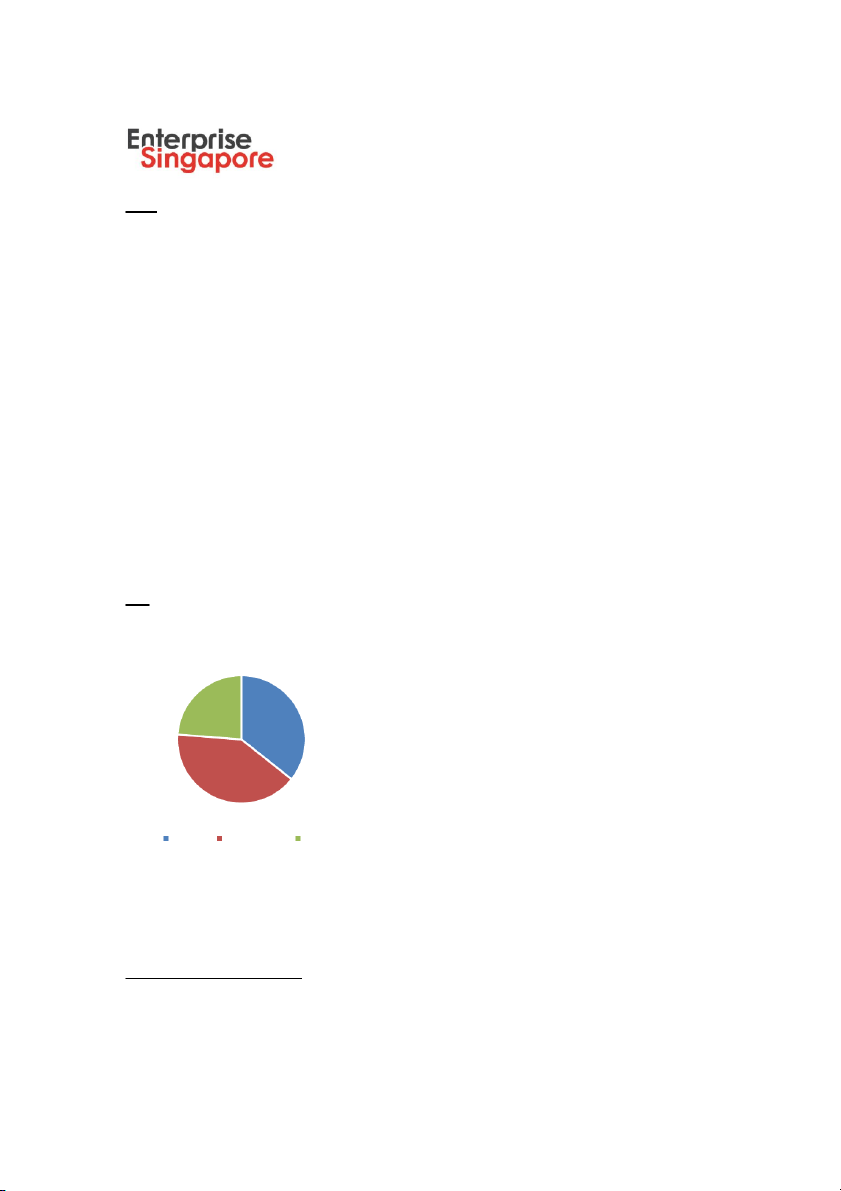
Vietnam’s market ownership structure3 23.8% 35.7% 40.5% State Non-State FDI Total FDI inflows
Total value of newly and additionally registered capital, capital contributed and shares purchased in 2017
reached US$35.88 billion, up 44.4 percent compared to 2016. 3 www.gso.gov.vn
In 2017, 2,591 new projects attracted registered capital of US$21.27 billion, up 42.3 per cent against last year.
Another US$8.41 billion was added to 1,188 existing projects, 49.2 per cent higher than last year. The
remaining US$6.19 billion was in the form of capital contribution and share purchases, an increase of 45.1 percent compared to 2016.
The disbursed capital hit US$17.5 billion, a 10-year high. The registered FDI capital and disbursed FDI grew by
44.4 percent and 10.8 percent respectively, compared with 2016.3 Top Five Investment Sources
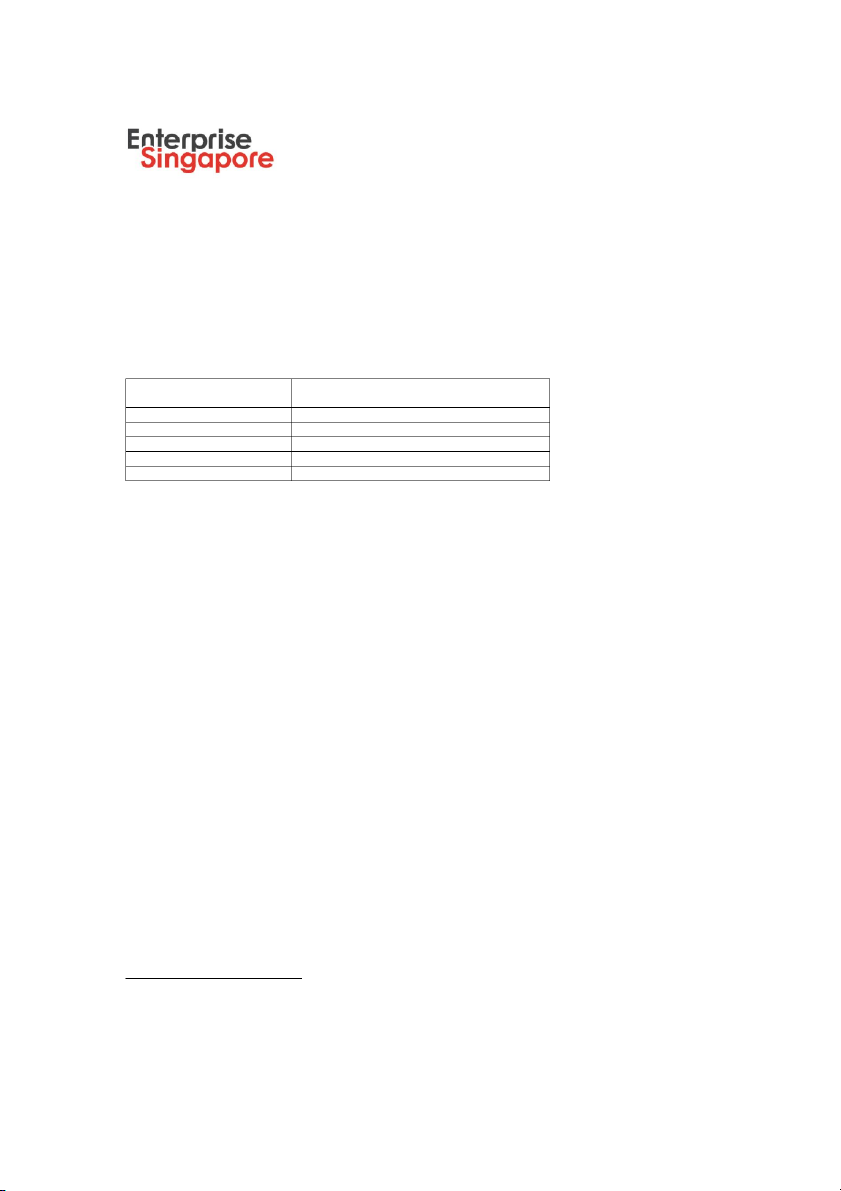
In total, 115 counties and territories invested in Vietnam in 2017.4 Top five country and
Registered capital for January 01 to geographical territory
December 20, 2017 (US$ million) Japan 7745.8 South Korea 3973.3 Singapore 3771.8 China 1409.7 Hong Kong 740.4 Industries for investment
A total of 19 industries and sectors attracted FDI in 2017. The manufacturing-processing industry received the
highest at US$15.87 billion, accounting for 44.2 percent of the total registered FDI.
The electricity production and distribution sector ranked second with US$8.37 billion, representing 23.3 per cent
of the total FDI. The real estate sector was in third place with US$3.05 billion, totaling 8.5 per cent. Locations for FDI
Ho Chi Minh City attracted the most of FDI with a total registered capital of US$6.5 billion, capturing 18.1
percent of total investment capital. Bac Ninh ranked second with a total registered capital of US$3.4 billion,
accounting for 9.5 percent of total investment capital.
Thanh Hoa ranked third with a total registered capital of US$3.17 billion, accounting for 8.8 percent of the total investment capital. 4 www.gso.gov.vn 1.2 Regional overview Regional Vietnam
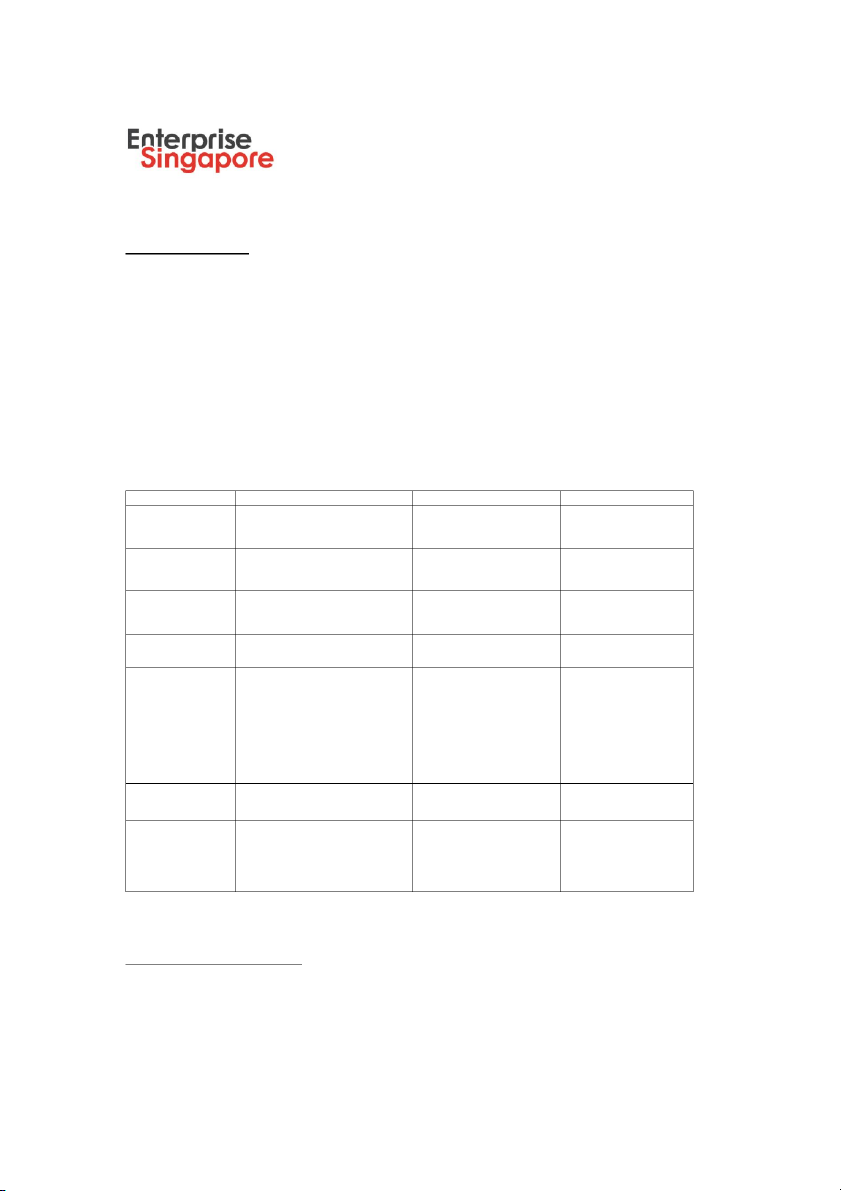
The General Statistics Office of Vietnam groups their provinces and cities into eight regions, listed below: 1. NORTH a. Red River Delta b. Northeast c. Northwest 2. CENTRAL a. North Central Coast b. South Central Coast c. Central Highlands 3. SOUTH a. Southeast b. Mekong River Delta North Central South Population 33.1 million 25.5 million 34.1 million (2016)5 GDP growth 8.68% 8.31% 7.25% GDP Contribution 31.7% 17.1% 51.2% (2016) Number of FDI Projects (2016) 975 192 1445 Heavy manufacturing Manufacturing Food and Type of FDI Petrochemicals Seafood, food Beverage investments processing Retail IT Pharmaceuticals Telecommunications Luxury goods Electronics Manufacturing Garments Electronics Employment rate (2016) 59% 59.3% 56% Average income per capita in 2821 (US$ 124.12) 2497 (US$ 109.87) 3641 (US$ 160.20) Thousand VND (2016 monthly est.)6 5 www.gso.gov.vn
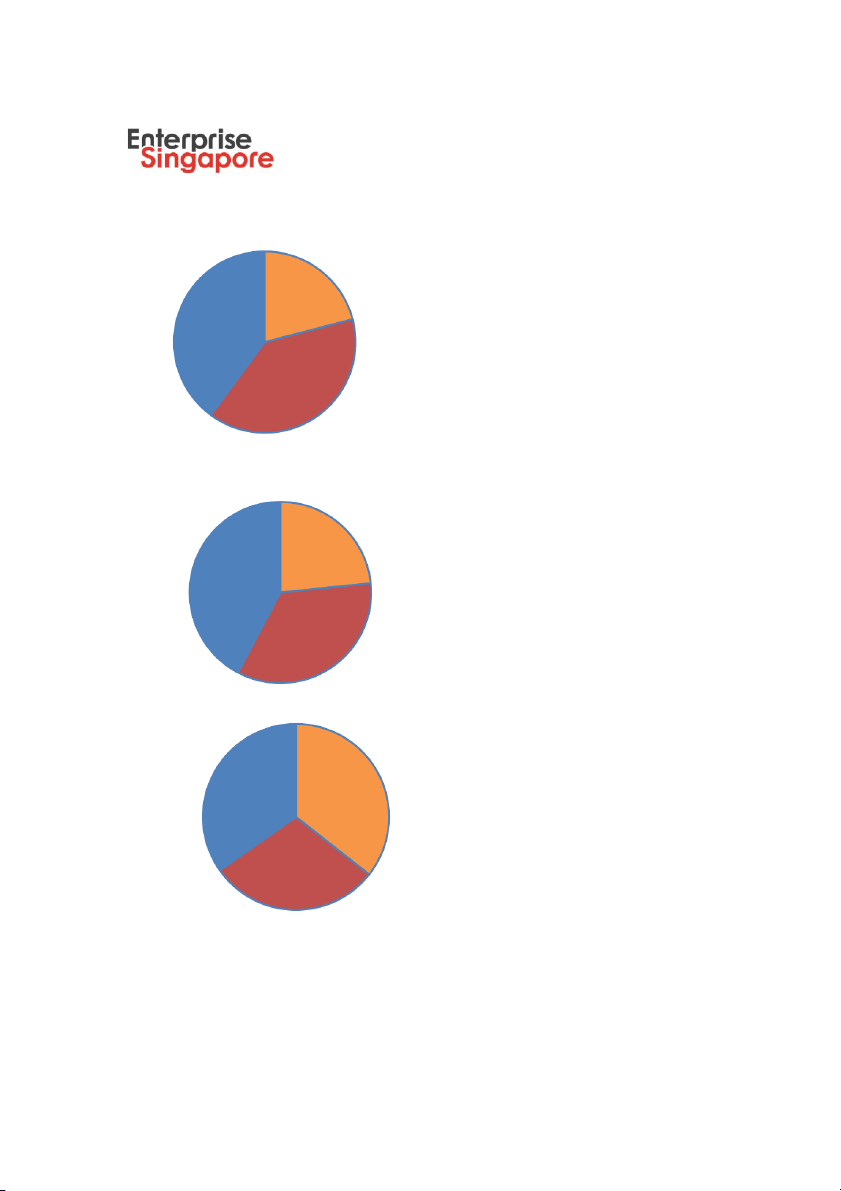
6 Exchange rate – 1US$ = 22727.27 VND Economic Structure (2016)
North (average of 25 provinces and cities) Agricultur e, forestry and fisheries Service 20.84% 39.72% Industry- Constructio n 39.03%
Central (average of 19 provinces and cities) Agriculture, forestry and fisheries Service 22.46% 40.59% Industry- Constructio n 32.97%
South (average of 19 provinces and cities) Agriculture, forestry and Service fisheries 33.86% 34.72% Industry- Construction 28.89% 1.3 Country Profile
Political situation & outlook
Domestic and regional political stability
Vietnam is a one-party state run by the Communist Party, which decides all major policy issues. It is one of the
more politically stable countries in South East Asia. However, there are strict restrictions on freedom of speech,
which can affect the use of internet, particularly social media and blogs. Most official media outlets and news
publications are also under the control of the government.
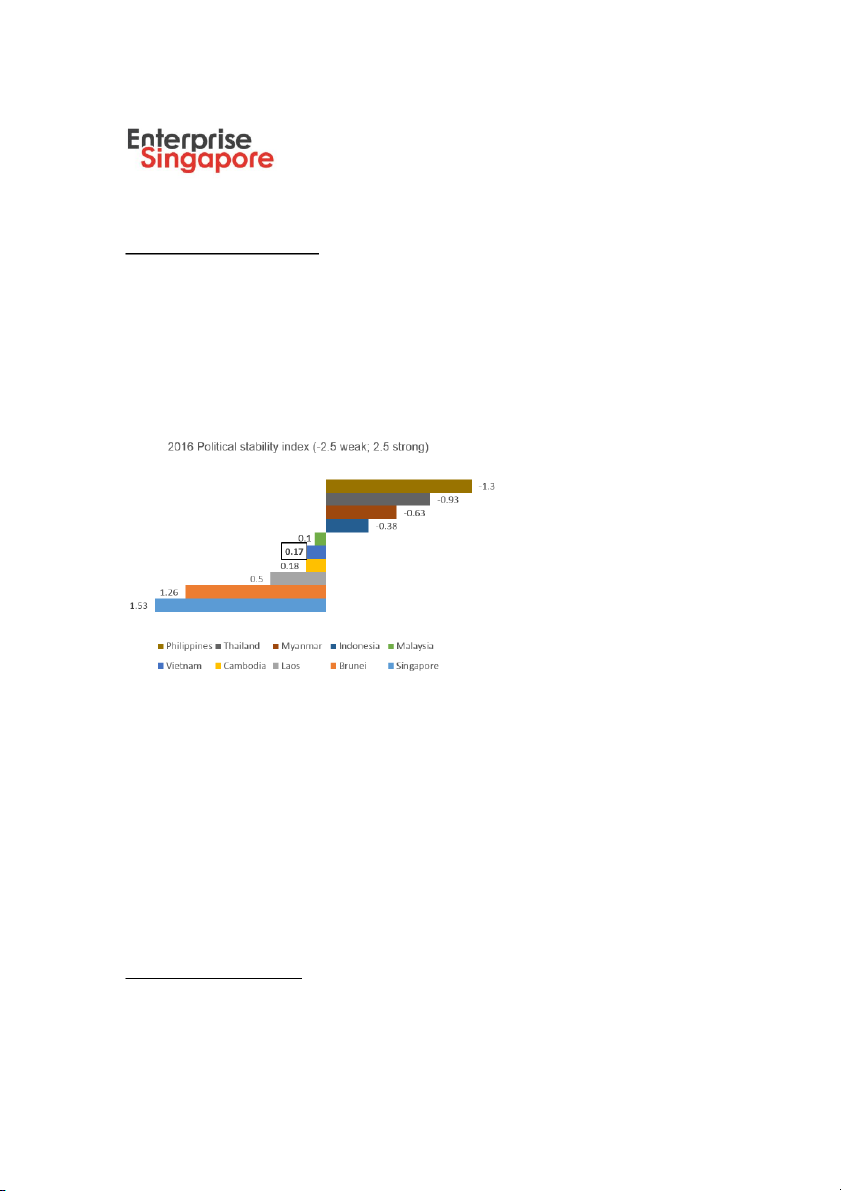
In the region, Vietnam along with Singapore, Brunei, Laos, and Cambodia are one of the most politically stable
countries. According to the World Bank’s 2016 “Worldwide Governance Indicators,”7 Vietnam ranks the fifth
most politically stable country amongst all the ASEAN countries. Diplomatic relations
Vietnam is a friendly and reliable partner of all countries in the international community, actively taking part in
international and regional cooperation processes. Vietnam foreign policy focuses on developing relations in the
principles of respect for each other's independence, sovereignty and territorial integrity, non-interference in each
other's international affairs; non-use or threat of force; settlement of disagreements and disputes by means of
peaceful negotiations; mutual respect, equality and mutual benefit. As of September 2016, Vietnam maintains
diplomatic relationships with 188 nations worldwide.
Since the last few years, Vietnam’s foreign policy has been multidirectional, which focuses on expanding
diplomatic relations for economic development. This strategy has emerged due to the growing issues of
sovereignty and territorial integrity in the region faced by numerous countries, including Vietnam
In addition, amid a growth of trade protectionism, Vietnam actively promotes economic, trade and investments
across nations in both bilateral and multilateral aspects. Noticeably, Vietnam is one of a few emerging markets
to joint CPTPP; and one of two ASEAN members, along with Singapore that have finished FTA negotiations
with the EU which is expected to come into force shortly in mid of 2018.
7 http://info.worldbank.org/governance/WGI/#home
Tài liệu liên quan:
-

Jll vietnam property market overview 4q20 2020 q4 Tài liệu tham khảo | Đại học Hoa Sen
301 151 -
Vn cb vietnam consumer retail 2020 updated - Tài liệu tham khảo | Đại học Hoa Sen
340 170 -

Vn cb consumer survey 2021 - Tài liệu tham khảo | Đại học Hoa Sen
234 117 -

Vn tax vietnam doing business 2020 - Tài liệu tham khảo | Đại học Hoa Sen
279 140