Lab 01 - Wireshark introduction | Môn Computer Network - Trường Đại học Quốc tế, Đại học Quốc gia Thành phố Hồ Chí Minh
In this first Wireshark lab, you’ll get acquainted with Wireshark, and make some simple packet captures and observations. Tài liệu được sưu tầm gồm 12 trang, giúp bạn ôn tập tốt hơn. Mời các bạn đón xem.
Môn: Computer Network (IT091IU) 10 tài liệu
Trường: Trường Đại học Quốc tế, Đại học Quốc gia Thành phố Hồ Chí Minh 2 K tài liệu
Tác giả:


Preview text:
lOMoAR cPSD| 23136115 Wireshark Lab: Getting Started v8.1
Supplement to Computer Networking: A Top-Down
Approach, 8 th ed., J.F. Kurose and K.W. Ross
“ Tell me and I forget. Show me and I remember. Involve me and I
understand. ” Chinese proverb
© 2005-2021 , J.F Kurose and K.W. Ross, All Rights Reserved
One’s understanding of network protocols can often be greatly deepened by “seeing
protocols in action” and by “playing around with protocols” – observing the sequence of
messages exchanged between two protocol entities, delving down into the details of
protocol operation, and causing protocols to perform certain actions and then observing
these actions and their consequences. This can be done in simulated scenarios or in a “real”
network environment such as the Internet. In the Wireshark labs you’ll be doing in this
course, you’ll be running various network applications in different scenarios using your
own computer. You’ll observe the network protocols in your computer “in action,”
interacting and exchanging messages with protocol entities executing elsewhere in the Internet.
Thus, you and your computer will be an integral part of these “live” labs.
You’ll observe, and you’ll learn, by doing.
In this first Wireshark lab, you’ll get acquainted with Wireshark, and make some simple
packet captures and observations.
The basic tool for observing the messages exchanged between executing protocol entities
is called a packet sniffer. As the name suggests, a packet sniffer captures (“sniffs”)
messages being sent/received from/by your computer; it will also typically store and/or
display the contents of the various protocol fields in these captured messages. A packet
sniffer itself is passive. It observes messages being sent and received by applications and
protocols running on your computer, but never sends packets itself. Similarly, received
packets are never explicitly addressed to the packet sniffer. Instead, a packet sniffer
receives a copy of packets that are sent/received from/by application and protocols executing on your machine.
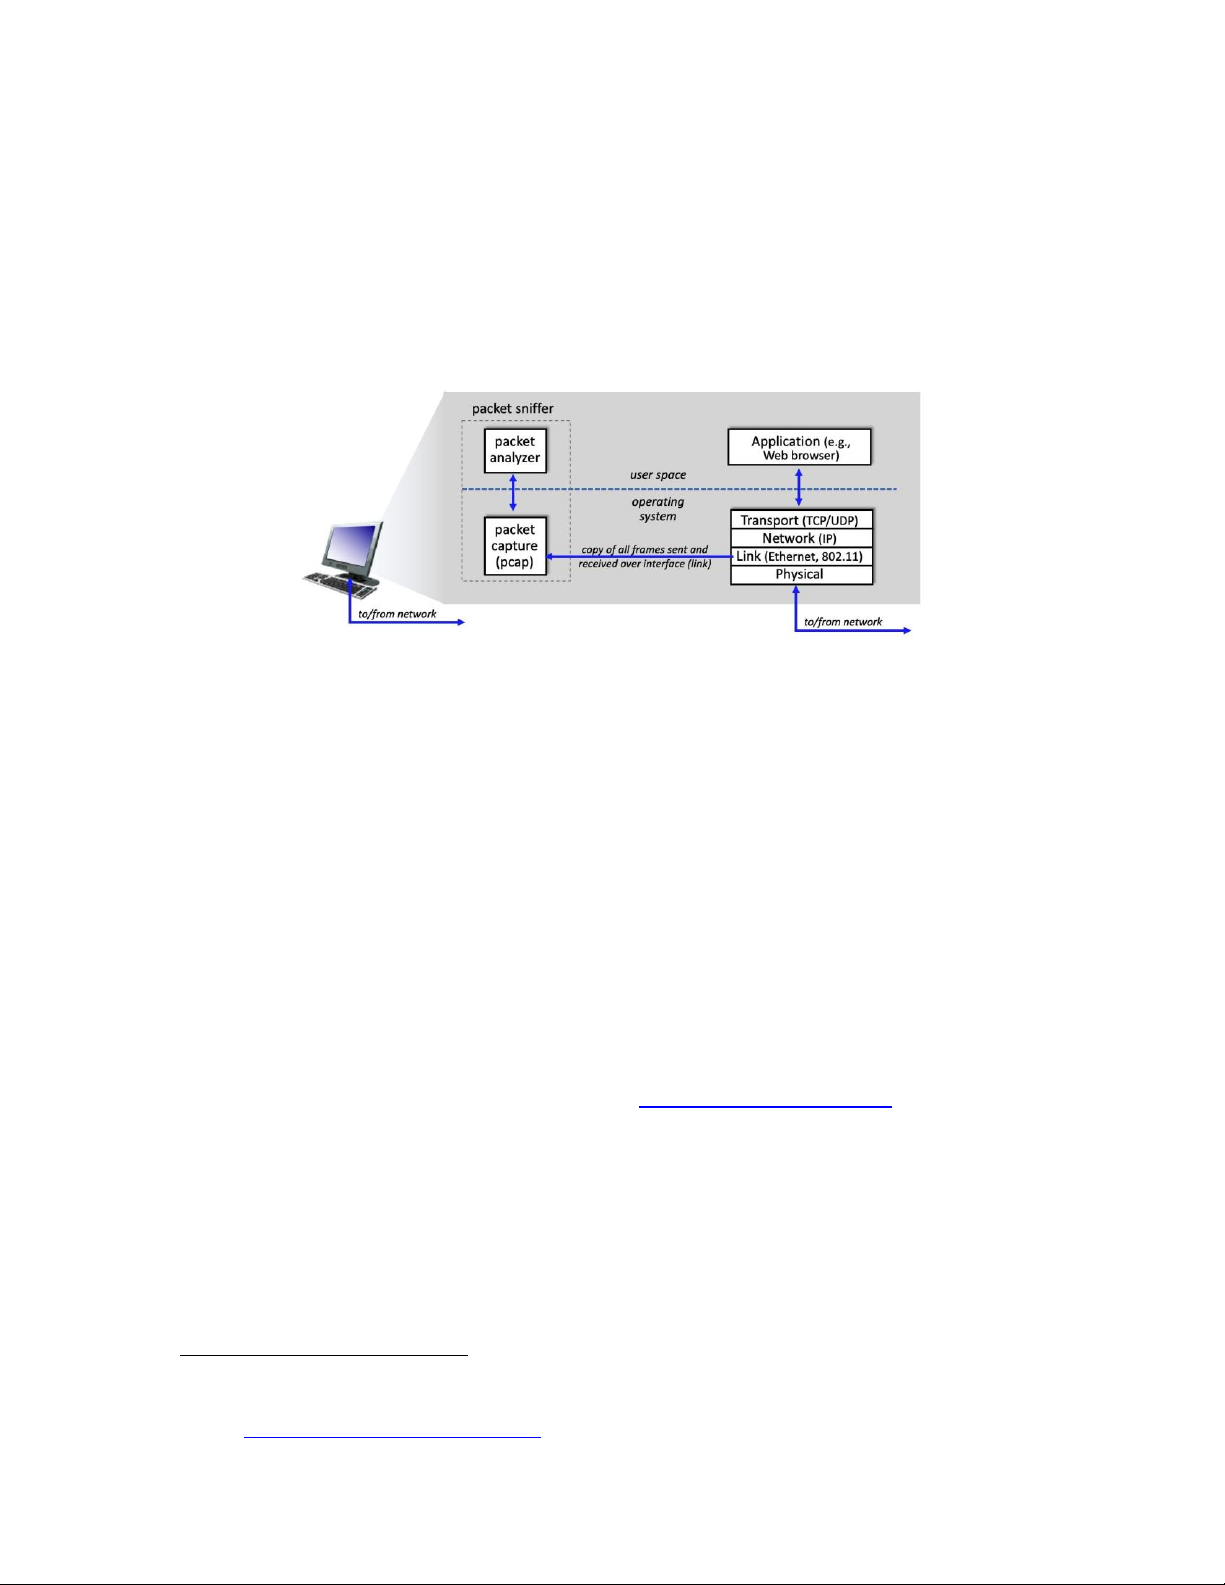
Figure 1 shows the structure of a packet sniffer. At the right of Figure 1 are the protocols
(in this case, Internet protocols) and applications (such as a web browser or email client)
that normally run on your computer. The packet sniffer, shown within the dashed rectangle
in Figure 1 is an addition to the usual software in your computer, and consists of two parts.
The packet capture library receives a copy of every link-layer frame that is sent from or lOMoAR cPSD| 23136115
received by your computer over a given interface (link layer, such as Ethernet or WiFi).
Recall from the discussion from section 1.5 in the text (Figure 1.24 1 ) that messages
exchanged by higher layer protocols such as HTTP, FTP, TCP, UDP, DNS, or IP all are
eventually encapsulated in link-layer frames that are transmitted over physical media such
as an Ethernet cable or an 802.11 WiFi radio. Capturing all linklayer frames thus gives you
all messages sent/received across the monitored link from/by all protocols and applications executing in your computer.
Figure 1: packet sniffer structure
The second component of a packet sniffer is the packet analyzer, which displays the
contents of all fields within a protocol message. In order to do so, the packet analyzer must
“understand” the structure of all messages exchanged by protocols. For example, suppose
we are interested in displaying the various fields in messages exchanged by the HTTP
protocol in Figure 1. The packet analyzer understands the format of Ethernet frames, and
so can identify the IP datagram within an Ethernet frame. It also understands the IP
datagram format, so that it can extract the TCP segment within the IP datagram. Finally, it
understands the TCP segment structure, so it can extract the HTTP message contained in
the TCP segment. Finally, it understands the HTTP protocol and so, for example, knows
that the first bytes of an HTTP message will contain the string “GET,” “POST,” or
“HEAD,” as shown in Figure 2.8 in the text.
We will be using the Wireshark packet sniffer [http://www.wireshark.org/] for these labs,
allowing us to display the contents of messages being sent/received from/by protocols at
different levels of the protocol stack. (Technically speaking, Wireshark is a packet analyzer
that uses a packet capture library in your computer. Also, technically speaking, Wireshark
captures link-layer frames as shown in Figure 1, but uses the generic term “packet” to refer
to link-layer frames, network-layer datagrams, transport-layer segments, and application-
layer messages, so we’ll use the less-precise “packet” term here to go along with Wireshark
convention). Wireshark is a free network protocol analyzer that runs on Windows, Mac,
1 References to figures and sections are for the 8th edition of our text, Computer Networks, A Top-down
Approach, 8h ed., J.F. Kurose and K.W. Ross, Addison-Wesley/Pearson, 2020. Our authors’ website for this
book is http://gaia.cs.umass.edu/kurose_ross You’ll find lots of interesting open material there. lOMoAR cPSD| 23136115
and Linux/Unix computers. It’s an ideal packet analyzer for our labs – it is stable, has a
large user base and well-documented support that includes a userguide
(http://www.wireshark.org/docs/wsug_html_chunked/), man pages
(http://www.wireshark.org/docs/man-pages/), and a detailed FAQ
(http://www.wireshark.org/faq.html), rich functionality that includes the capability to
analyze hundreds of protocols, and a well-designed user interface. It operates in computers
using Ethernet, serial (PPP), 802.11 (WiFi) wireless LANs, and many other link-layer technologies. Getting Wireshark
In order to run Wireshark, you’ll need to have access to a computer that supports both
Wireshark and the libpcap or WinPCap packet capture library. The libpcap software will
be installed for you, if it is not installed within your operating system, when you install
Wireshark. See http://www.wireshark.org/download.html for a list of supported operating systems and download sites.
Download and install the Wireshark software:
Go to http://www.wireshark.org/download.html and download and install the
Wireshark binary for your computer.
The Wireshark FAQ has a number of helpful hints and interesting tidbits of information,
particularly if you have trouble installing or running Wireshark. Running Wireshark
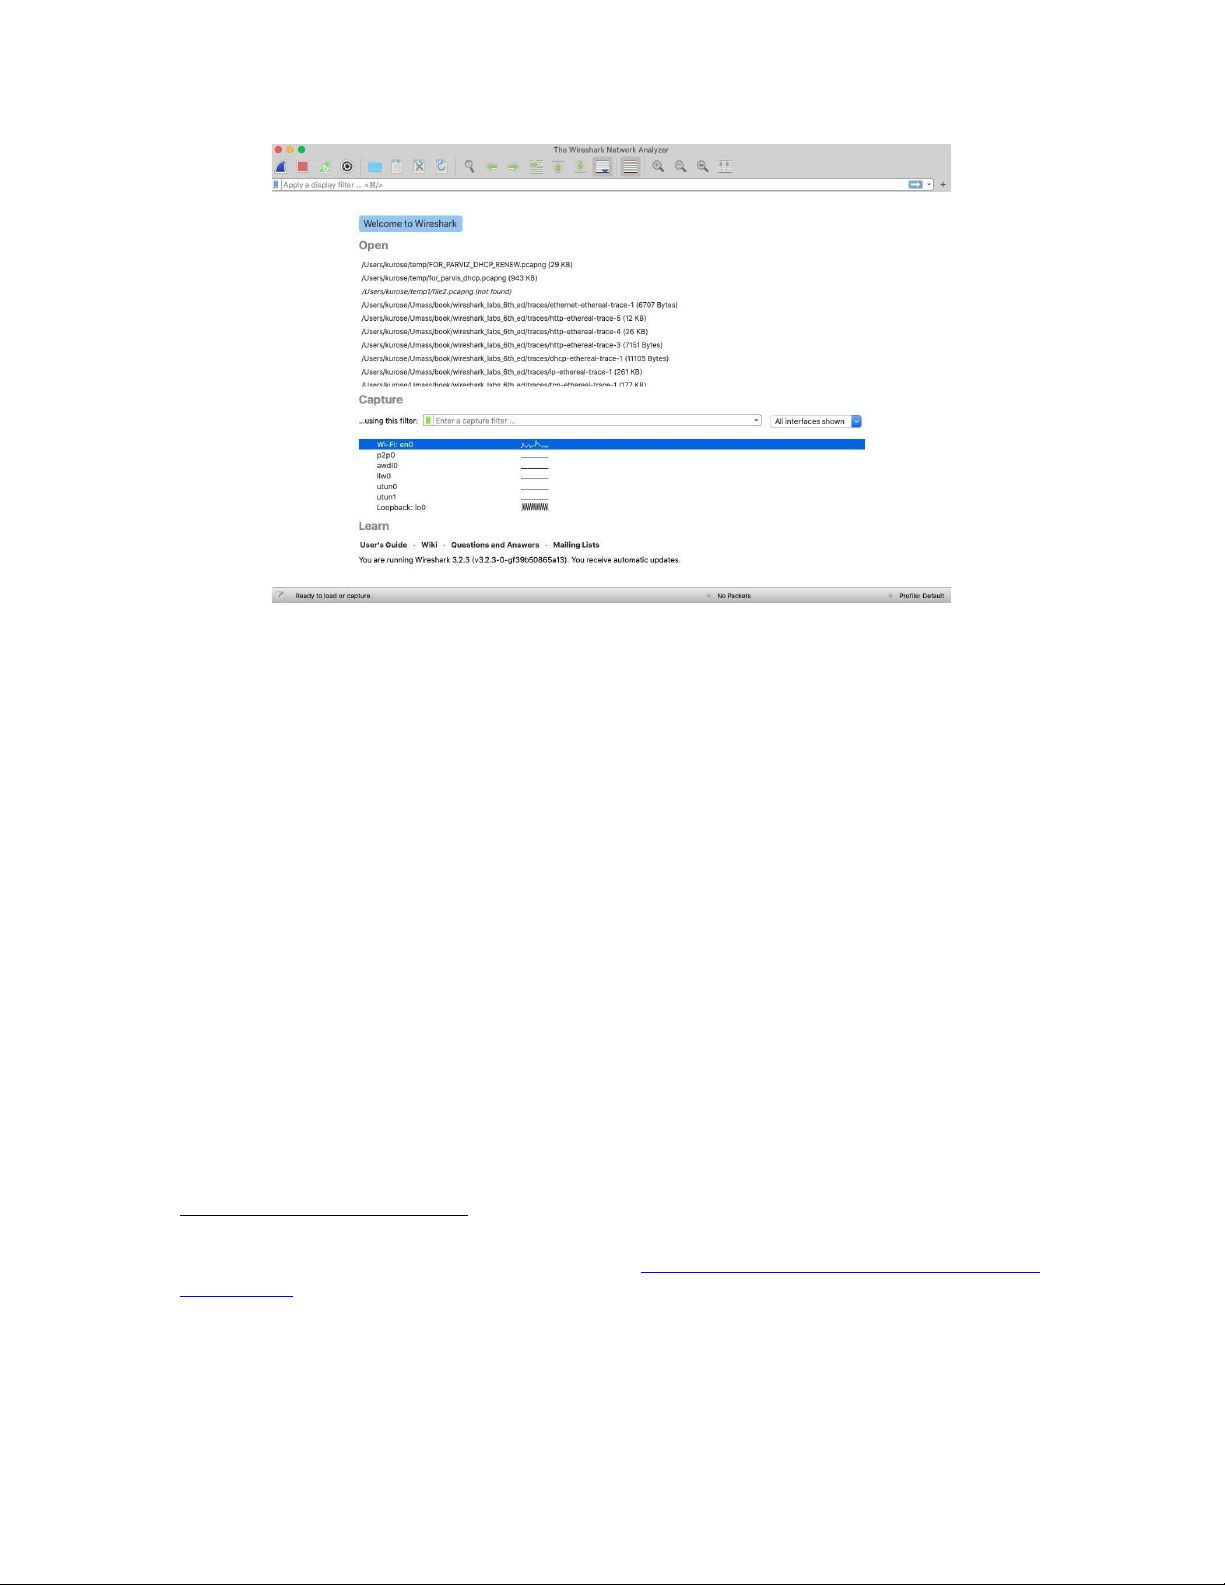
When you run the Wireshark program, you’ll get a startup screen that looks something like
the screen below. Different versions of Wireshark will have different startup screens – so
don’t panic if yours doesn’t look exactly like the screen below! The Wireshark
documentation states “As Wireshark runs on many different platforms with many different
window managers, different styles applied and there are different versions of the
underlying GUI toolkit used, your screen might look different from the provided
screenshots. But as there are no real differences in functionality these screenshots should
still be well understandable.” Well said. lOMoAR cPSD| 23136115
Figure 2: Initial Wireshark Screen
There’s not much that’s very interesting on this screen. But note that under the Capture
section, there is a list of so-called interfaces. The Mac computer we’re taking these
screenshots from has just one interface – “Wi-Fi en0,” (shaded in blue in Figure 2) which
is the interface for Wi-Fi access. All packets to/from this computer will pass through the
Wi-Fi interface, so it’s here where we’ll want to capture packets. On a Mac, double click
on this interface (or on another computer locate the interface on startup page through which
you are getting Internet connectivity, e.g., mostly likely a WiFi or Ethernet interface, and select that interface).
Let’s take Wireshark out for a spin! If you click on one of these interfaces to start packet
capture (i.e., for Wireshark to begin capturing all packets being sent to/from that interface),
a screen like the one below will be displayed, showing information about the packets being
captured. Once you start packet capture, you can stop it by using the Capture pull down
menu and selecting Stop (or by clicking on the red square button next to the Wireshark fin in Figure 2). 2
2 If you are unable to run Wireshark, you can still look at packet traces that were captured on one of the
author’s (Jim’s) computer. You can download the zip file http://gaia.cs.umass.edu/wiresharklabs/wireshark-
traces-8.1.zip and extract the trace file intro-wireshark-trace-1.pcap. [If you are using an Learning
Management System (LMS) to answer questions in this document, you may be instructed to open a
different version of this introductory trace file). Once you’ve downloaded a trace file, you can load it into
Wireshark and view the trace using the File pull down menu, choosing Open, and then and then selecting
the intro-wireshark-trace trace file. The resulting display should look similar to Figures 3 and 5. (The
Wireshark user interface displays just a bit differently on different operating systems, and in different versions of Wireshark). lOMoAR cPSD| 23136115
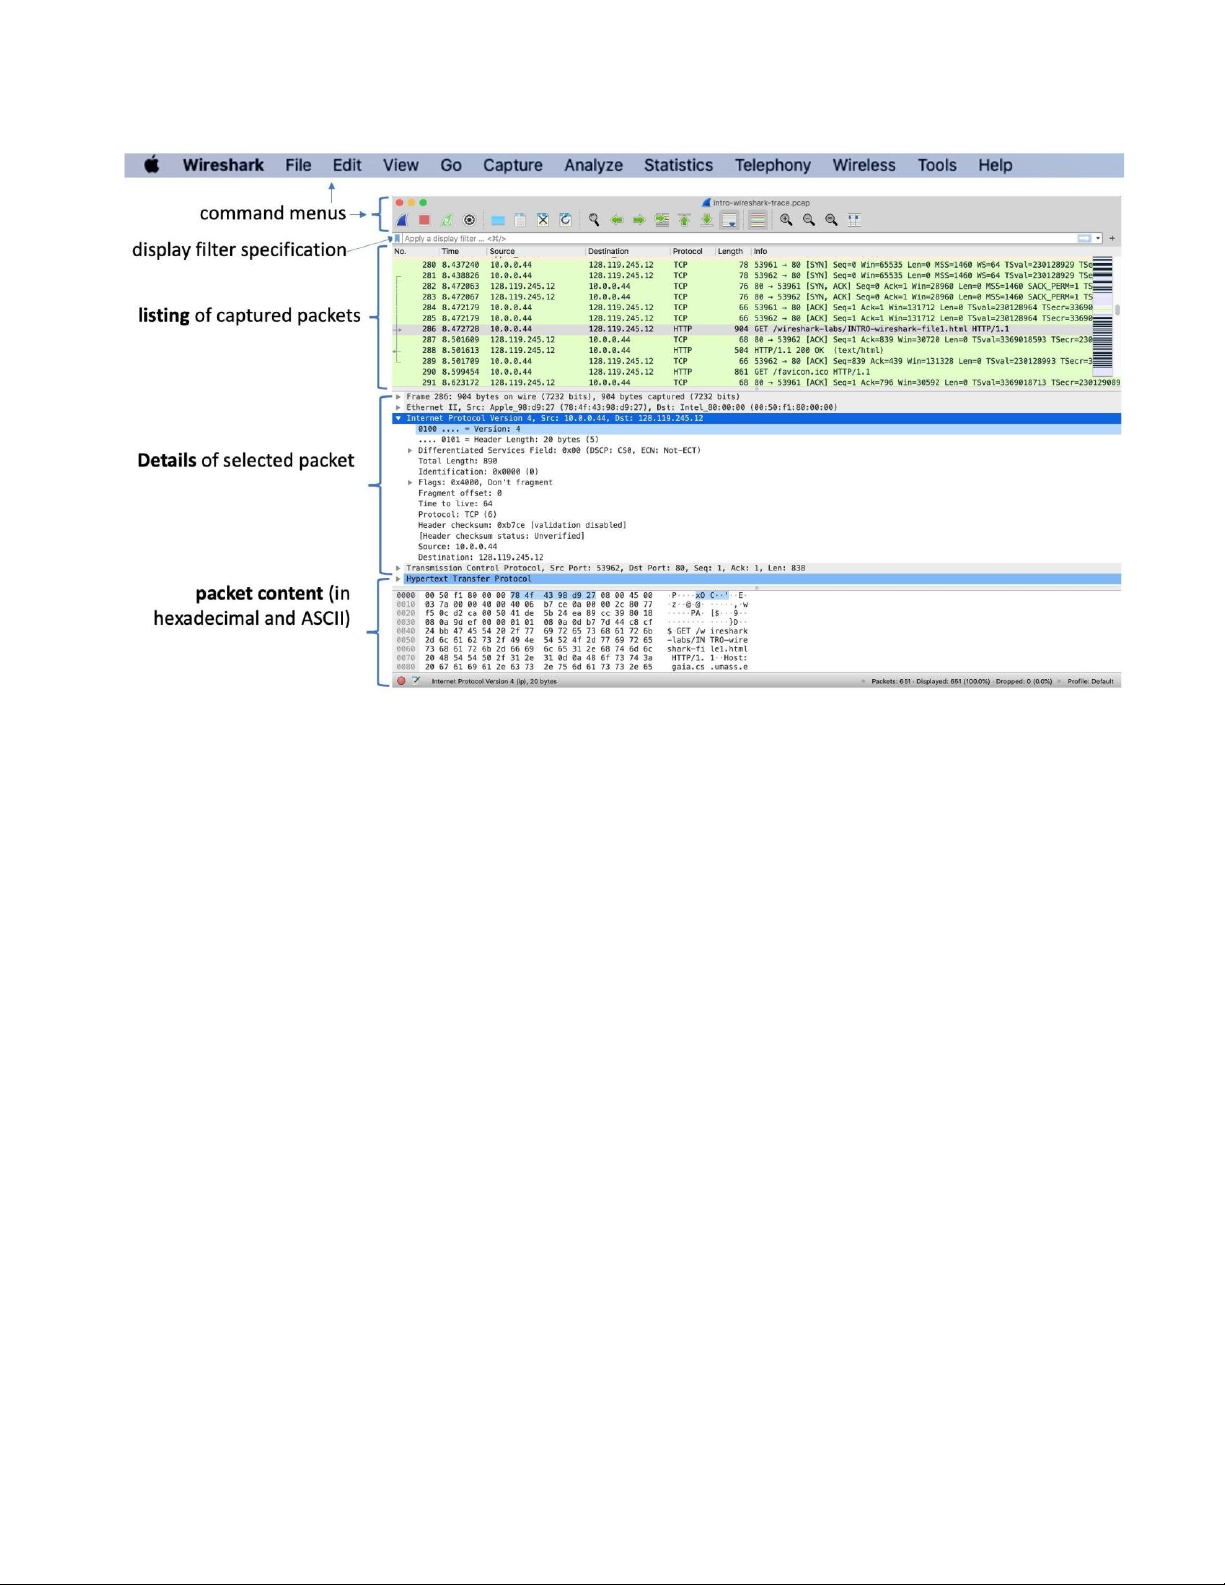
Figure 3: Wireshark window, during and after capture
This looks more interesting! The Wireshark interface has five major components:
• The command menus are standard pulldown menus located at the top of the
Wireshark window (and on a Mac at the top of the screen as well; the screenshot in
Figure 3 is from a Mac). Of interest to us now are the File and Capture menus. The
File menu allows you to save captured packet data or open a file containing
previously captured packet data and exit the Wireshark application. The Capture
menu allows you to begin packet capture.
• The packet-listing window displays a one-line summary for each packet captured,
including the packet number (assigned by Wireshark; note that this is not a packet
number contained in any protocol’s header), the time at which the packet was
captured, the packet’s source and destination addresses, the protocol type, and
protocol-specific information contained in the packet. The packet listing can be
sorted according to any of these categories by clicking on a column name. The
protocol type field lists the highest-level protocol that sent or received this packet,
i.e., the protocol that is the source or ultimate sink for this packet.
• The packet-header details window provides details about the packet selected
(highlighted) in the packet-listing window. (To select a packet in the packetlisting
window, place the cursor over the packet’s one-line summary in the packet-listing
window and click with the left mouse button.). These details include information
about the Ethernet frame (assuming the packet was sent/received over an Ethernet
interface) and IP datagram that contains this packet. lOMoAR cPSD| 23136115
The amount of Ethernet and IP-layer detail displayed can be expanded or
minimized by clicking on the plus/minus boxes or right/downward-pointing
triangles to the left of the Ethernet frame or IP datagram line in the packet details
window. If the packet has been carried over TCP or UDP, TCP or UDP details will
also be displayed, which can similarly be expanded or minimized. Finally, details
about the highest-level protocol that sent or received this packet are also provided.
• The packet-contents window displays the entire contents of the captured frame,
in both ASCII and hexadecimal format.
• Towards the top of the Wireshark graphical user interface, is the packet display
filter field, into which a protocol name or other information can be entered in order
to filter the information displayed in the packet-listing window (and hence the
packet-header and packet-contents windows). In the example below, we’ll use the
packet-display filter field to have Wireshark hide (not display) packets except those
that correspond to HTTP messages.
Taking Wireshark for a Test Run
The best way to learn about any new piece of software is to try it out! We’ll assume that
your computer is connected to the Internet via a wired Ethernet interface or a wireless
802.11 WiFi interface. Do the following:
1. Start up your favorite web browser, which will display your selected homepage.
2. Start up the Wireshark software. You will initially see a window similar to that
shown in Figure 2. Wireshark has not yet begun capturing packets.
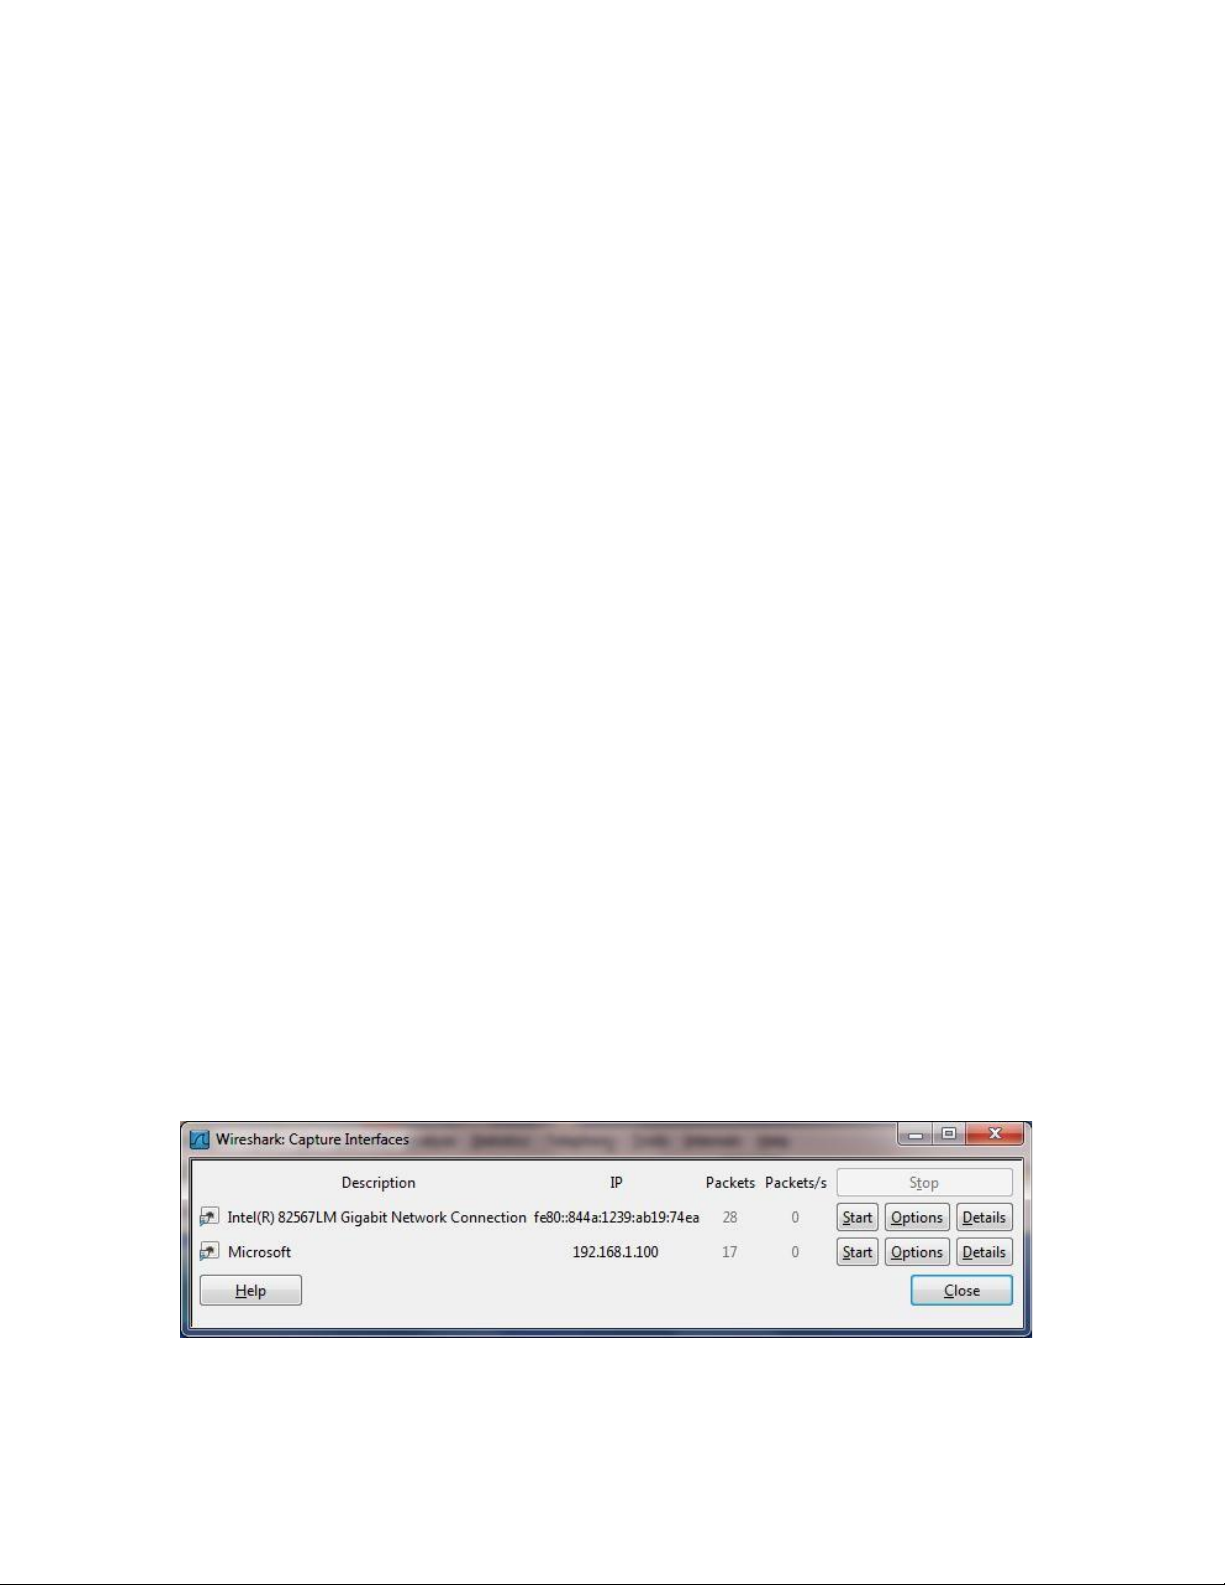
3. To begin packet capture, select the Capture pull down menu and select Interfaces.
This will cause the “Wireshark: Capture Interfaces” window to be displayed (on a
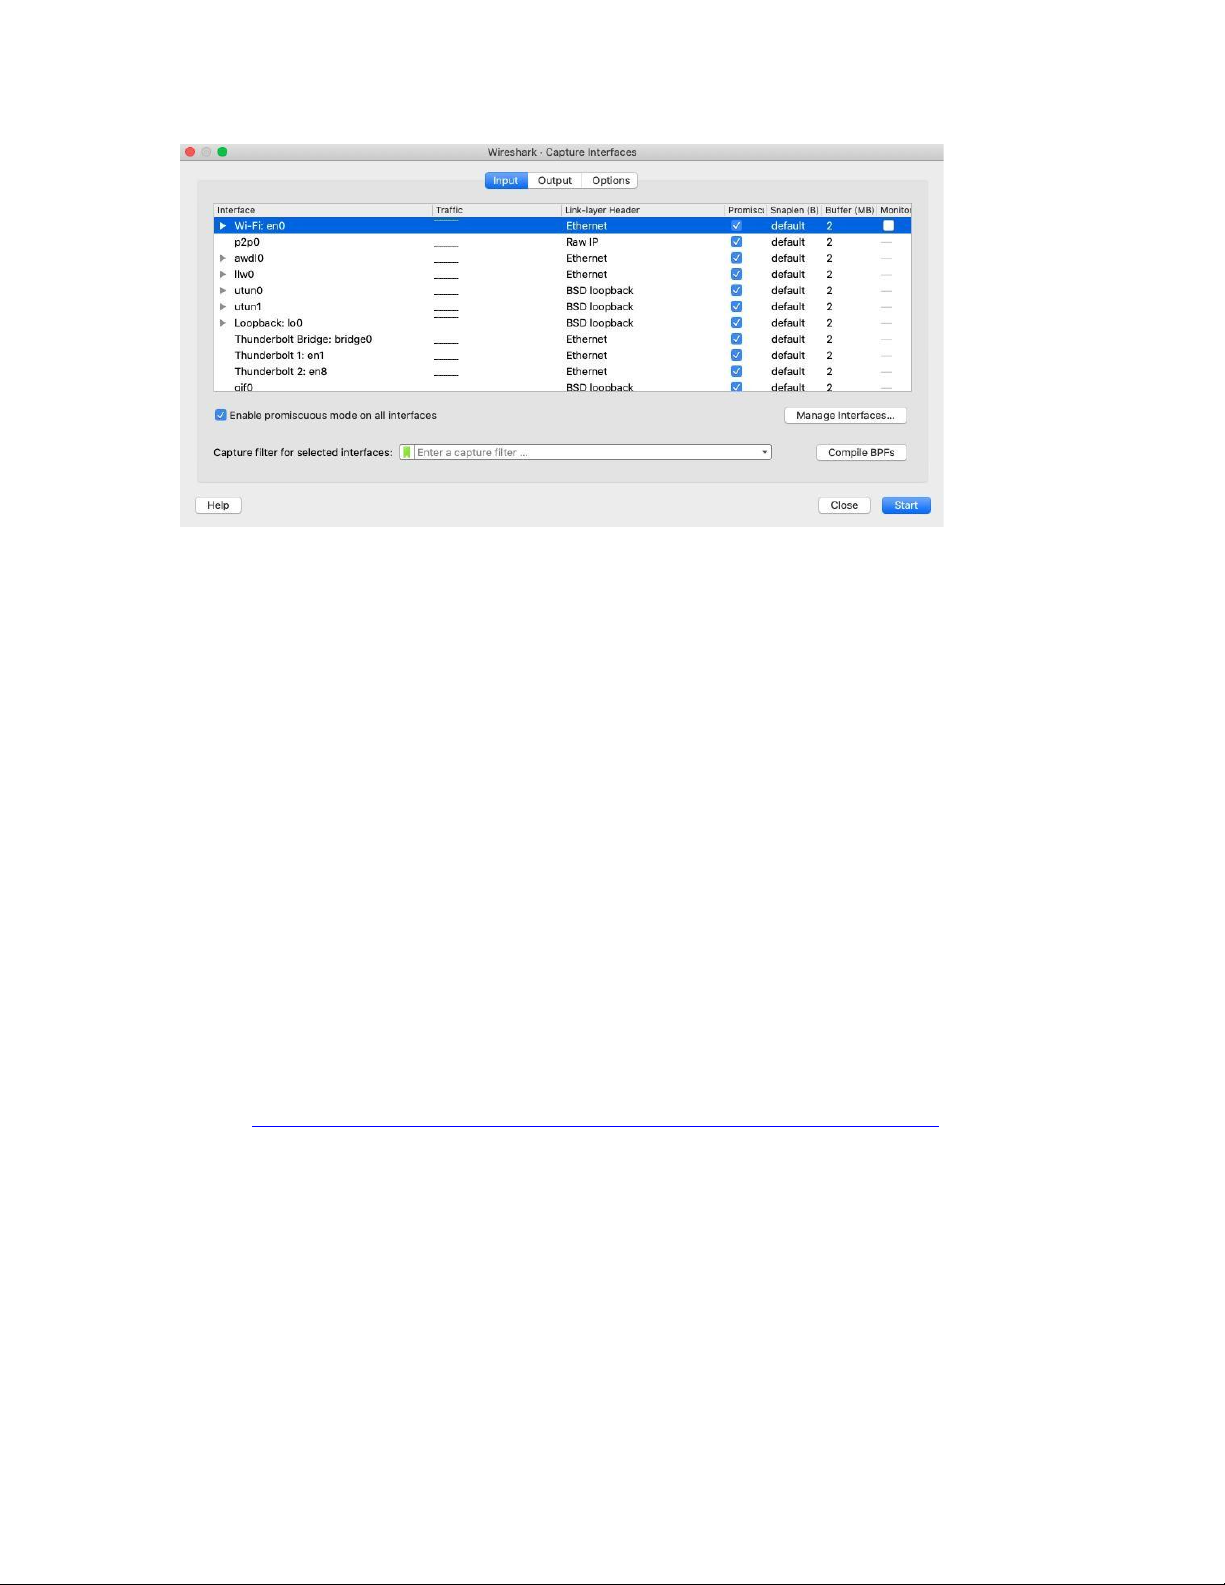
PC) or you can choose Options on a Mac. You should see a list of interfaces, as
shown in Figures 4a (Windows) and 4b (Mac).
Figure 4a: Wireshark Capture interface window, on a Windows computer lOMoAR cPSD| 23136115
Figure 4b: Wireshark Capture interface window, on a Mac computer
4. You’ll see a list of the interfaces on your computer as well as a count of the packets
that have been observed on that interface so far. On a Windows machine, click on
Start for the interface on which you want to begin packet capture (in the case in
Figure 4a, the Gigabit network Connection). On a Windows machine, select the
interface and click Start on the bottom of the window). Packet capture will now
begin - Wireshark is now capturing all packets being sent/received from/by your computer!
5. Once you begin packet capture, a window similar to that shown in Figure 3 will
appear. This window shows the packets being captured. By selecting Capture
pulldown menu and selecting Stop, or by click on the red Stop square, you can stop packet capture.
But don’t stop packet capture yet. Let’s capture some
interesting packets first. To do so, we’ll need to generate some network traffic. Let’s
do so using a web browser, which will use the HTTP protocol that we will study in
detail in class to download content from a website.
6. While Wireshark is running, enter the URL:
http://gaia.cs.umass.edu/wireshark-labs/INTRO-wireshark-file1.html and have
that page displayed in your browser. In order to display this page, your browser will
contact the HTTP server at gaia.cs.umass.edu and exchange HTTP messages with
the server in order to download this page, as discussed in section 2.2 of the text.
The Ethernet or WiFi frames containing these HTTP messages (as well as all other
frames passing through your Ethernet or WiFi adapter) will be captured by Wireshark.
7. After your browser has displayed the INTRO-wireshark-file1.html page (it is a
simple one line of congratulations), stop Wireshark packet capture by selecting stop
in the Wireshark capture window.
The main Wireshark window should now lOMoAR cPSD| 23136115
look similar to Figure 3. You now have live packet data that contains all protocol
messages exchanged between your computer and other network entities! The
HTTP message exchanges with the gaia.cs.umass.edu web server should appear
somewhere in the listing of packets captured. But there will be many other types of
packets displayed as well (see, e.g., the many different protocol types shown in the
Protocol column in Figure 3). Even though the only action you took was to
download a web page, there were evidently many other protocols running on your
computer that are unseen by the user. We’ll learn much more about these protocols
as we progress through the text! For now, you should just be aware that there is
often much more going on than “meet’s the eye”!
8. Type in “http” (without the quotes, and in lower case – all protocol names are in
lower case in Wireshark, and make sure to press your enter/return key) into the
display filter specification window at the top of the main Wireshark window. Then
select Apply (to the right of where you entered “http”) or just hit return.
This will cause only HTTP message to be displayed in the packet-listing window.
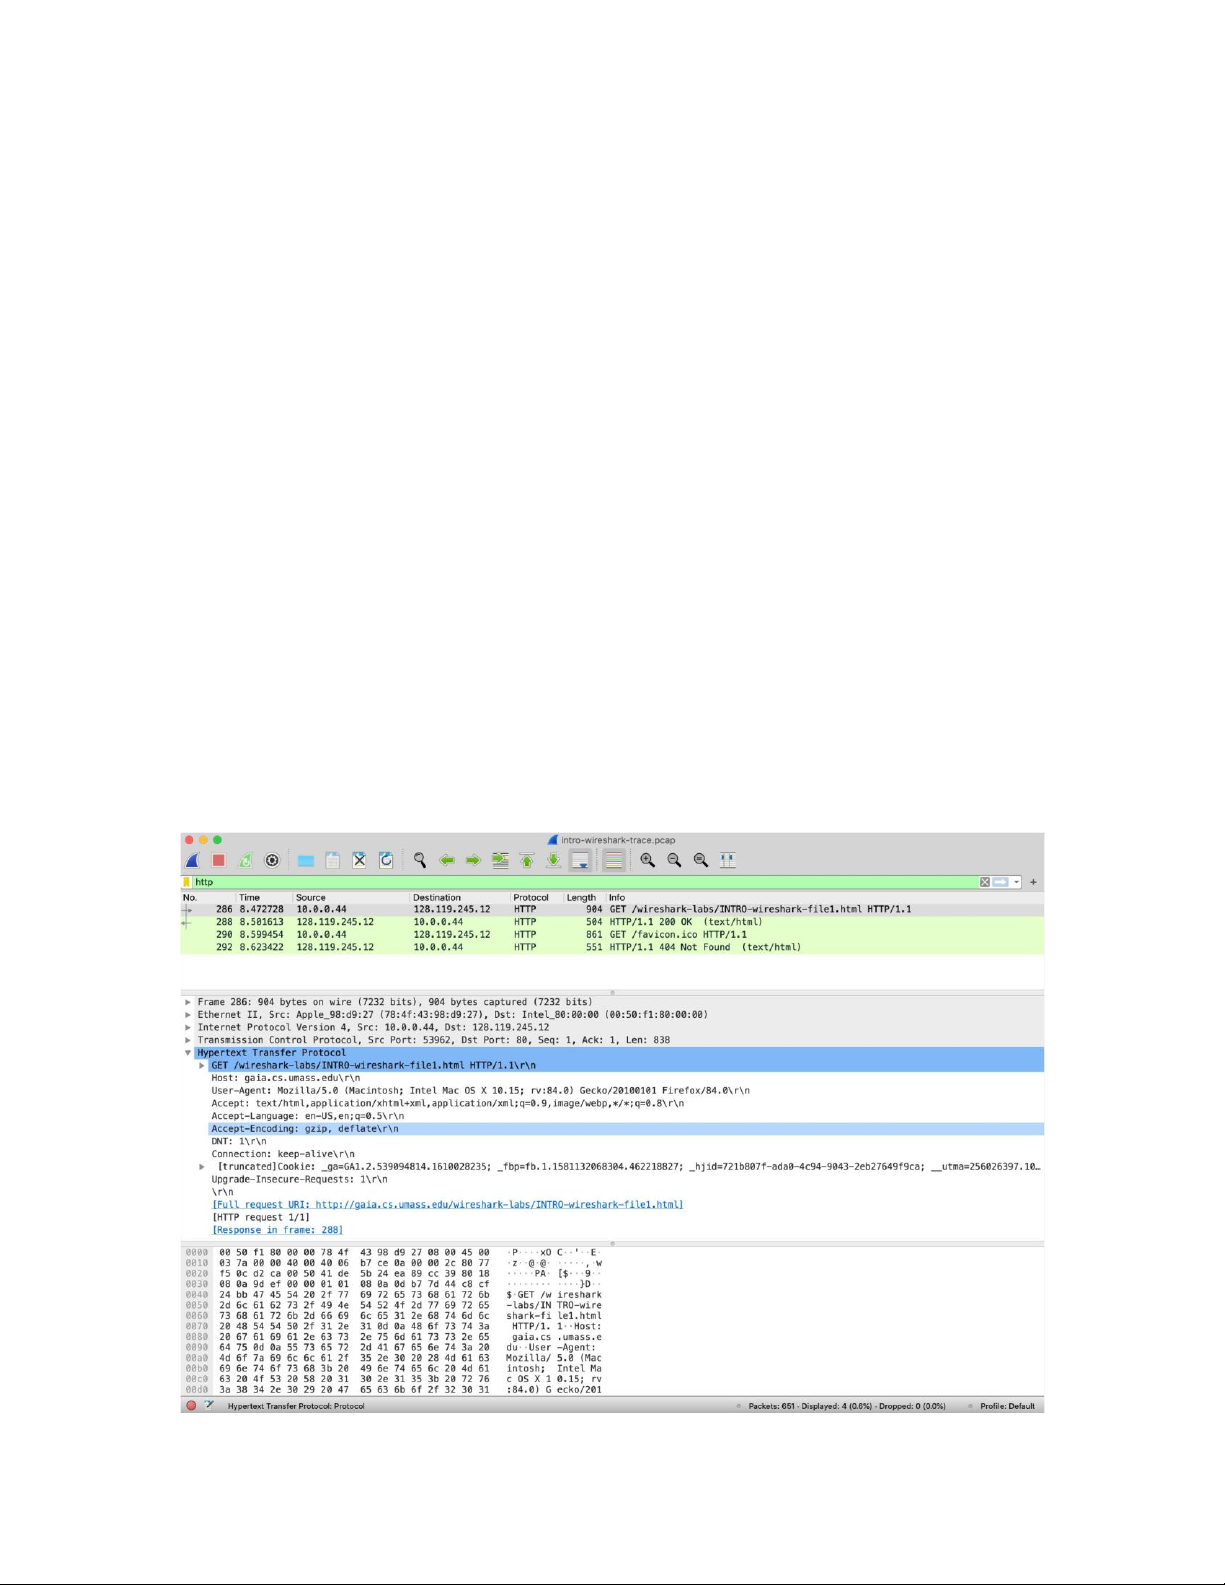
Figure 5 below shows a screenshot after the http filter has been applied to the packet
capture window shown earlier in Figure 3. Note also that in the Selected packet
details window, we’ve chosen to show detailed content for the Hypertext Transfer
Protocol application message that was found within the TCP segment, that was
inside the IPv4 datagram that was inside the Ethernet II (WiFi) frame. Focusing on
content at a specific message, segment, datagram and frame level lets us focus on
just what we want to look at (in this case HTTP messages). lOMoAR cPSD| 23136115
Figure 5: looking at the details of the HTTP message that contained a GET of
http://gaia.cs.umass.edu/wireshark-labs/INTRO-wireshark-file1.html
9. Find the HTTP GET message that was sent from your computer to the
gaia.cs.umass.edu HTTP server. (Look for an HTTP GET message in the “listing
of captured packets” portion of the Wireshark window (see Figures 3 and 5) that
shows “GET” followed by the gaia.cs.umass.edu URL that you entered. When you
select the HTTP GET message, the Ethernet frame, IP datagram, TCP segment, and
HTTP message header information will be displayed in the packetheader window3.
By clicking on ‘+’ and ‘-' and right-pointing and down-pointing arrowheads to the
left side of the packet details window, minimize the amount of Frame, Ethernet,
Internet Protocol, and Transmission Control Protocol information displayed.
Maximize the amount information displayed about the HTTP protocol. Your
Wireshark display should now look roughly as shown in Figure 5. (Note, in
particular, the minimized amount of protocol information for all protocols except
HTTP, and the maximized amount of protocol information for HTTP in the packet- header window). 10. Exit Wireshark
Congratulations! You’ve now completed the first lab!
Now answer the questions below. If you’re doing this lab as part of class, your teacher will
provide details about how to hand in assignments, whether written or in a learning
management system (LMS).4 If you’re unable to run Wireshark on a live network
connection or are answering questions via an LMS, you can download a packet trace file
that was captured while following the steps above4.
1. Which of the following protocols are shown as appearing (i.e., are listed in the
Wireshark “protocol” column) in your trace file: TCP, QUIC, HTTP, DNS, UDP, TLSv1.2?
2. How long did it take from when the HTTP GET message was sent until the HTTP
OK reply was received? (By default, the value of the Time column in the
3 Recall that the HTTP GET message that is sent to the gaia.cs.umass.edu web server is contained within a
TCP segment, which is contained (encapsulated) in an IP datagram, which is encapsulated in an Ethernet
frame. If this process of encapsulation isn’t quite clear yet, review section 1.5 in the text 4 For the author’s
class and written answers, students print out the GET and response messages and indicate where in the
message they’ve found the information that answers a question. They do this by marking paper copies
with a pen or annotating electronic copies with text in a colored font. There are LMS modules for teachers
that allow students to answer these questions online and have answers auto-graded
for these Wireshark labs at http://gaia.cs.umass.edu/kurose_ross/lms.htm
4 You can download the zip file http://gaia.cs.umass.edu/wireshark-labs/wireshark-traces-8.1.zip and
extract the trace file intro-wireshark-trace1-1. This trace file can be used to answer these Wireshark lab
questions without actually capturing packets on your own. Each trace was made using Wireshark running
on one of the author’s computers, while performing the steps indicated in the Wireshark lab. Once you’ve
downloaded a trace file, you can load it into Wireshark and view the trace using the File pull down menu,
choosing Open, and then selecting the trace file name. lOMoAR cPSD| 23136115
packetlisting window is the amount of time, in seconds, since Wireshark tracing
began. (If you want to display the Time field in time-of-day format, select the Wireshark
View pull down menu, then select Time Display Format, then select Time-of-day.)
3. What is the Internet address of the gaia.cs.umass.edu (also known as
wwwnet.cs.umass.edu)? What is the Internet address of your computer or (if you
are using the trace file) the computer that sent the HTTP GET message?
To answer the following two questions, you’ll need to select the TCP packet containing the
HTTP GET request (hint: this is packet number 2865 ). The purpose of these next two
questions is to familiarize you with using Wireshark’s “Details of selected packet window”;
see Figure 3. To do this, click on Packet 286 (your screen should look similar to Figure 3).
To answer the first question below, then look in the “Details of selected packet” window
toggle the triangle for HTTP (your screen should then look similar to Figure 5); for the
second question below, you’ll need to expand the information on the Transmission Control
Protocol (TCP) part of this packet.
4. Expand the information on the HTTP message in the Wireshark “Details of selected
packet” window (see Figure 3 above) so you can see the fields in the HTTP GET
request message. What type of Web browser issued the HTTP request? The answer
is shown at the right end of the information following the “UserAgent:” field in the
expanded HTTP message display. [This field value in the
HTTP message is how a web server learns what type of browser you are using.]
Firefox, Safari, Microsoft Internet Edge, Other
5. Expand the information on the Transmission Control Protocol for this packet in the
Wireshark “Details of selected packet” window (see Figure 3 in the lab writeup) so
you can see the fields in the TCP segment carrying the HTTP message. What is the
destination port number (the number following “Dest Port:” for the TCP segment
containing the HTTP request) to which this HTTP request is being sent? And finally ...
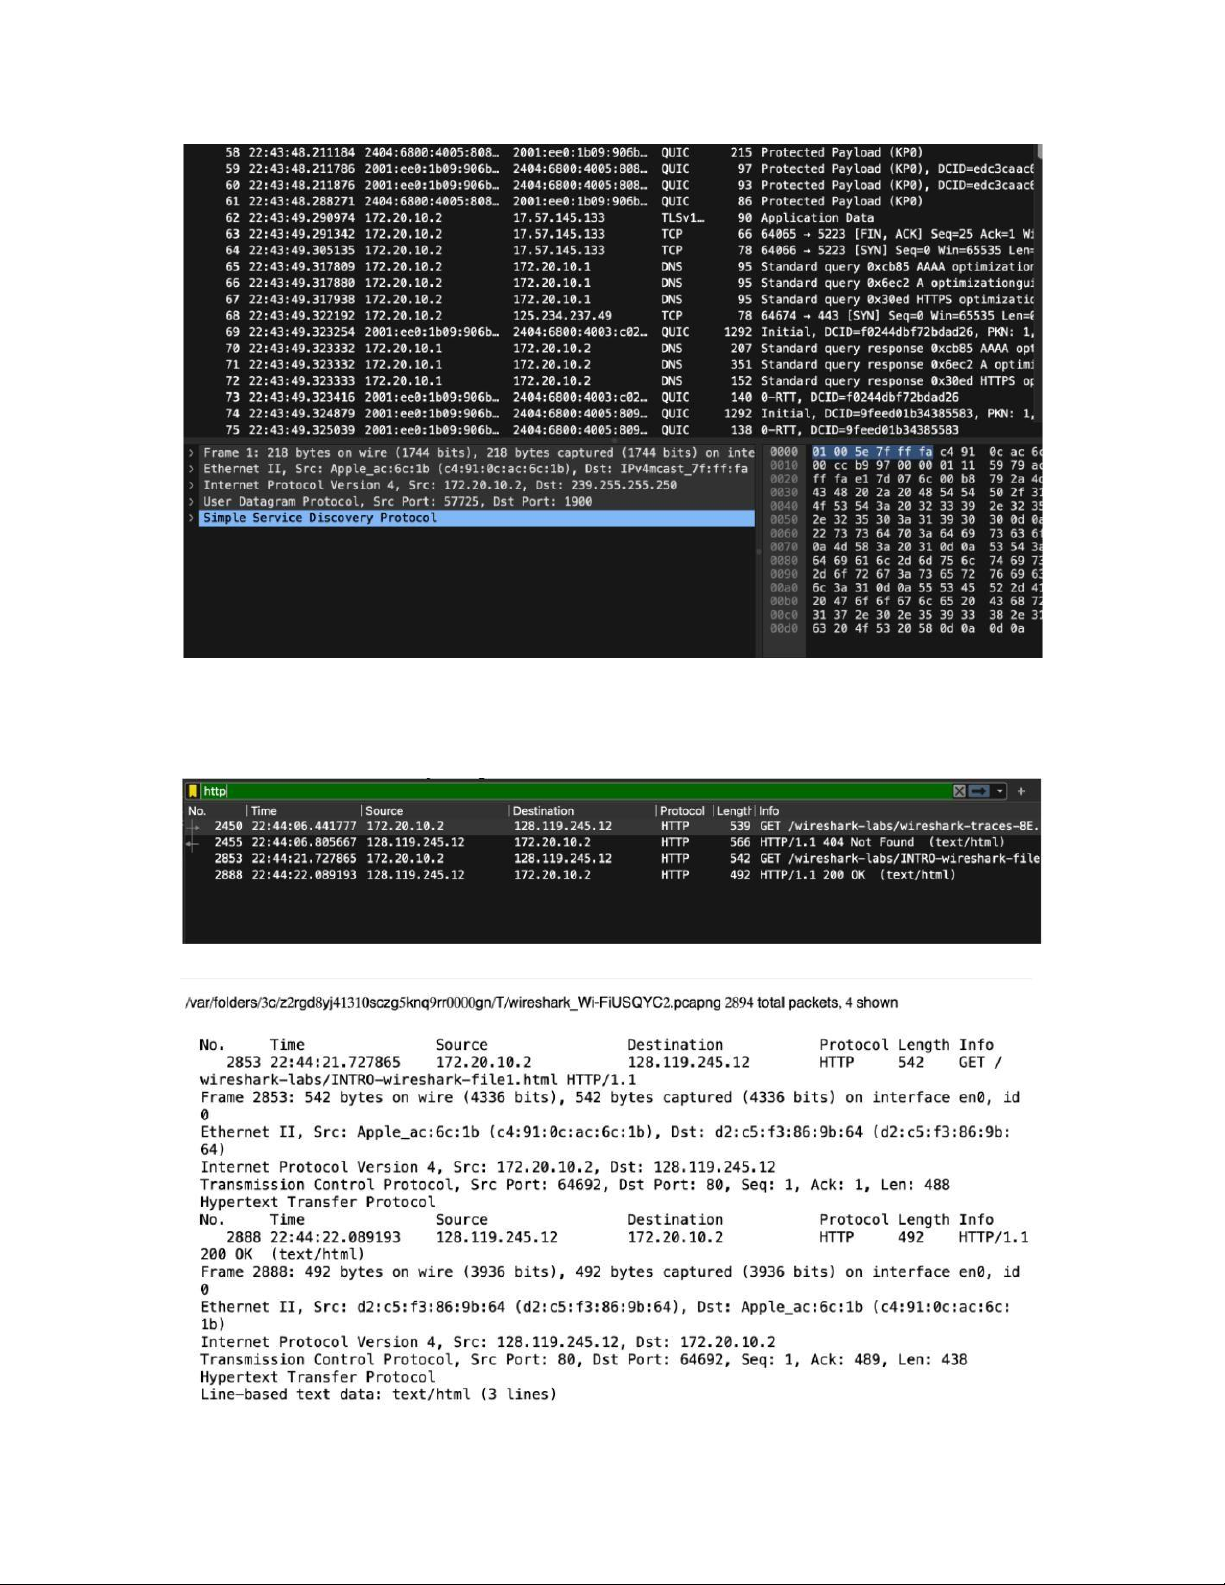
6. Print the two HTTP messages (GET and OK) referred to in question 2 above. To
do so, select Print from the Wireshark File command menu, and select the “Selected
Packet Only” and “Print as displayed” radial buttons, and then click OK. Answer:
1) Protocol: HTTP, UDP, ARP, XID, DHCP
5 Remember that this “packet number” is assigned by Wireshark for listing purposes only; it is NOT a
packet number contained in any real packet header. lOMoAR cPSD| 23136115 2) 0.361328 seconds
3)Internet address of gaia.cs.umass.edu 128.119.245.12
Internet of my computer 171.20.10.2 6) lOMoAR cPSD| 23136115 4) Safari broswer 5)
The destination port number is 80. Expand:When you expand the "Transmission Control
Protocol" (TCP) section in Wireshark for Packet 286, you will see several important fields, including:
Source Port (Src Port)Usually, this is a random ephemeral port (e.g., 53962 in Figure 3).
Destination Port (Dest Port) For HTTP traffic, this is typically 80. For HTTPS, it would be 443.
Sequence Number,Acknowledgment Number.
Tài liệu liên quan:
-
Lab 5 - Analyzing TCP & UDP Protocols | Môn Computer Network - Trường Đại học Quốc tế, Đại học Quốc gia Thành phố Hồ Chí Minh
110 55 -
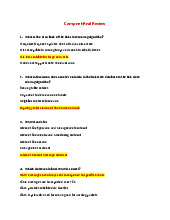
Final Review: Link State & Distance Vector Routing Insights | Môn Computer Network - Trường Đại học Quốc tế, Đại học Quốc gia Thành phố Hồ Chí Minh
103 52 -
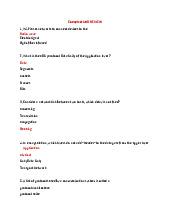
Mid Review: Key Concepts and Practice Questions | Môn Computer Network - Trường Đại học Quốc tế, Đại học Quốc gia Thành phố Hồ Chí Minh
125 63 -
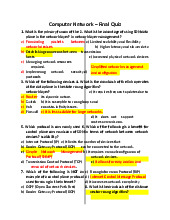
Final Quiz Questions and Answers | Môn Computer Network - Trường Đại học Quốc tế, Đại học Quốc gia Thành phố Hồ Chí Minh
127 64