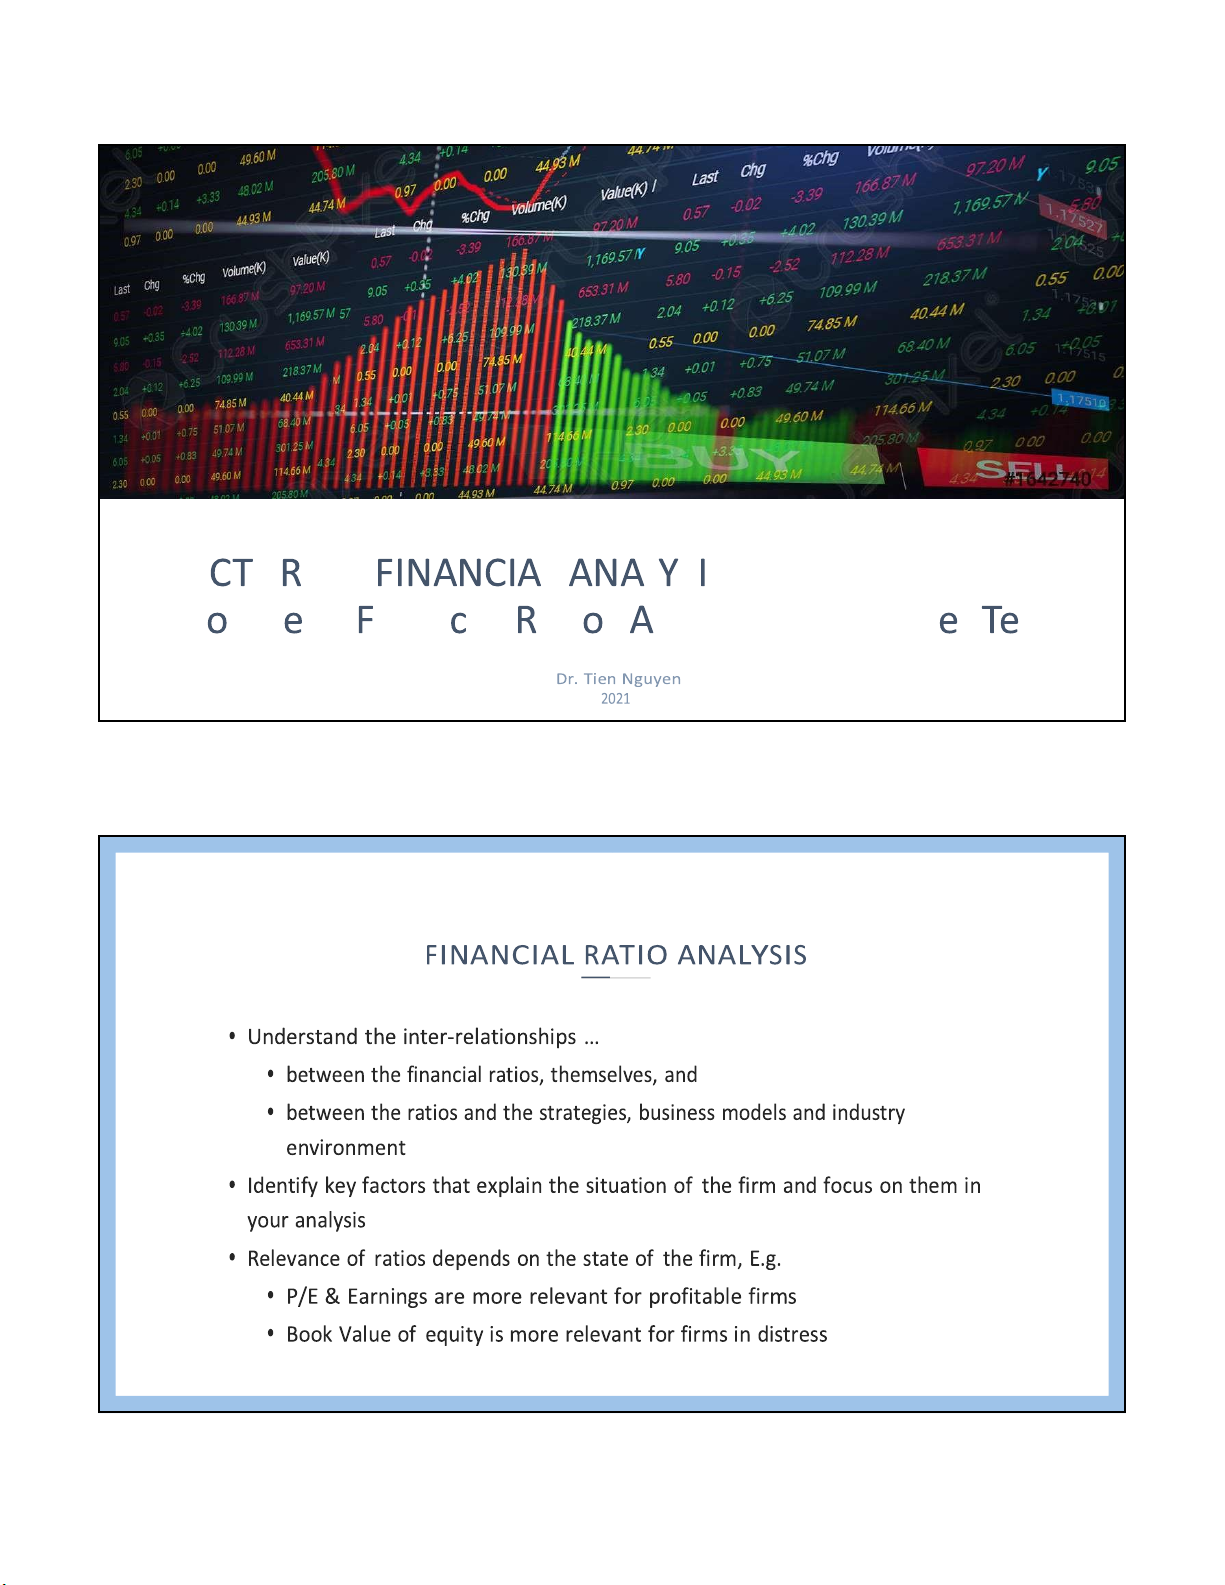
Lecture 4 Module 2 Financial Ratios Analysis and Market Tests
Tài liệu học tập môn Business Analysis and Valuation (BAV 2023) tại Trường Đại học Quốc tế, Đại học Quốc gia Thành phố Hồ Chí Minh giúp bạn học tập, ôn luyện và đạt điểm cao!
Môn: Business Analysis and Valuation (BAV 2023) 6 tài liệu
Trường: Trường Đại học Quốc tế, Đại học Quốc gia Thành phố Hồ Chí Minh 1.9 K tài liệu
Tác giả:


Preview text:
lOMoARcPSD|364 906 32 9/27/2022 L E U E 4 : L L S S M
d u l 2 : i n a n i a l a t i s
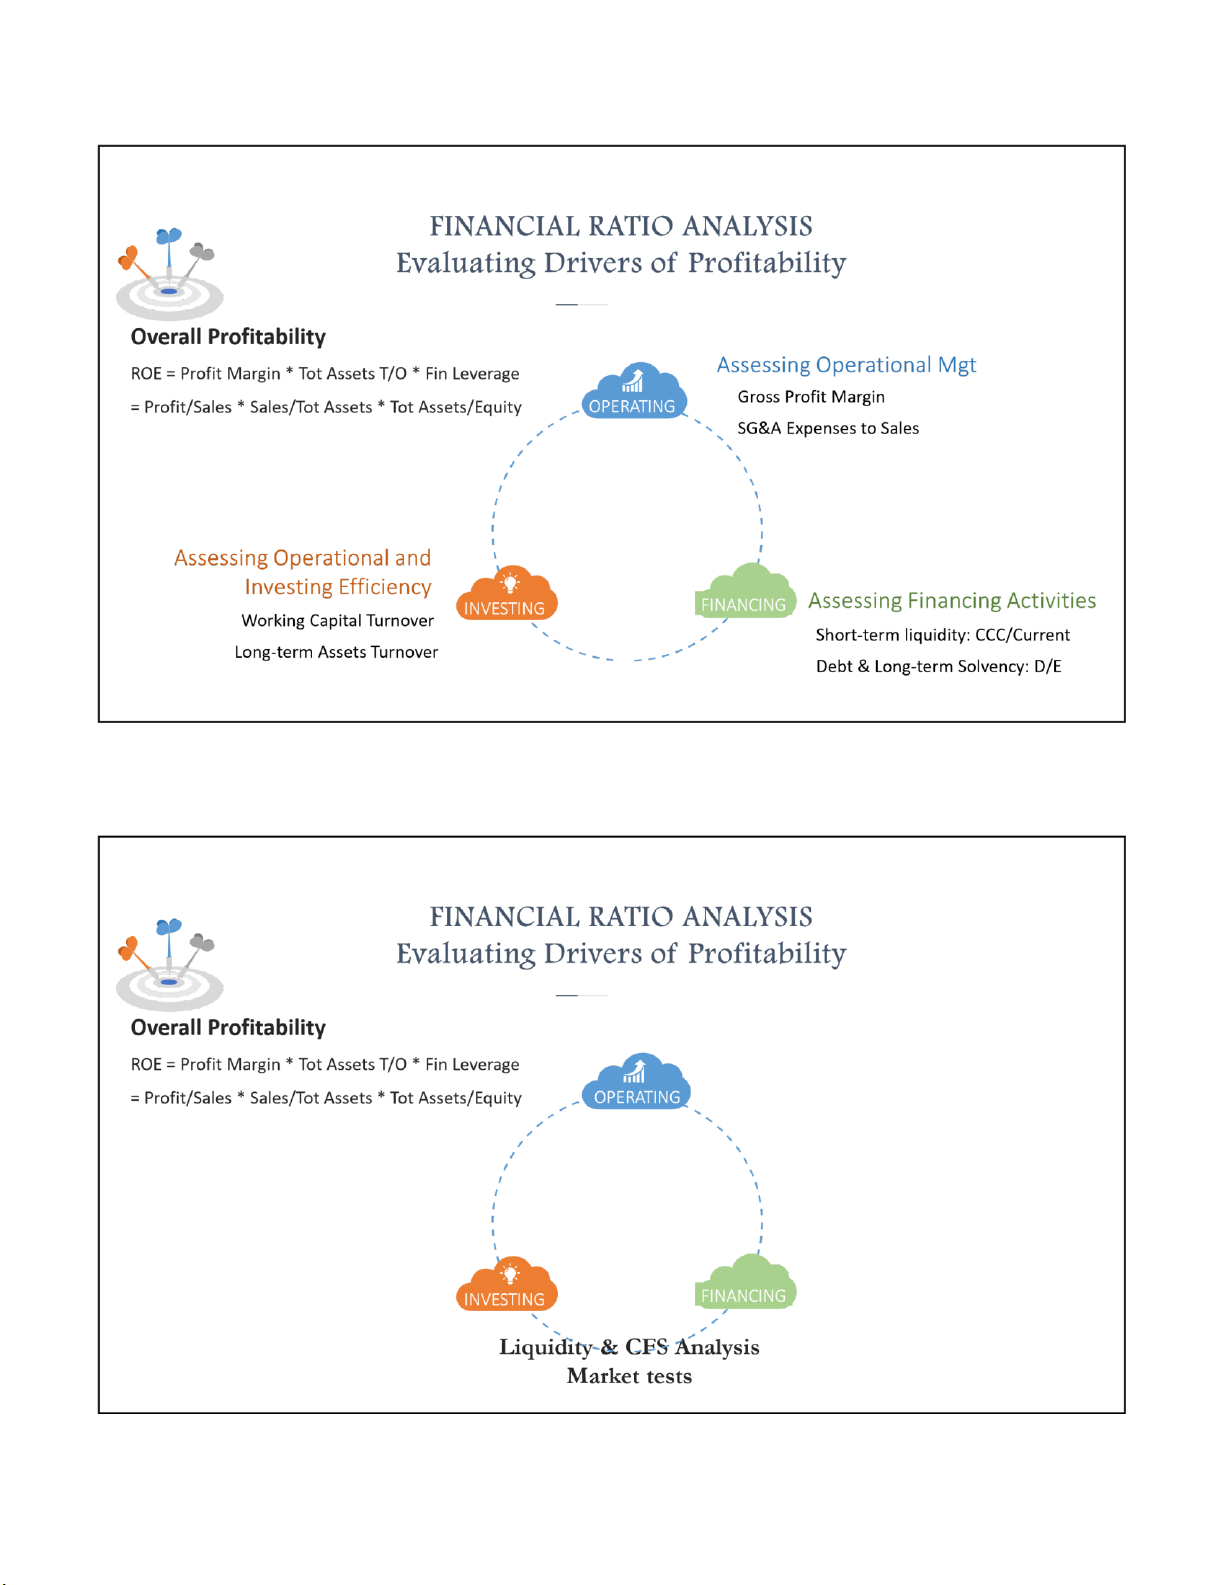
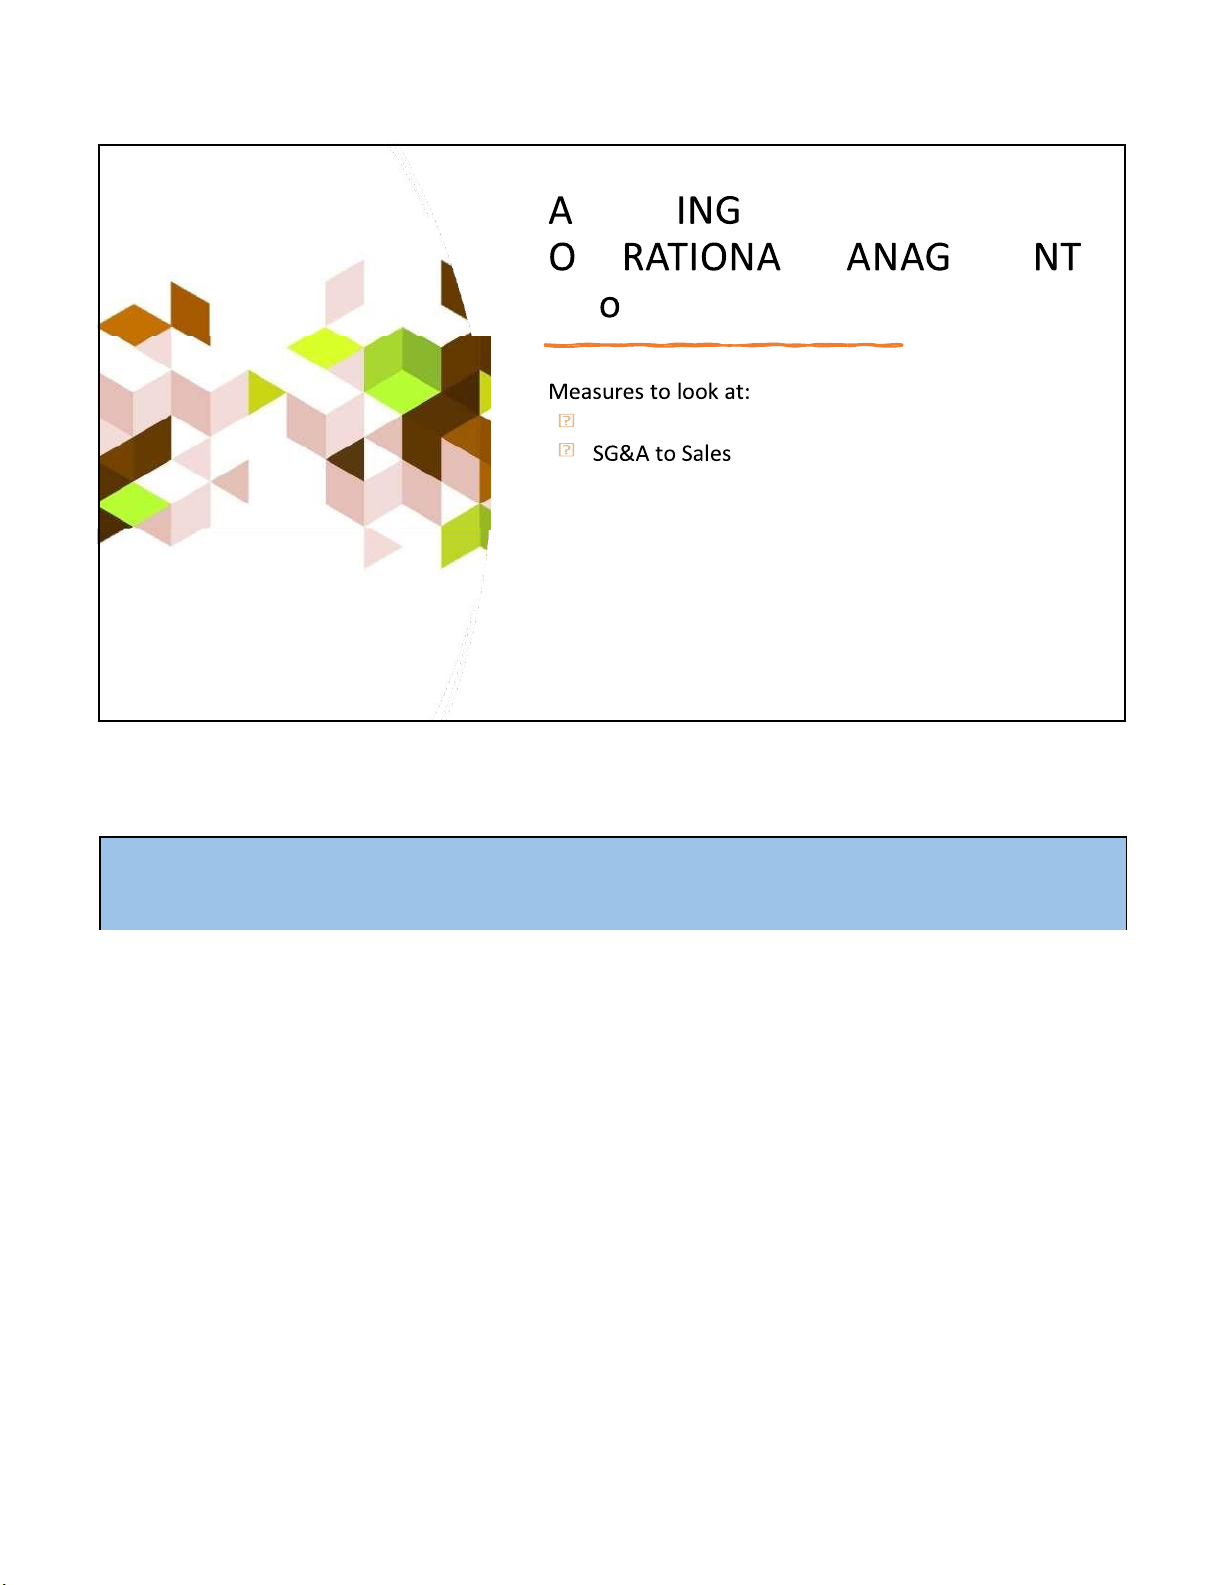
n a l y s i s a n d M a r k t s t s 1 lOMoARcPSD|364 906 32 9/27/2022 2 lOMoARcPSD|364 906 32 9/27/2022 S S E S S P E L M E M E ( P r f i t a b i l i t y ) Gross Profit Margin 3 lOMoARcPSD|364 906 32 9/27/2022
ASSESSING OPERATIONAL MANAGEMENT Note: depends on GROSS PROFIT MARGIN Degree of competitors Customer powers (low) Substitution (low)
pricing strategy (uniqueness of the product) vs. cost
structure Note: depends on • This ratio allows a focus on average unit mark-ups Supplier power (ability to access low-cost materials) = sales - COGS
Gross_Profit Degree of new/updated prod. process GPM Sales
• A high GPM implies that firm has relatively more flexible in product pricing and
less vulnerable to change in cost
• Other margins include: net profit margin (NI/Sales), EBIT margin (EBIT/Sales) 4 lOMoARcPSD|364 906 32 9/27/2022
• E.g. Huu Lien Asia JSC. (HOSE: HLA) is a Vietnamese steel manufacturer. Its
historical margin ratios are as follow: 2009 2010 2011 2012 2013 * Gross Profit Margin (GM) 10% 11% 8% 6% 0.3% * NI Margin (NM) 2.6% 0.5% 0.06% 0.3% Loss * Sales growth rate 39% 14% 13% 52% -18% * COGS growth rate 34% 12% 16% 56% -14% * COGS / sale 90% 89% 92% 94% 99.7%
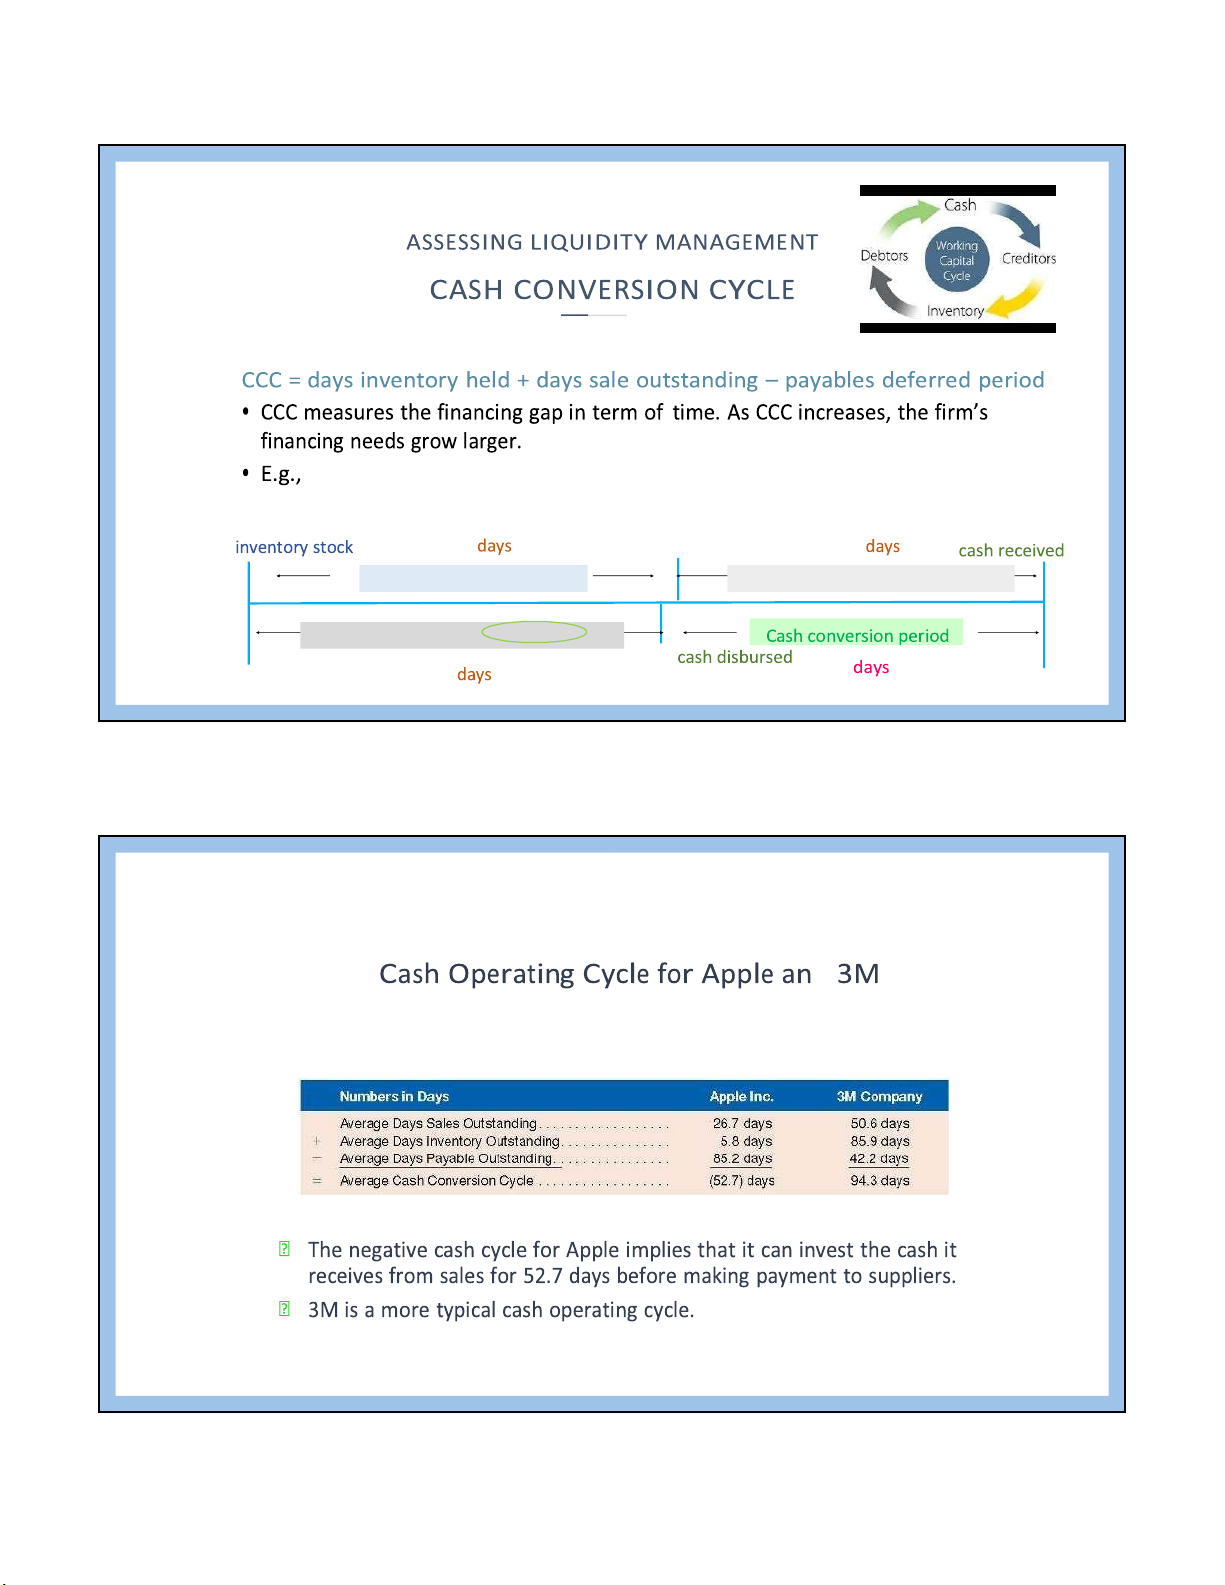
HLC reported net loss of –VND235b. in 2013 5 lOMoARcPSD|364 906 32 9/27/2022 S S E S S P E L & E S E E Working Capital Turnover; AR Turnover; Fixed Assets Turnover d 6 lOMoARcPSD|364 906 32 9/27/2022 net sale Days_Inventory_held 7 lOMoARcPSD|364 906 32 9/27/2022 Minh Phu Seafood Corp. (MPC) 2009 2010 2011 2012
• E.g. The Vietnamese aqua-product industry has an industry inventory T/O of 4.08 (2 * Inv 0 ent 11 ory ) T an /O d 3.46 (2012) 3.6 4.4 3.3 3 *Inventory Days Outstanding 102 83 111 120 MPC, 2012: Marine Product No. 3 Com - pa G nyrow th inventory 98% - G 2009 rowth COG 2010 S 18% 2011 * Inventory T/O 24.6 30.6 22.28 *Inventory Days Outstanding 15 12 16 Marine No. 3, 2012: - Stop operating in seafood product Fixed_Asse ts_turnove r 8 lOMoARcPSD|364 906 32 9/27/2022
• E.g. Lamson Sugar Cane (HOSE Ticker: LSS) is a Vietnamese sugar producer.
Historically the company has reported the following turnover ratio.
What do we know about the efficiency? 2010 2011 2012 2013 * Tangible Fixed Assets T/O 6.63 9.02 2.81 1.54 * Sale growth rate 22% 51% -7% -2%
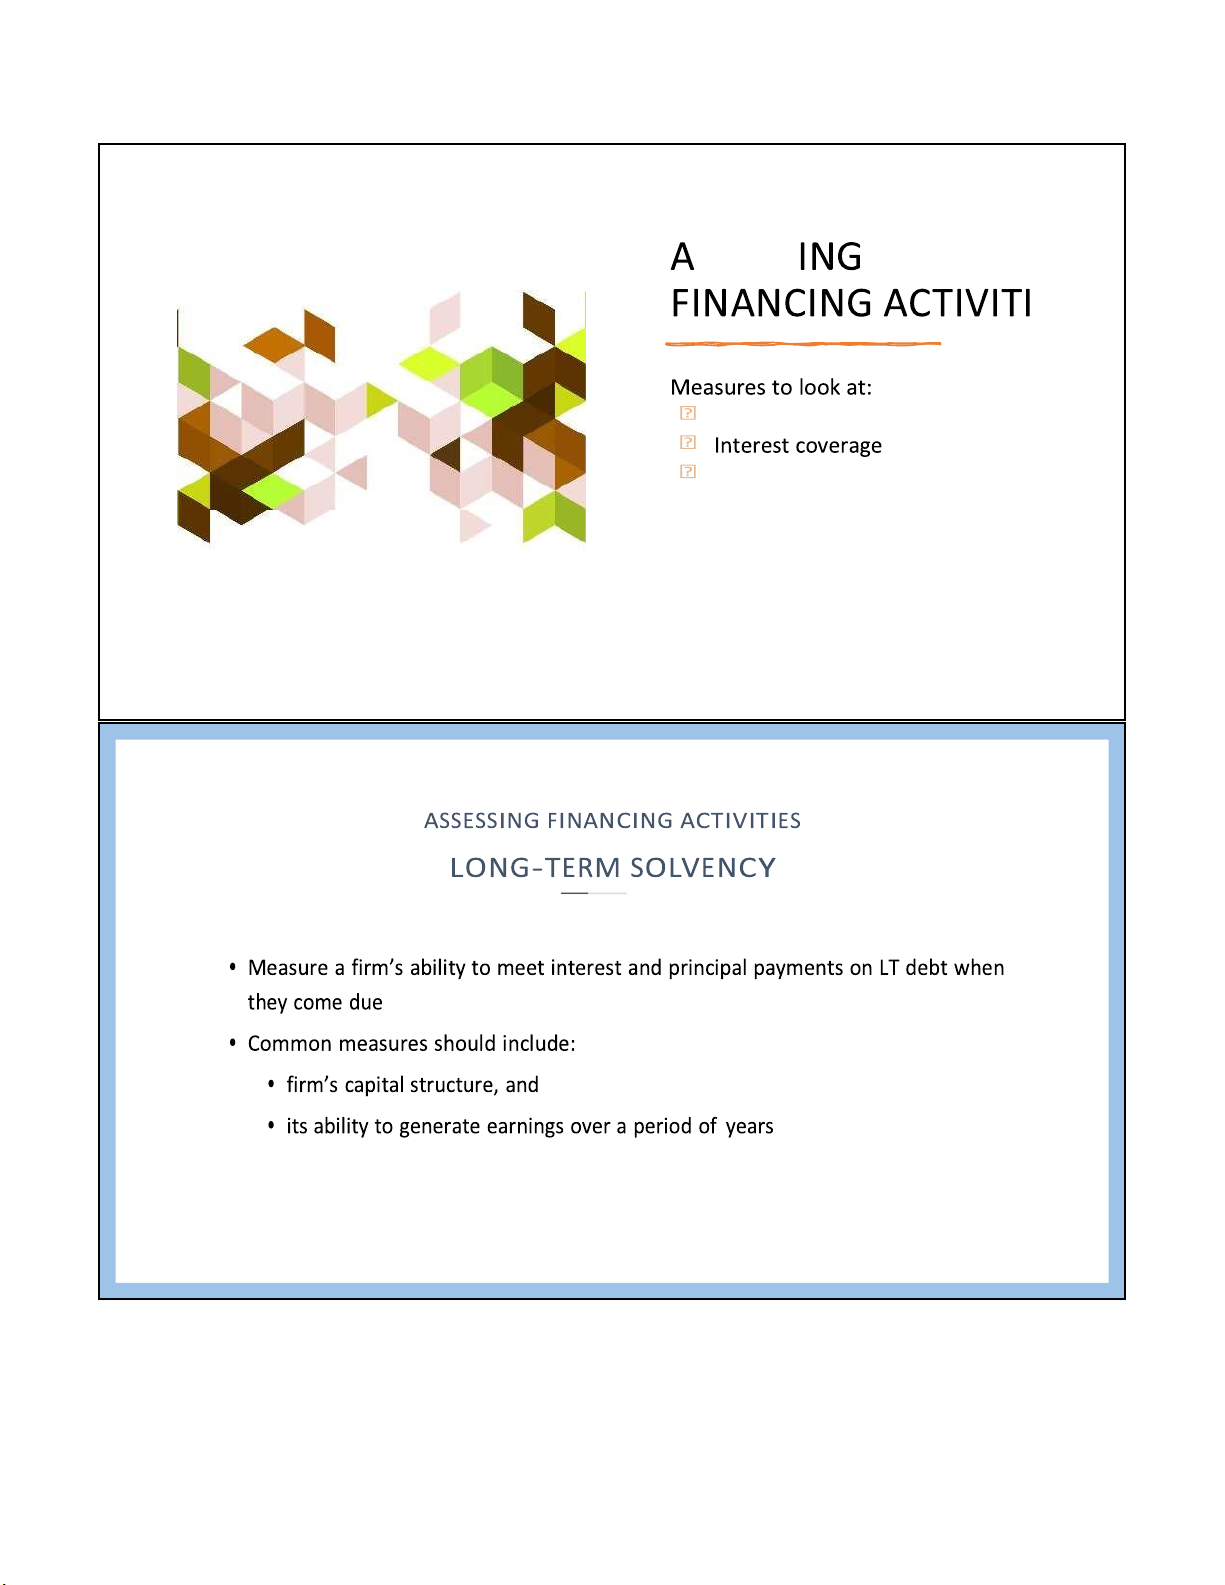
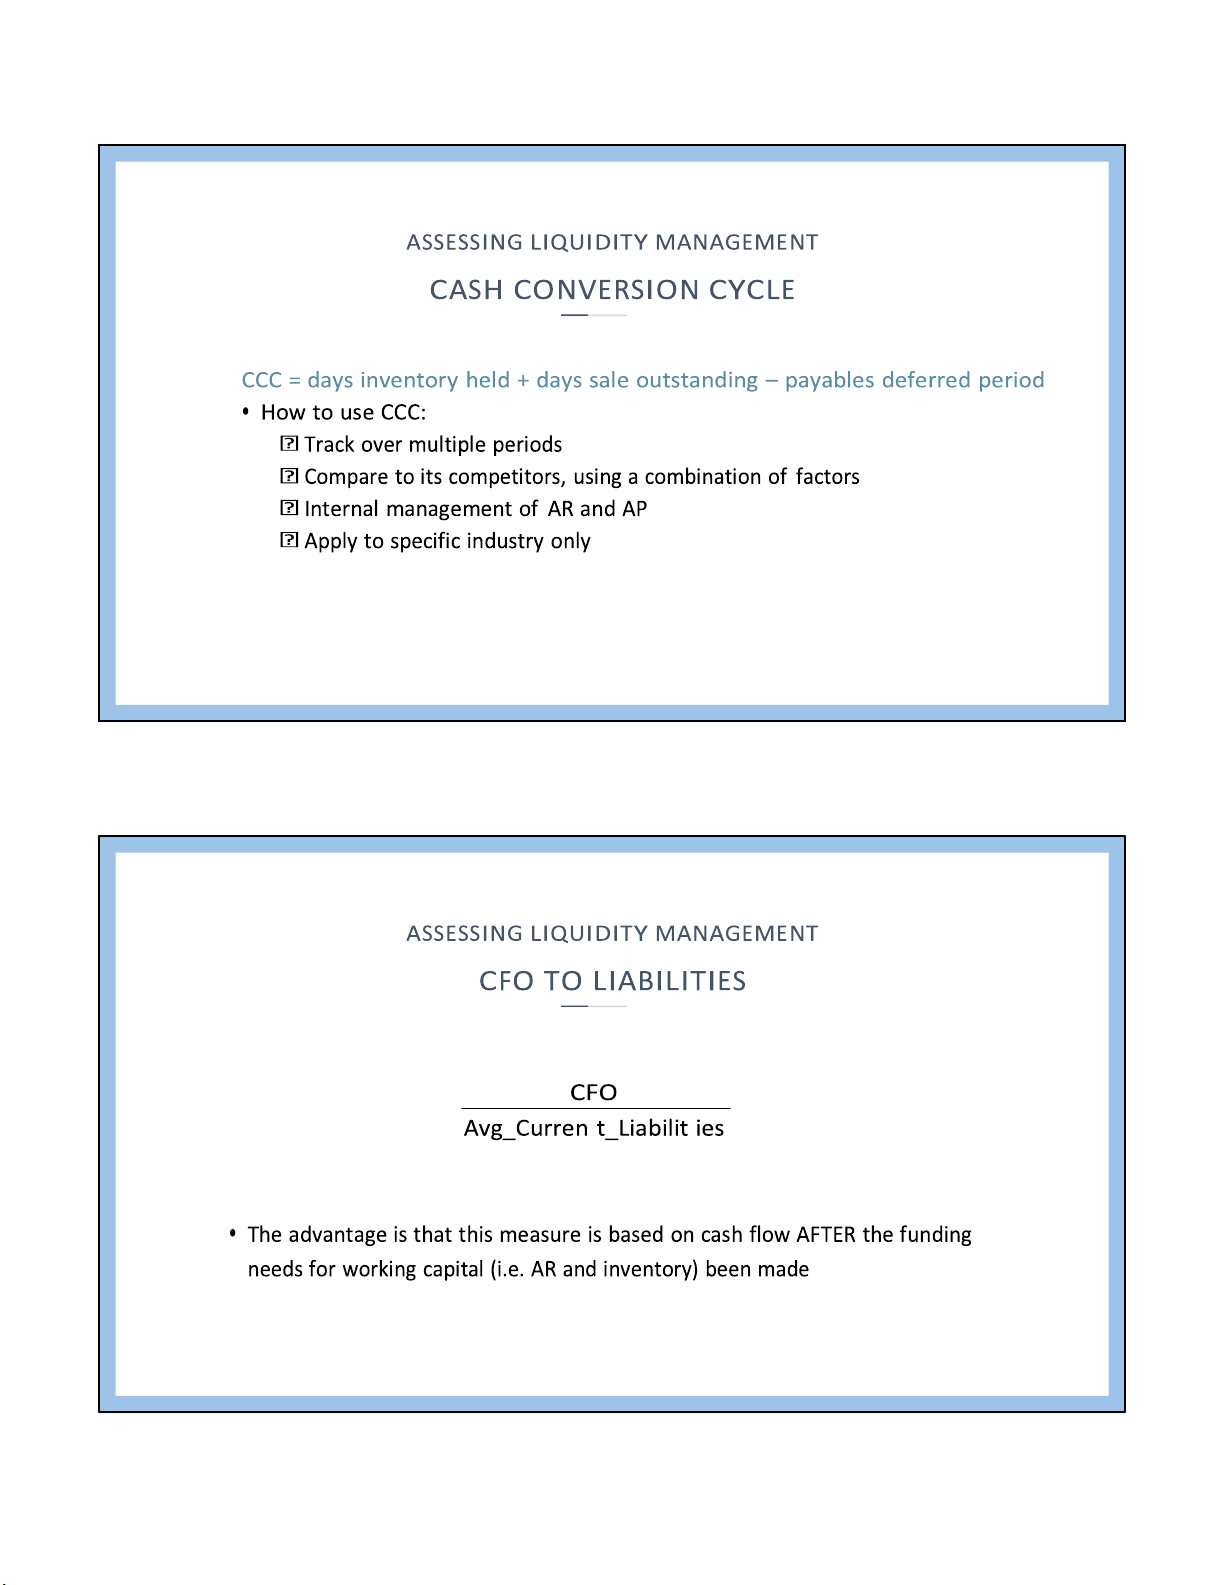
*Tangible fixed assets growth rate 9% 2.93% 363% 17% 9 lOMoARcPSD|364 906 32 9/27/2022 S S E S S E S Debt ratio, Leverage (capital structure) 10 lOMoARcPSD|364 906 32 9/27/2022 ST_D LT-D (exclude
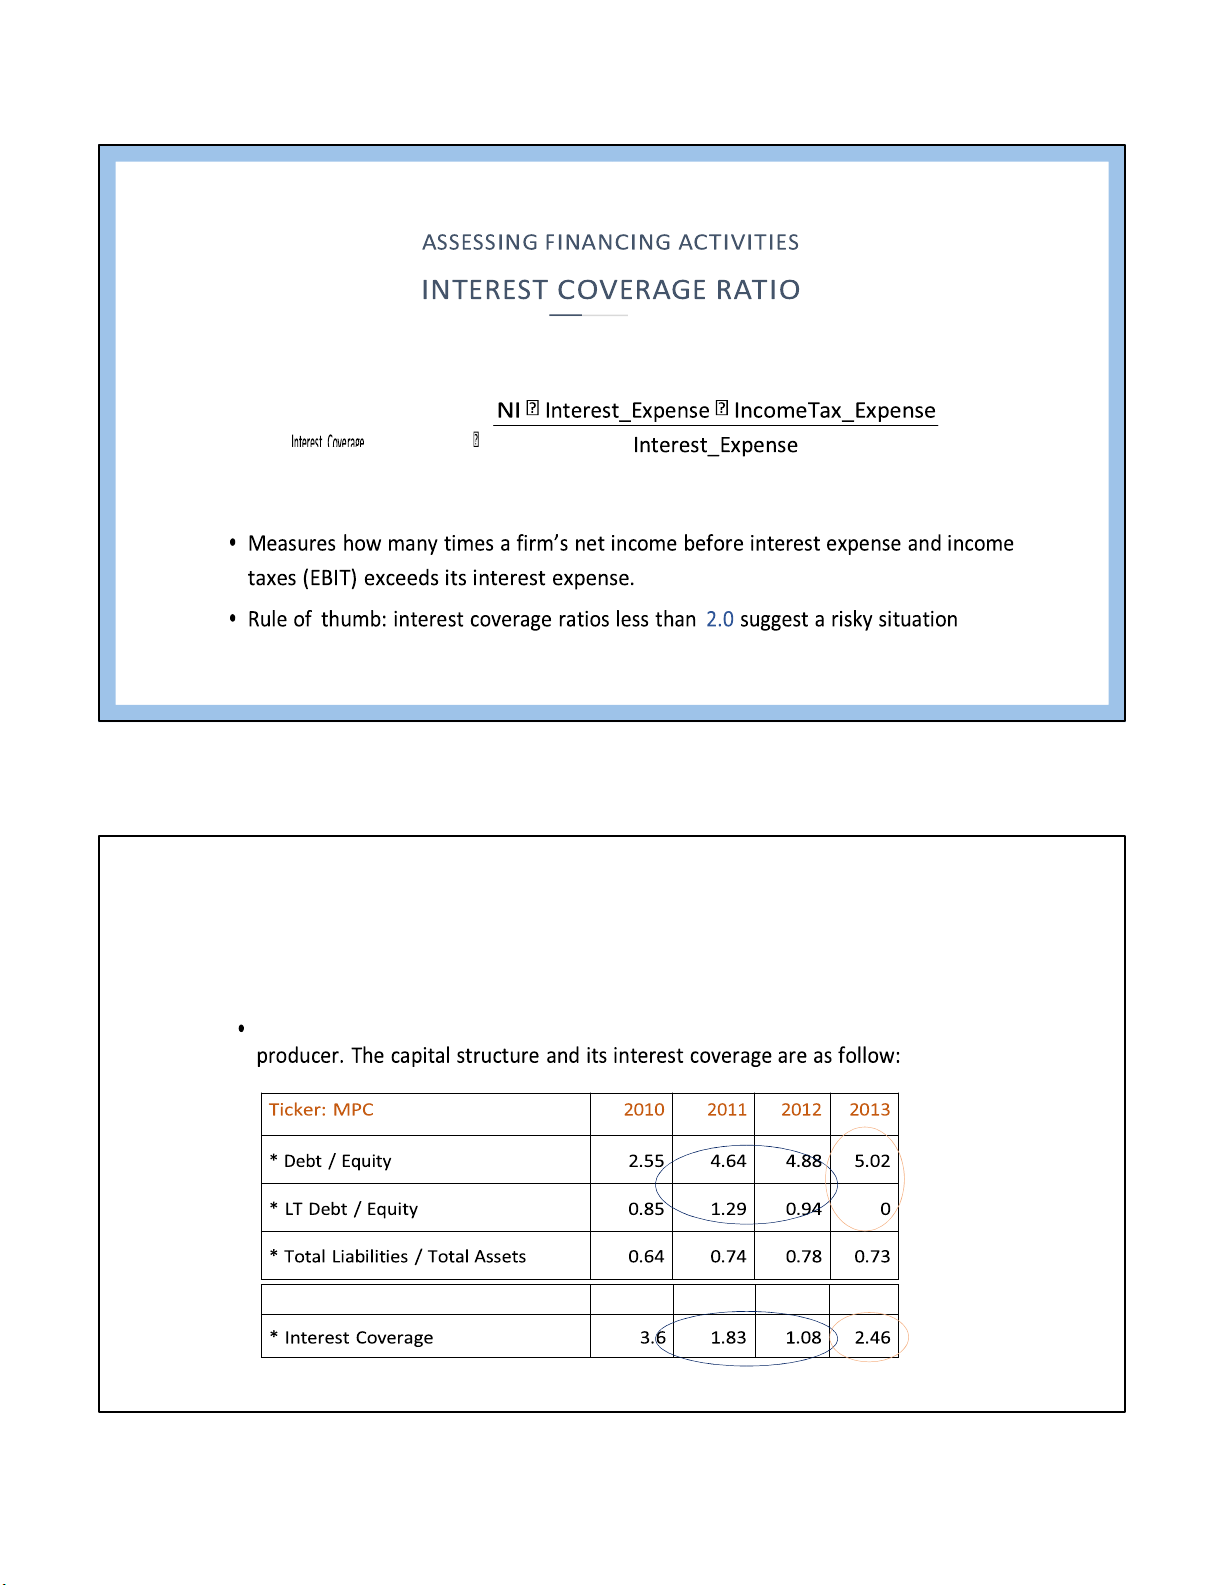
ASSESSING FINANCING ACTIVITIES non-interest-bearing debt) DEBT RATIO Debt_ratio int_bearing_Debt
int_bearing_Debt Shareholders'Equity int_bearing_Debt Debt/Equity_ratio Shareholders'Equity total_liabilities Liabilities/Assets_ratio total_assets 11 lOMoARcPSD|364 906 32 9/27/2022
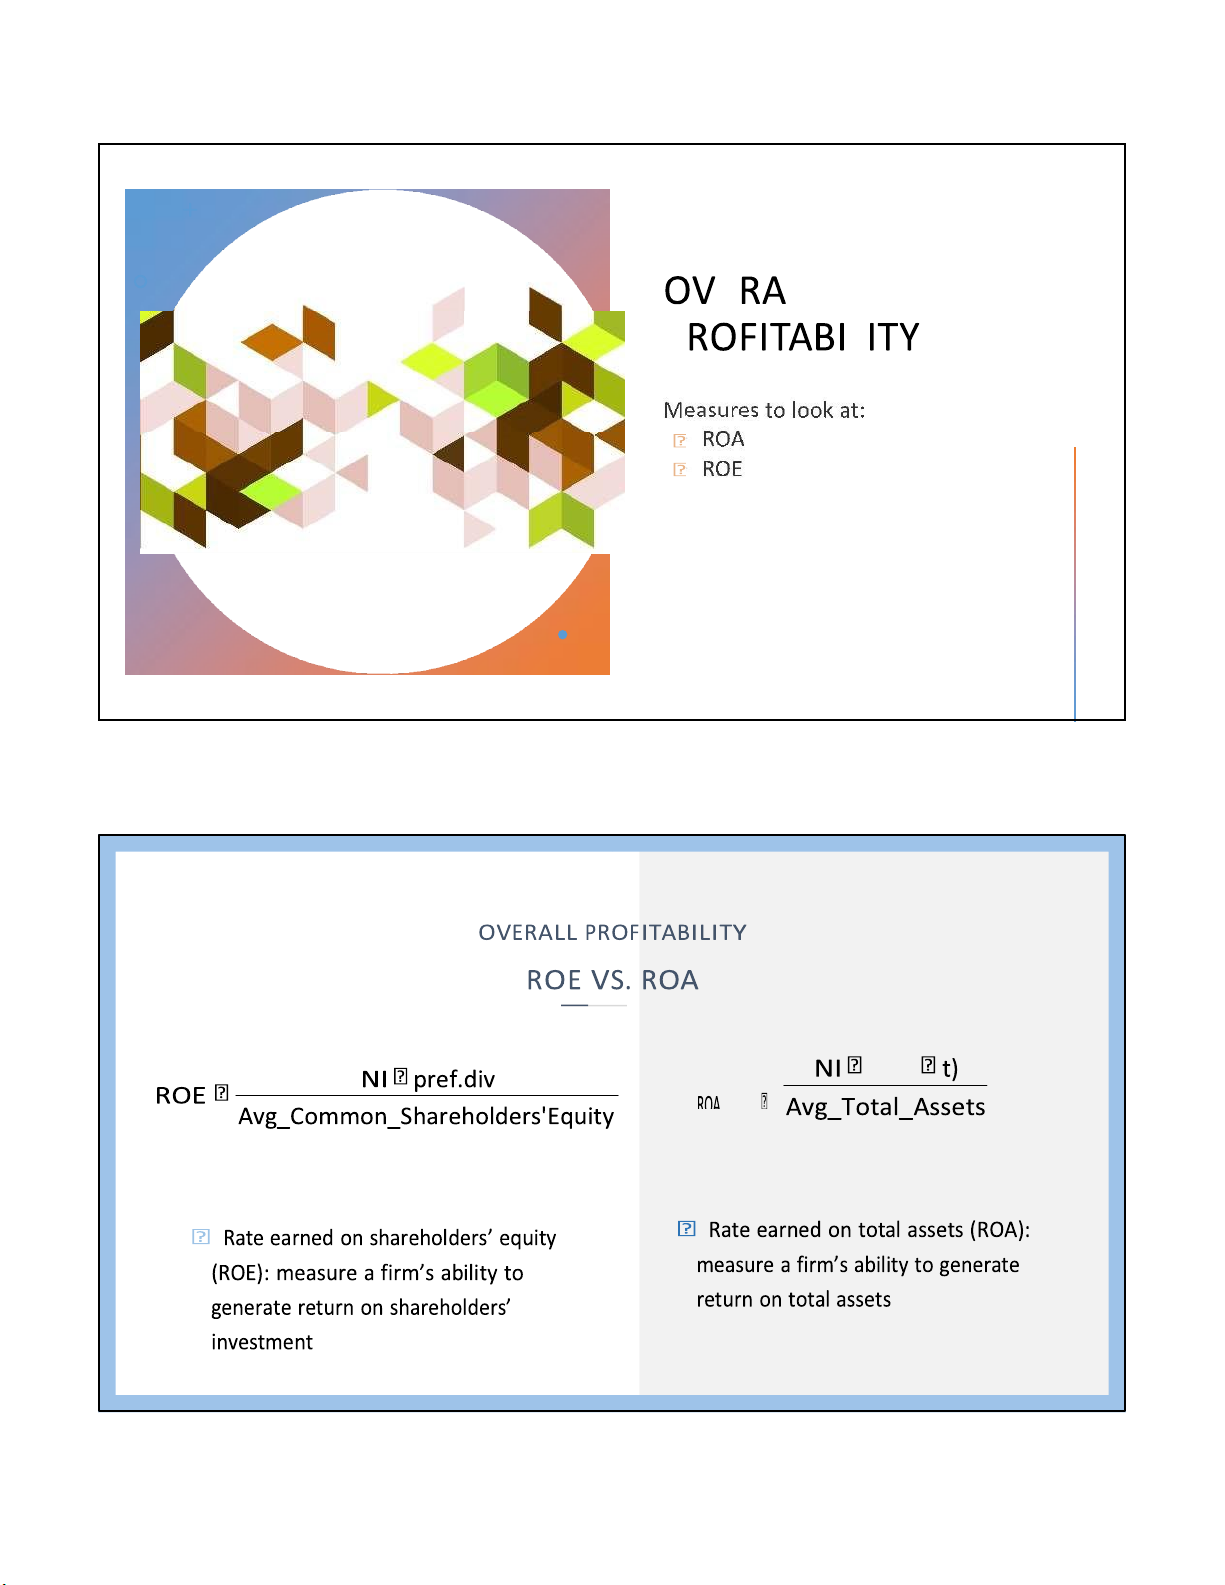
E.g. Minh Phu Seafood Corp. (HOSE: MPC) is a Vietnamese shrimp 12 lOMoARcPSD|364 906 32 9/27/2022 E L L P L int(1 13 lOMoARcPSD|364 906 32 9/27/2022 ROE > ROA when ROA exceeds the cost of debt 14 lOMoARcPSD|364 906 32 9/27/2022 Using of DUPONT IDENTITY
Table. The DUPONT breakdown for Vietnam Airline (HVN) and Vietjet Air (VJC) ROE = Profit margin Asset turnover Equity Multiplier HVN 2016 0.1296 0.0300 0.7265 5.9392 2017 0.1525 0.0321 0.9368 5.0795 2018 0.1392 0.0268 1.1750 4.4124 2019 0.1364 0.0258 1.2848 4.1088 ROE = Profit margin Asset turnover Equity Multiplier VJC 2016 0.5272 0.0908 1.3707 4.2380 2017 0.4789 0.1199 1.3362 2.9883 2018 0.3800 0.0996 1.3707 2.7842 2019 0.2555 0.0752 1.0357 3.2785 15 lOMoARcPSD|364 906 32 9/27/2022
• E.g. Saigon General Service Corp. (HOSE: SVC) is a retail trading company in
automobile and real estate. What strategy do you expect SVC to follow? 2009 2010 2011 2012 2013 * ROE 14% 12% 11% 6% 8% * Net margin 3.2% 2.1% 1.3% 0.8% 0.9% * Asset T/O 1.72 1.77 2.26 1.99 2.35 * Leverage 2.54 3.22 3.68 3.7 3.78 16 lOMoARcPSD|364 906 32 9/27/2022 S S E S S L U 17 lOMoARcPSD|364 906 32 9/27/2022 Current_Assets
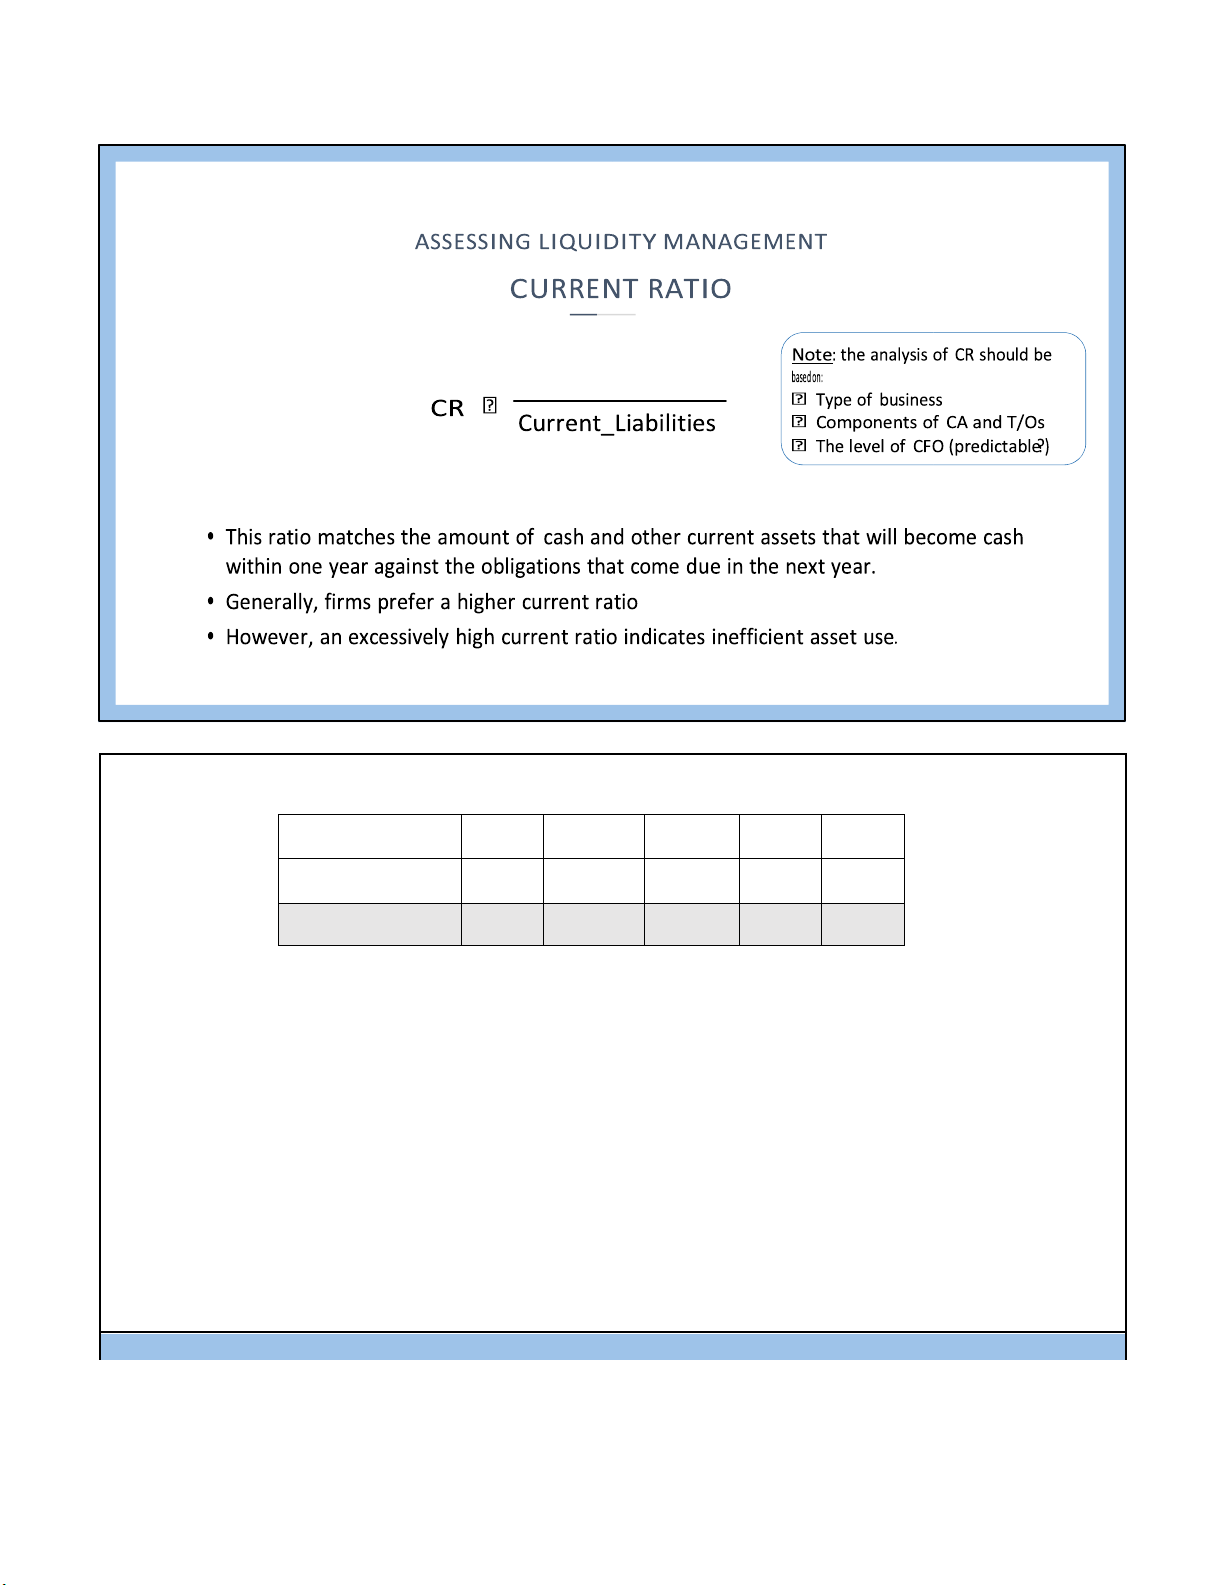
• E.g. Pomina Steel (HOSE: POM), a Vietnamese steel-maker. The current ratio of the company
are as follow. What can you say about the liquidity of the company? 2018 2019 2020 2021 * Current ratio 1.05 1.01 0.94 0.93 * Quick ratio 0.49 0.39 0.39 0.27 18 lOMoARcPSD|364 906 32 9/27/2022
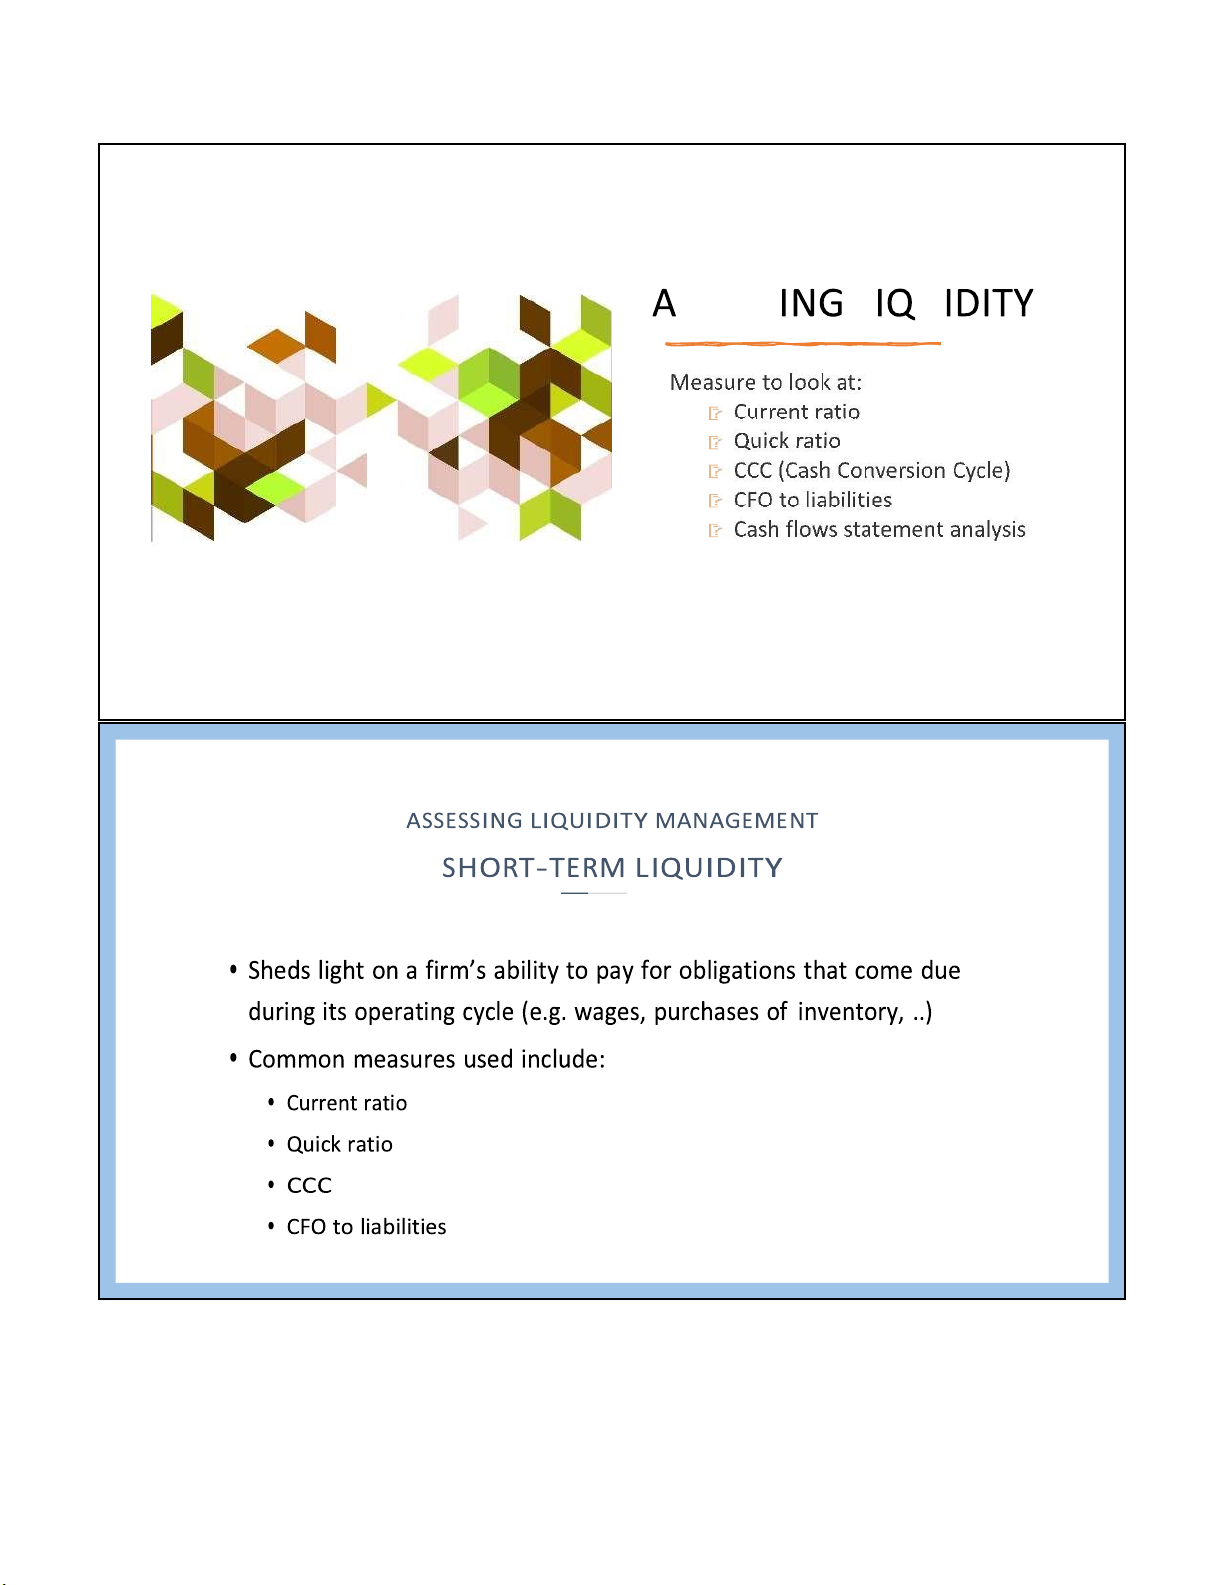
ASSESSING LIQUIDITY MANAGEMENT QUICK RATIO factoring
QR cash MktSecurities AR CA Inv cash AR Current_Liabilties CL CL
• A variation of the current ratio is quick ratio (or Acid-test ratio)
• Include in the numerator only those current assets that the firm could convert quickly into cash • Rule of thumb 0.6 – 0.8 19 lOMoARcPSD|364 906 32 9/27/2022
• E.g. Minh Phu Seafood Corp. (HOSE: MPC) is a Vietnamese shrimp producer. The
current and quick ratio of the company are as follow.
• What can you say about the liquidity of the company?
(Note: in the previous slide we already saw a low inventory T/C) 2009 2010 2011 2012 2013 * Current ratio 2.04 1.56 1.2 1.08 1.05 * Quick ratio 0.76 0.81 0.52 0.53 0.6 2009 2010 2011 2012 * Inventory T/O 3.6 4.4 3.3 3 20 lOMoARcPSD|364 906 32 9/27/2022
• E.g. Pomina Steel (HOSE: POM), a Vietnamese steel-maker. The current ratio of the
company are as follow. What can you say about the liquidity of the company? 2018 2019 2020 2021 * Current ratio 1.05 1.01 0.94 0.93 * Quick ratio 0.49 0.39 0.39 0.27 * Inventory T/O 5.75 4.13 3.69 4.00 21 lOMoARcPSD|364 906 32 9/27/2022 52 inventory sold 15 Days inventory held Days sales outstanding Days payables outstanding 40 27 d
© Cambridge Business Publishers, 2018 36 22 lOMoARcPSD|364 906 32 9/27/2022 23 lOMoARcPSD|364 906 32 9/27/2022 S L W S E M E L S S 24 lOMoARcPSD|364 906 32 9/27/2022 25 lOMoARcPSD|364 906 32 9/27/2022 • E.g. ROS 2017 - 2020
• What does it tell us about “cash-burn” & “operational”?
FLC Faros Construction JSC (Ticker: R OS)
Consolidated Statement of Cash Flows (in thousands) 2020 2019 2018 2017 Purchase of fixed assets (153,852) (1,130,846) (1,256,211) (1,281,305)
Purchase of marketable securities (4,721) (1,210,483) (2,903,862) (1,236,827)
Sales and maturity of marketable securities 51,439 910,826 2,370,681 1,644,867
Investments / Di-investment in affiliates 233,400 707,267 1,404,000 (1,634,383)
Interest from investment in securities 41,914 113,315 182,065 813,048
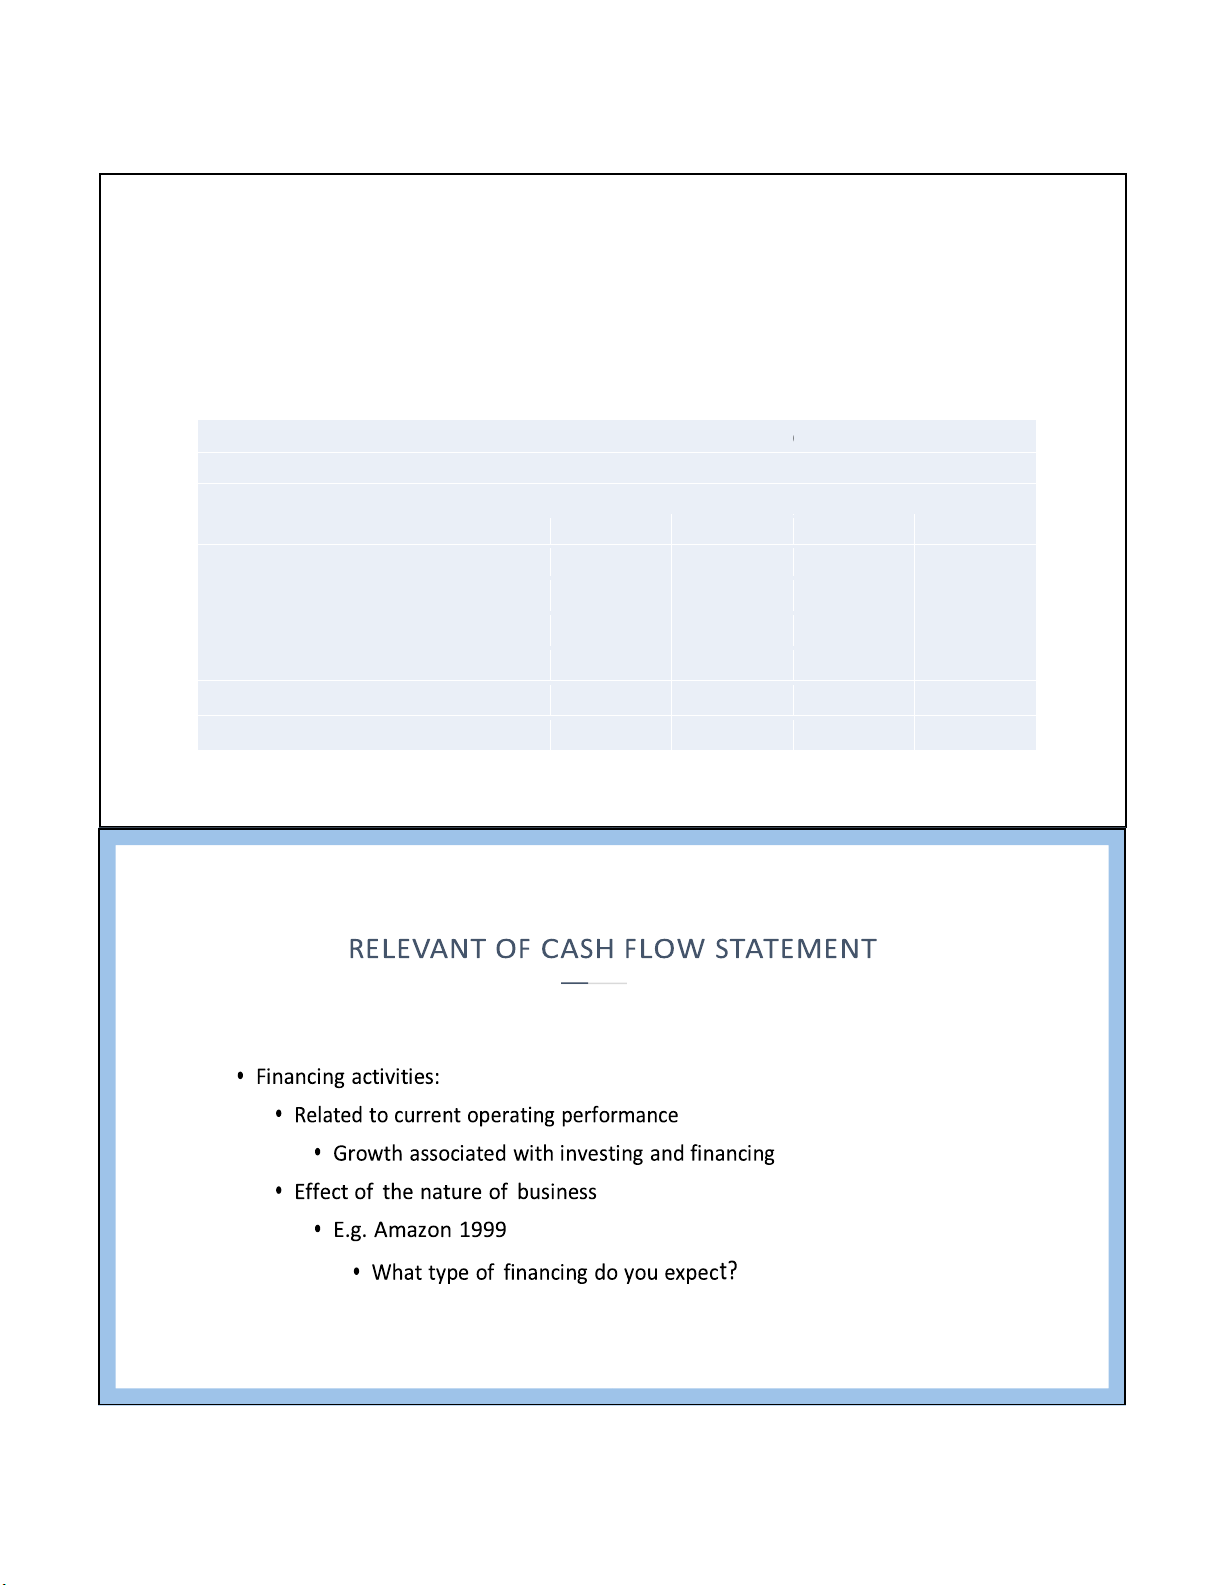
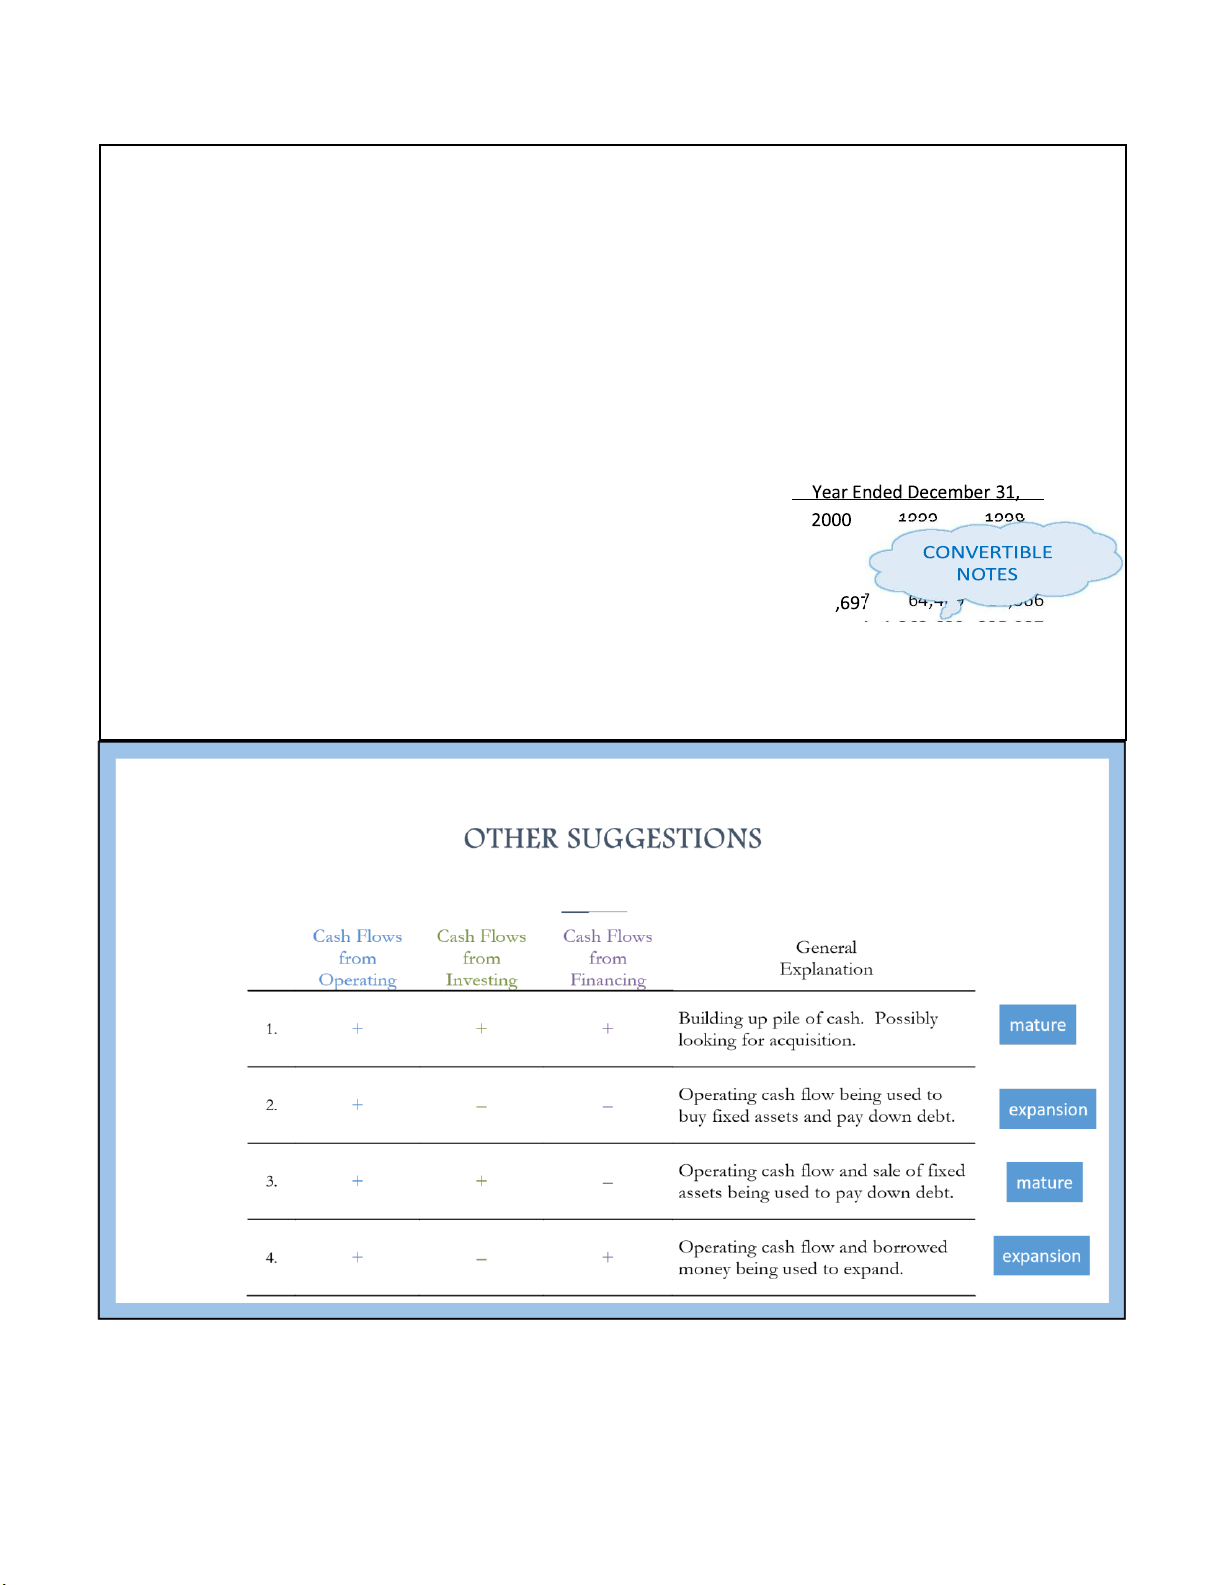
Net cash flows from investing activities 168,180 (609,921) (203,327) (1,694,600) 26 lOMoARcPSD|364 906 32 9/27/2022 • E.g. Amazon 1999
• What type of financing do you expect? • Is this debt financing? AMAZON.COM, INC.
CONSOLIDATED STATEMENTS OF CASHFLOWS (in thousands) FINANCING ACTIVITIES:
Proceeds from exercise stock options 44 64 14
Proceeds from long-term debt681,499 1,263,639 325,987 Repayment of long-term debt (16,927) (188,886) (78,108) Financing costs (16,122) (35,151) (7,783)
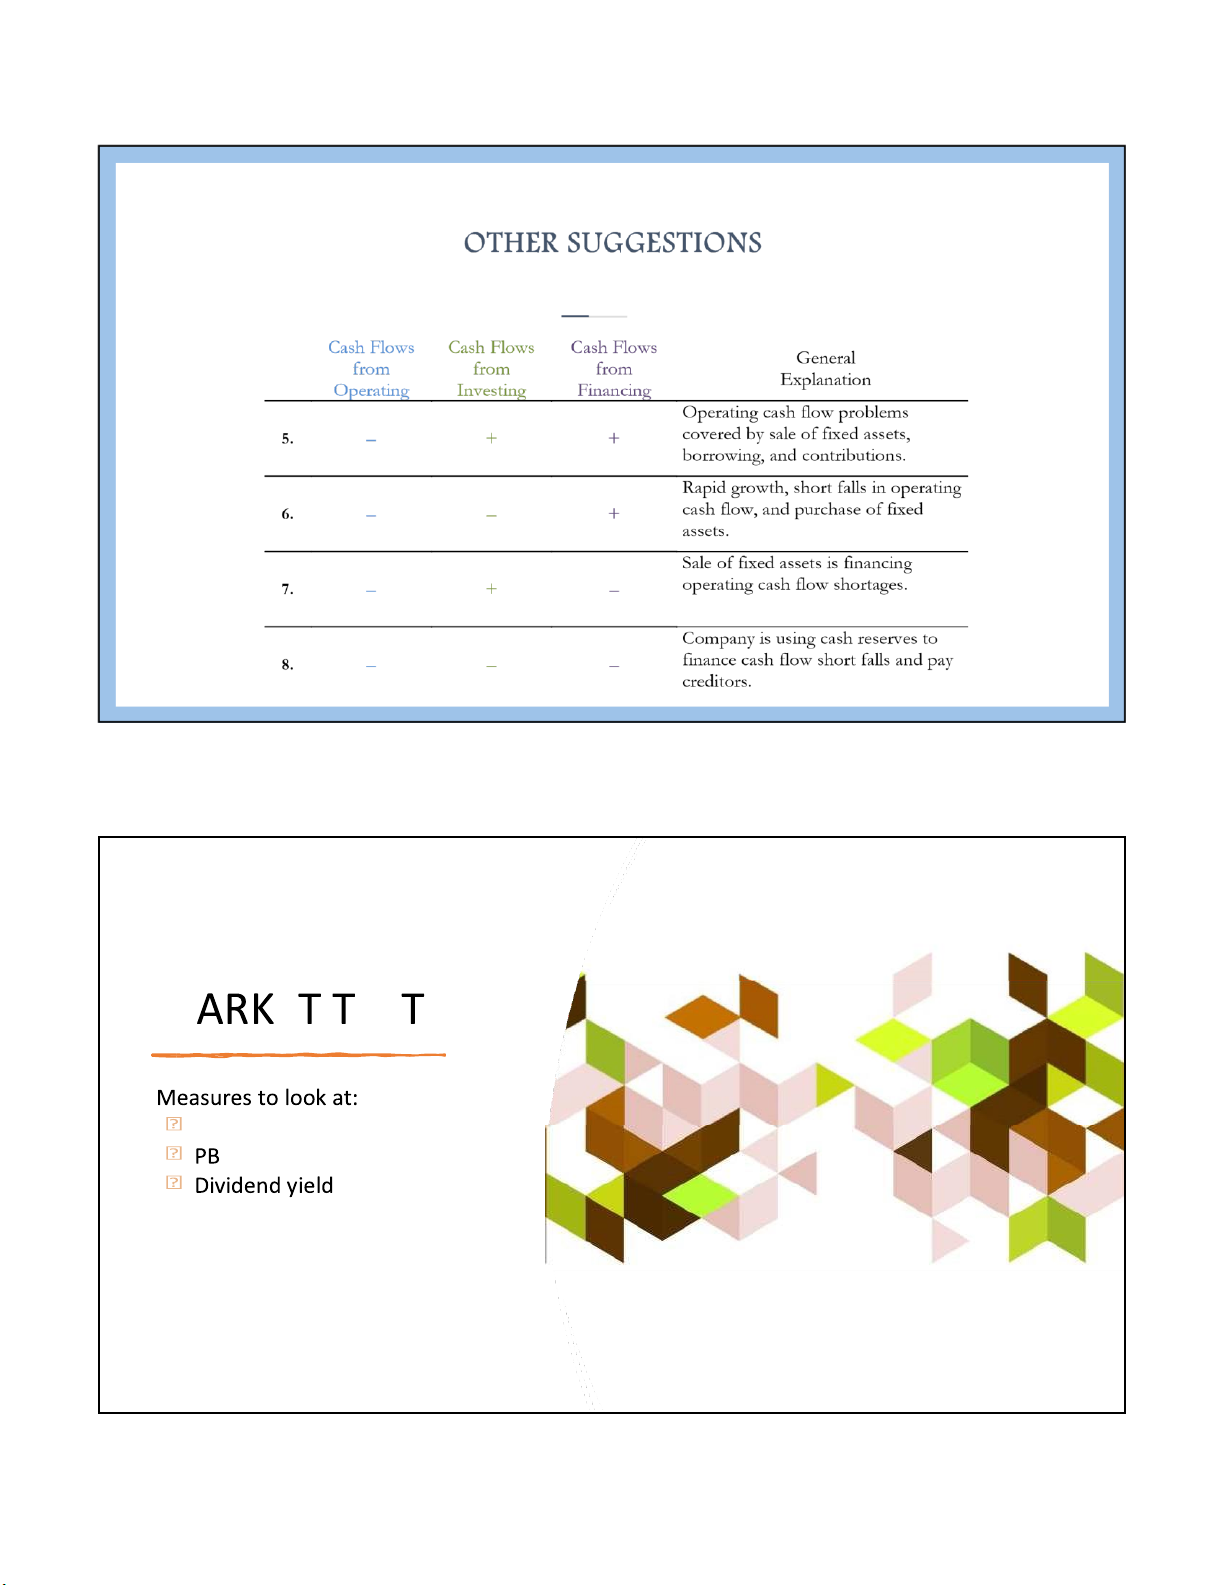
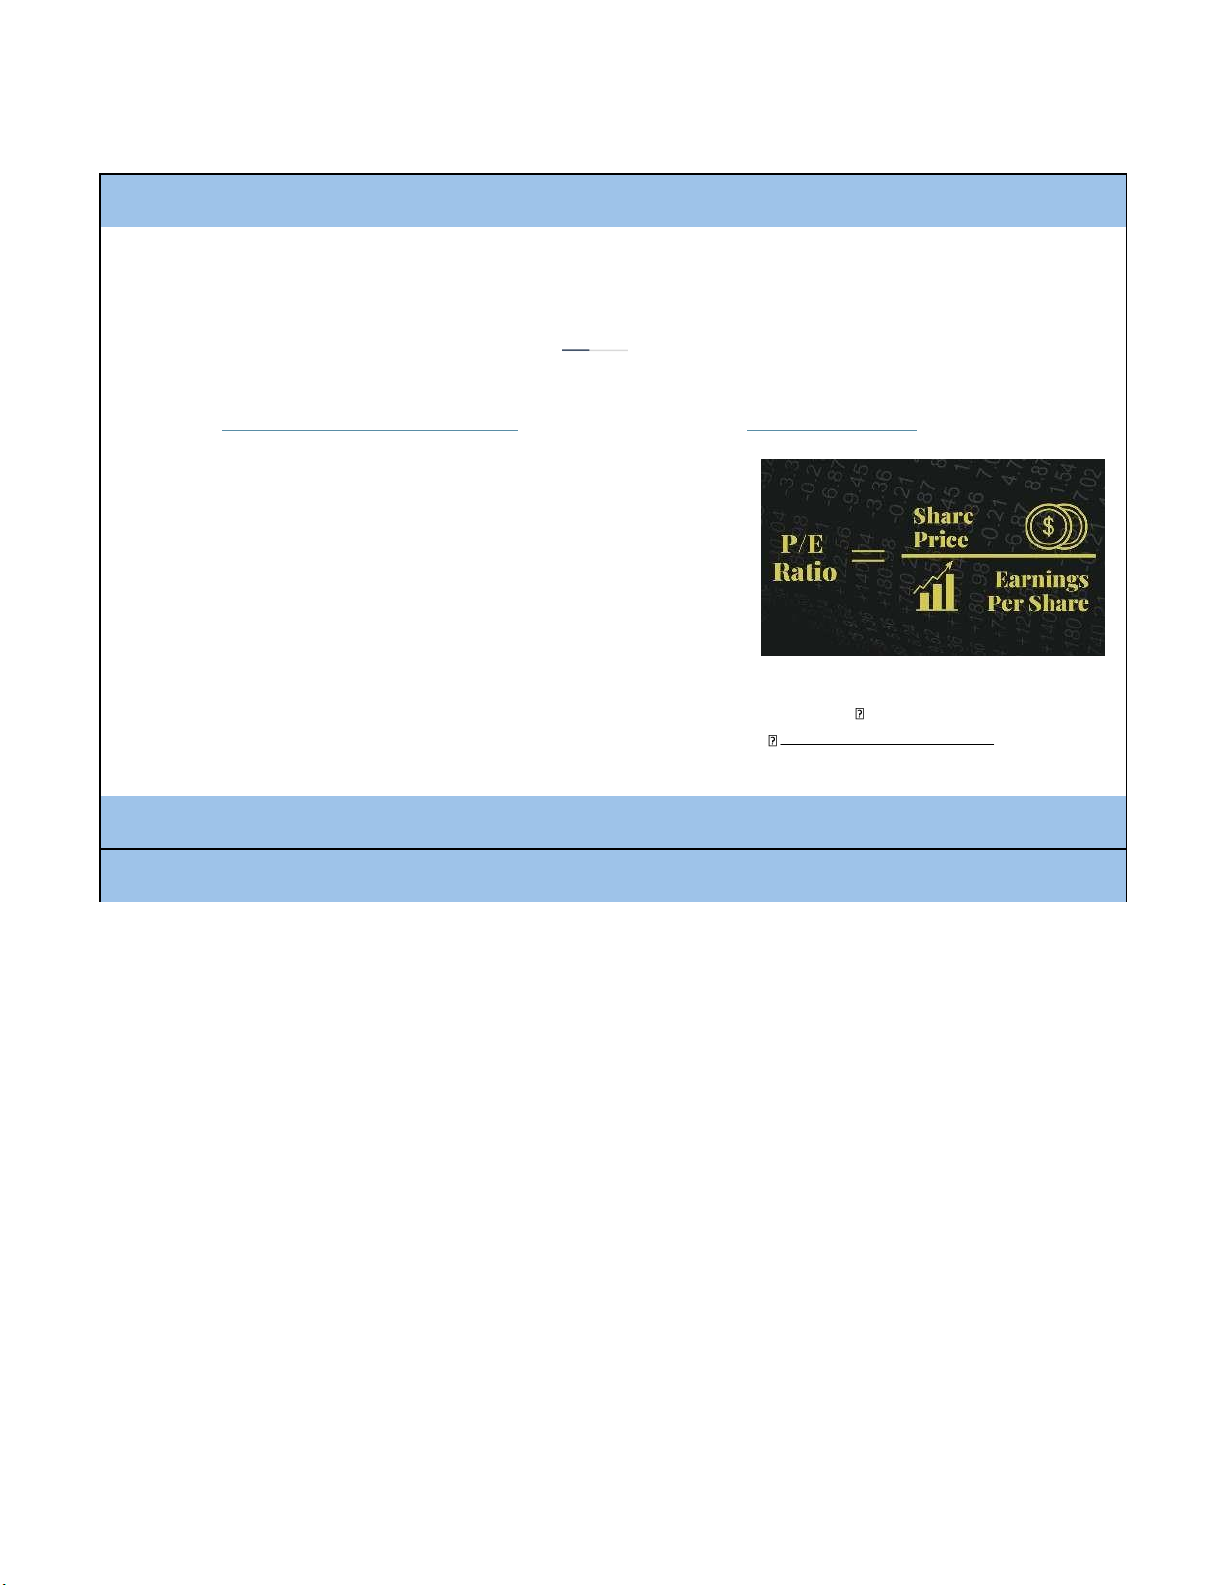
Net cash provided by financing activities 693,147 1,104,071 254,462 27 lOMoARcPSD|364 906 32 9/27/2022 M E E S S PE 28 lOMoARcPSD|364 906 32 9/27/2022 RATIOS for STOCK PICKING PRICE-TO-EARNINGS (PE) ratio: How it is derived:
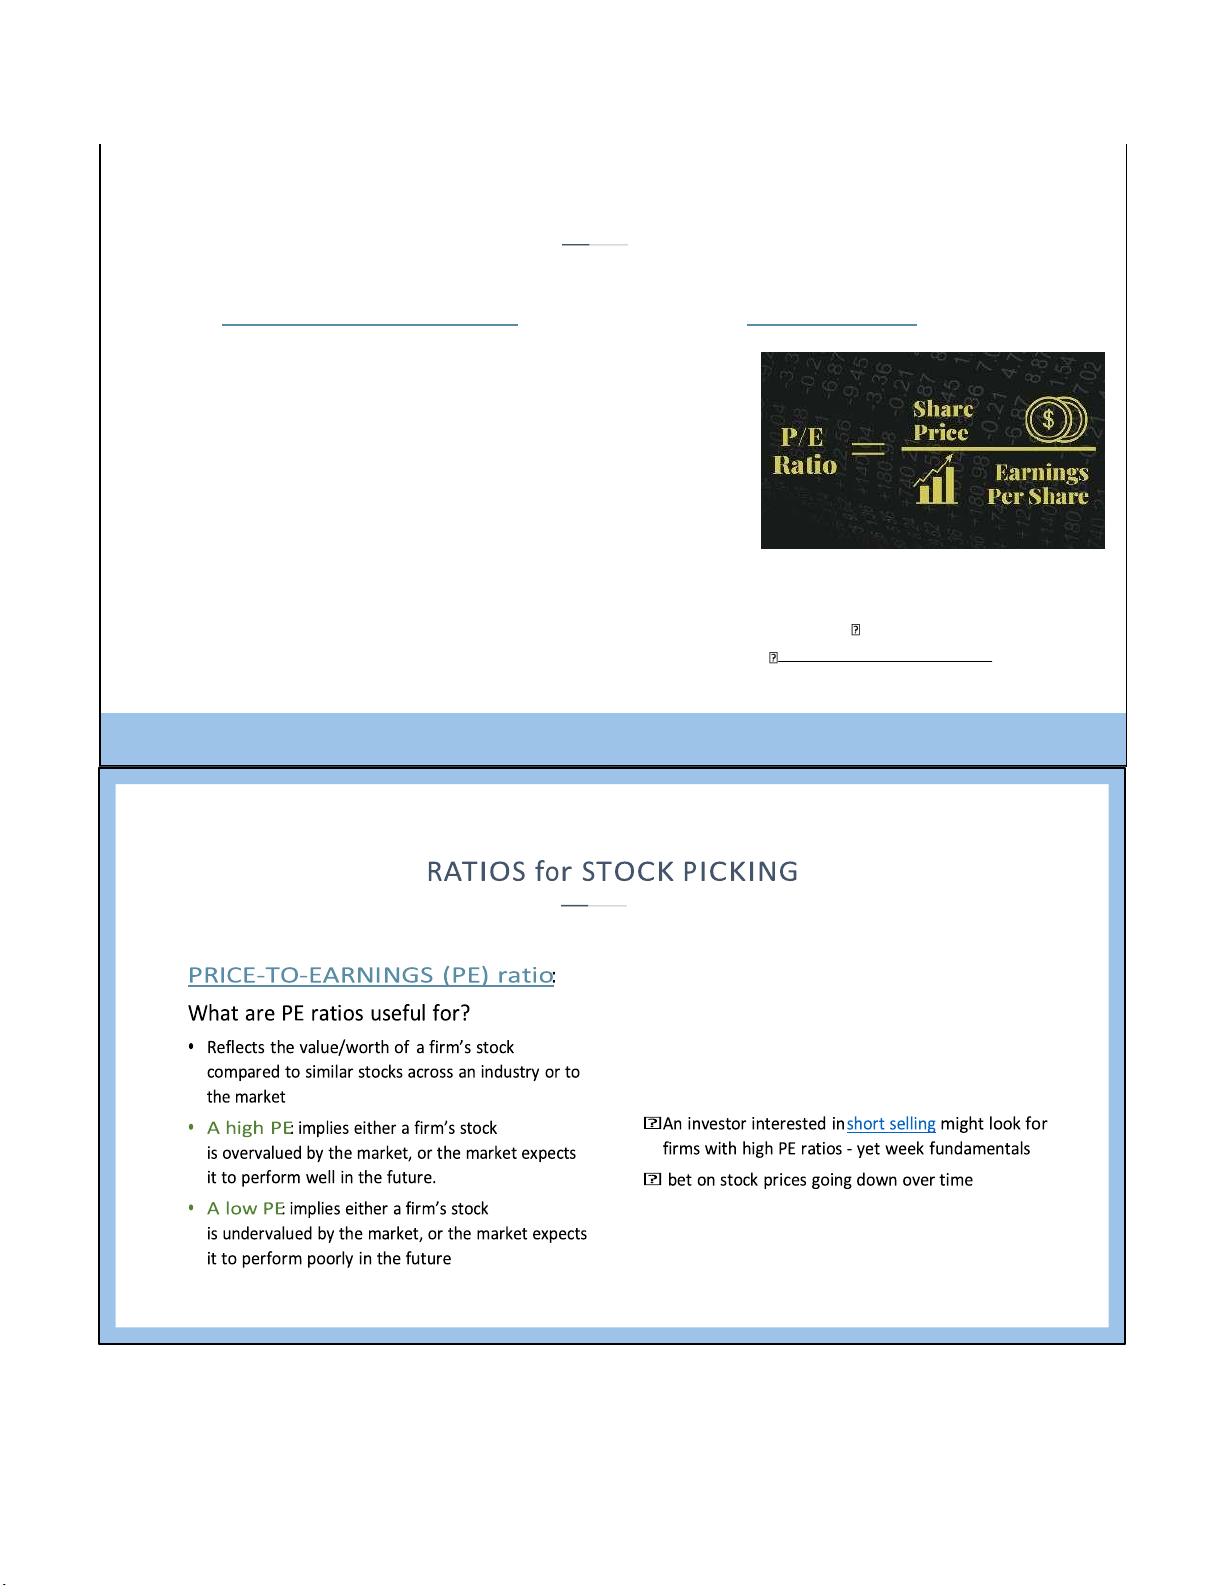
• Compare the stock price to the firm’s EPS
• The EPS can be either for the past 12 months
(historical or trailing PE) or the coming 12
months (forward or leading PE)
• Is usually expressed in terms of x, which simply means “times.”
• For instance, a P/E ratio of 5x means that a firm’s stock
price is five times its annual EPS NI DIV_Pref. shares where: EPS # outstandin g_common shares 29 lOMoARcPSD|364 906 32 9/27/2022 RATIOS for STOCK PICKING PRICE-TO-EARNINGS (PE) ratio: How it is derived:
What are PE ratios useful for?
• Reflects the value/worth of a firm’s stock
compared to similar stocks across an industry or to the market
• A high PE: implies either a firm’s stock is
overvalued by the market, or the market
expects it to perform well in the future.
• A low PE: implies either a firm’s stock is
undervalued by the market, or the market expects
it to perform poorly in the future NI DIV_Pref. shares where: EPS # outstandin g_common shares 30 lOMoARcPSD|364 906 32 9/27/2022 firm’s book value (BVE) 31
Tài liệu liên quan:
-
Emerging from Turbulence - Analysis & Recommendations (2023) | Môn Business Analysis and Valuation - Trường Đại học Quốc tế, Đại học Quốc gia Thành phố Hồ Chí Minh
104 52 -
Economic & Demographic Changes: Impact of Globalization & Policy | Môn Business Analysis and Valuation - Trường Đại học Quốc tế, Đại học Quốc gia Thành phố Hồ Chí Minh
94 47 -
Lecture 2: Strategic Analysis on Market Structure & Competition (2024) | Môn Business Analysis and Valuation - Trường Đại học Quốc tế, Đại học Quốc gia Thành phố Hồ Chí Minh
99 50 -

Lecture 1: Introduction to Business Valuation (2024-2025) | Môn Business Analysis and Valuation - Trường Đại học Quốc tế, Đại học Quốc gia Thành phố Hồ Chí Minh
94 47 -

Lecture 4: Module 2 Financial Ratios & Market Tests Analysis (2023-2024) | Môn Business Analysis and Valuation - Trường Đại học Quốc tế, Đại học Quốc gia Thành phố Hồ Chí Minh
97 49