Nghiên cứu hiệu suất nhà máy điện nhiệt mặt trời | Môn Kinh tế năng lượng - Đại học Sư phạm Kỹ thuật Thành phố Hồ Chí Minh
Solar thermal power plants are not an innovation of the last few years. In 1878 when a small solar power plant made up of a parabolic dish concentrator connected to an engine was exhibited at the World's Fair in Paris. Tài liệu được sưu tầm gồm 5 trang, giúp bạn ôn tập tốt hơn. Mời các bạn đón xem.
Môn: Kinh tế năng lượng (ENEC320832) 13 tài liệu
Trường: Trường Đại học Sư phạm Kỹ thuật Thành phố Hồ Chí Minh 4.4 K tài liệu
Tác giả:


Preview text:
lOMoAR cPSD| 58707906
SOLAR THERMAL POWER PLANTS 1. Introduction.
Solar thermal power plants are not an innovation of the last few years. In 1878 when
a small solar power plant made up of a parabolic dish concentrator connected to an
engine was exhibited at the World's Fair in Paris. In 1913, the first parabolic trough solar
thermal power plant has been implemented in Egypt. After the energy crisis of 1970s,
nine parabolic trough power plants were installed during 1984–1991
Over the last twenty years, R&D efforts on solar thermal power plants have been growing
sharply particularly in the US, Spain, Germany, China, South Africa and Australia. As a
result significant solar power plants have been installed. The solar heat from the parabolic
trough solar field could be integrated into three power conversion cycles, i.e., Rankine
cycle, Brayton cycle or combined cycle.
The integration of parabolic trough technology into the Rankine cycle has been the first
applied technique since the 1980s in California. Compared with Rankine-based cycles,
the idea of integrating solar energy into the Brayton cycle (gas turbine) is very recent. In
this system, steam is injected directly into the combustion chamber or the gas flow of the
gas turbine to enhance efficiency and output power. A configuration of the solar parabolic
trough combined with a gas turbine (CC-GT) uses turbine exhaust gases to supplement
the thermal energy storage system.
The present study aimed at a detailed review and performance analysis of the integration
of solar heat from parabolic trough field into power conversion cycles including Brayton
cycle, Rankine cycle and combined cycle. After that, evaluate performance of fifteen
solar only, fossil only and hybrid solar-fossil power plants.
2. Modeling the components.
2.1 Solar Radiation Modeling
This section focuses on modeling solar radiation to assess the amount of energy that can
be captured. The ASHREA model is chosen for its high accuracy when measurement
stations are unavailable. The formula for calculating Direct Normal Irradiance (DNI) in the ASHREA model is: −Bash p DNIash=Aashexp(
cos (❑z) p0) lOMoAR cPSD| 58707906
where Aash ,Bash ,Cash are climate constants for each area. It helps determine the amount of
solar energy that can be collected, which is a crucial factor for the efficiency of a solar
thermal power plant. It’s applied to illustrate the method of modeling solar radiation under real-world conditions.
2.2 Parabolic Trough Solar Field Modeling
The solar field consists of parabolic trough collectors, piping, and HTF pumps. Key aspects include: •
2.2.1 Collector Model: The parabolic trough collector model determines solar
energy absorption, heat loss, and heat gain. The “H” field design optimizes
efficiency by minimizing pressure loss. •
2.2.2 Pressure Loss: The pressure loss in the piping system is calculated as follows: △P = p . g. h
This formula is applied to determine the pump power needed for HTF within the system.
The pipe length, type of fittings, and details of the collector loop significantly impact
pressure loss and overall system efficiency.
Figure 1: Pipes length and fittings used in the H – solar field design
A table listing the pipe lengths, necessary fittings, and typical design for the piping
system. The piping system is where pressure loss occurs, impacting heat transfer
efficiency in the solar field. Including this table in the description of the solar field design
helps clarify the structure and factors affecting the system. lOMoAR cPSD| 58707906
2.3 Gas Turbine Modeling
This section discusses the Brayton cycle model, considering environmental factors and
pressure loss through each turbine component. Important factors include: •
Isentropic Efficiency of the Compressor: Compressor efficiency is calculated
based on inlet and outlet pressure ratios, average temperature, and polytropic efficiency. •
Actual Turbine Power Output: The formula for calculating the actual power
output of the gas turbine is: W ¿=WT−WC
W : Power generated at the turbine T
W : Power consumption at the compressor C
This formula allows evaluating the efficiency of the gas turbine when combined with
solar heat, helping to determine the effectiveness of converting solar heat into electricity.
2.4 Regenerative Rankine Cycle Modeling
The regenerative Rankine cycle uses heat from the HRSG (Heat Recovery Steam
Generator) to improve efficiency, including:
Heat Exchange Steps in HRSG: The amount of heat gained in the economizer is
calculated as: QwaterECO=mwater((1+BDF ) (Hwater5−Hwater4 )) QwaterECO: the heat gained in the economizer.
mwater: the mass of water
Hwater 5, Hwater 4: the enthalpy (internal heat) of the water at the point exit from the economizer
BDF: Blow down Factor. "This coefficient typically has a small value (e.g., 0.01 - 0.02)
and is calculated to ensure that the water in the system has good quality, preventing issues
such as scaling or corrosion of the pipes.
(1+BDF) reflects that the total mass flow rate of water includes not only the heated water
but also the water being drained. Therefore, multiplying by (1+BDF) helps accurately
calculate the amount of heat needed to heat both the circulating water and the drained water in the system." lOMoAR cPSD| 58707906
This part describes the heat exchange process within the HRSG, where steam is heated
from a saturated to a superheated state and then reheated between the high and lowpressure turbines.
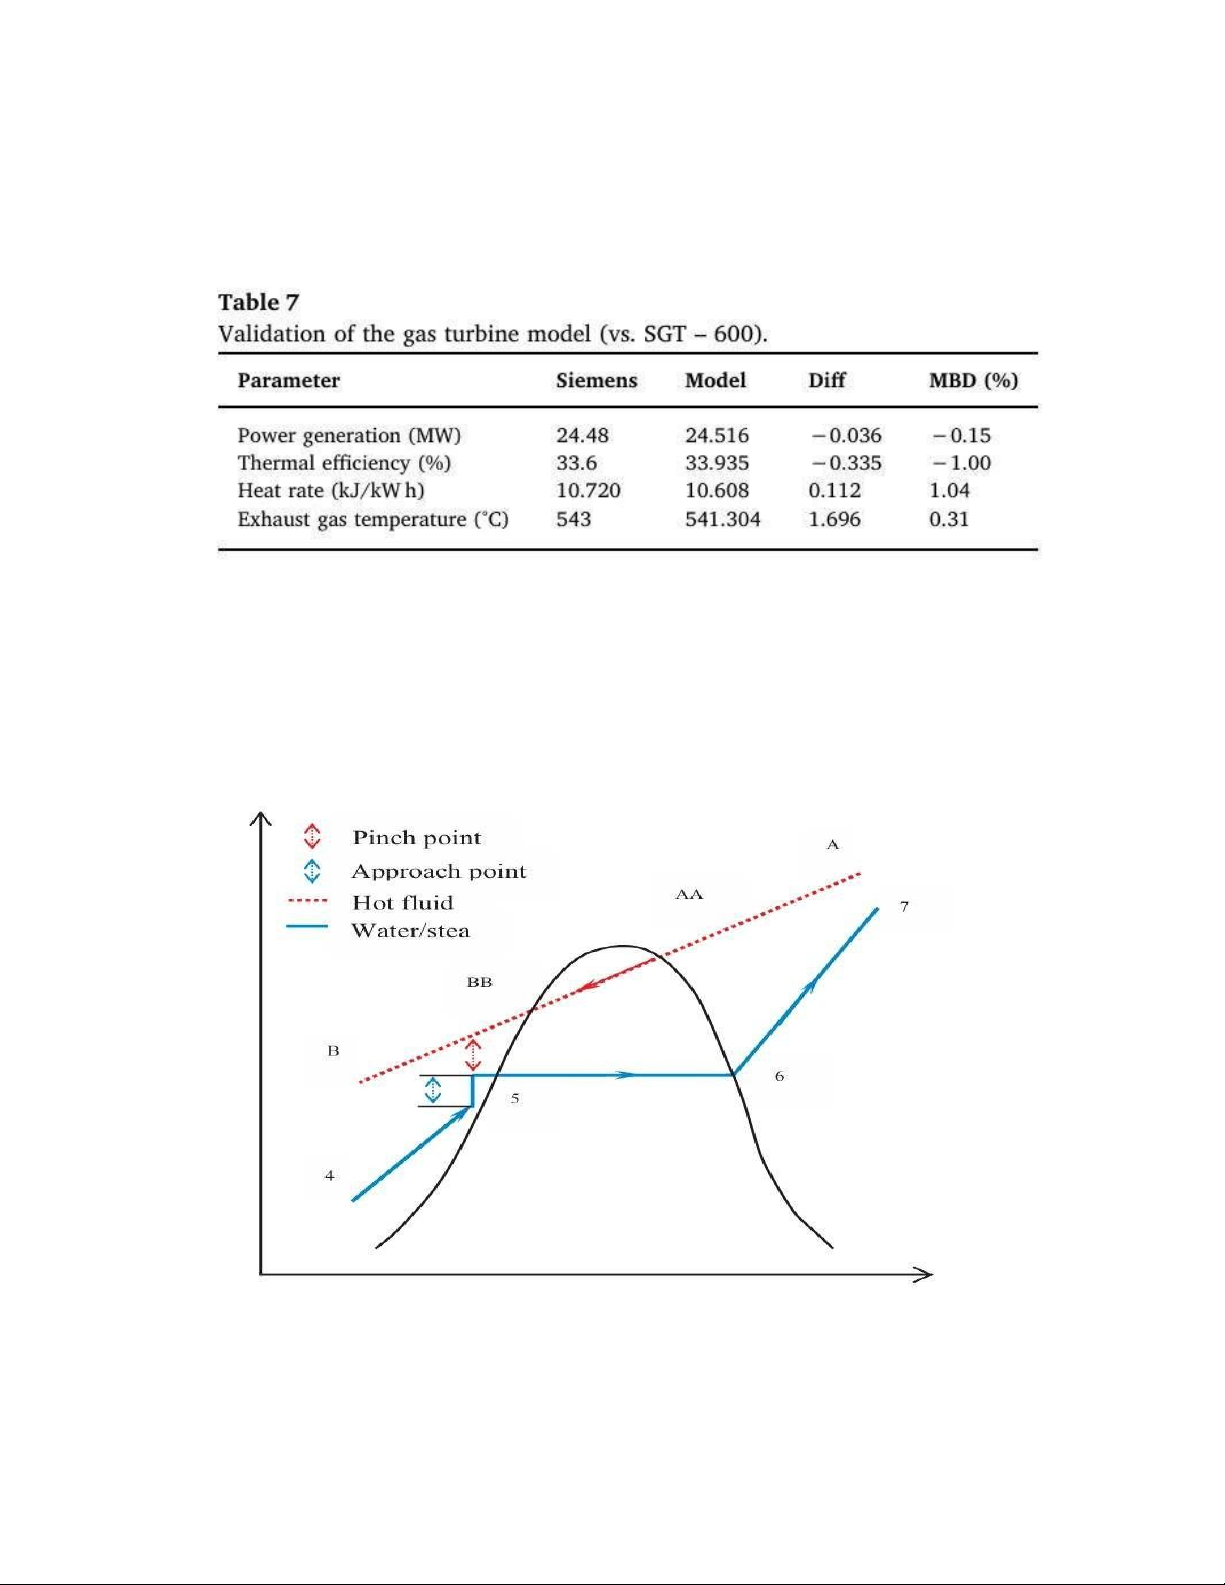
Figure 2: Validation of the gas turbine model
The table shows minor deviations between the model and actual values, indicating a good
fit between the model and real-world data, with a mean bias difference (MBD) of less
than 1.04% across parameters. This demonstrates the reliability of the gas turbine
simulation in the context of hybrid configurations with solar energy. lOMoAR cPSD| 58707906
Figure 3: Heat Transfer in the HRSG
This diagram represents a temperature-entropy (T-s diagram) or temperature-heat
diagram in the system of a solar thermal power plant. It illustrates key points and lines in
the heat exchange process between the hot fluid and water (or steam) for power generation. Specifically:
1. The red dashed line represents the hot fluid flow used to heat the water or steam
during the heat exchange process.
2. The blue line represents the water/steam flow through various stages from liquid
to steam, marked by points 4 to 7:
o Point 4 to 5: The initial heating process of water.
o Point 5: Reaches the approach point, where the water temperature is close to the hot fluid temperature.
o Point 6: Reaches the pinch point, where the temperature gap between the
two fluids is the smallest in the heat exchange process.
o Point 7: The water/steam reaches its highest temperature after the heating process.
3. The pinch point and approach point are two important points in the heat
exchanger design of the solar thermal power plant. The pinch point indicates the
smallest temperature difference between the hot fluid and water, optimizing
thermal efficiency. The approach point represents the temperature point before the
water reaches the pinch point.
Model Validation: A comparison table between the model and IAPWS IF-97
standard data ensures accuracy in predicting thermodynamic parameters. This is
crucial for assessing the overall efficiency of the Rankine cycle when integrated with solar energy
Tài liệu liên quan:
-

Green Hydrogen Cost Reduction: Scaling up Electrolysers to Meet the 1.5°C Climate Goal | Trường Đại học Sư phạm Kỹ thuật Thành phố Hồ Chí Minh
55 28 -

Global Hydrogen Review môn Kinh tế năng lượng | Trường Đại học Sư phạm Kỹ thuật Thành phố Hồ Chí Minh
57 29 -

Subcooling methods for CO2 refrigeration cycles-a review | Môn Kinh tế năng lượng - Đại học Sư phạm Kỹ thuật Thành phố Hồ Chí Minh
96 48 -

Tóm tắt quản lý năng lượng | Môn Kinh tế năng lượng - Đại học Sư phạm Kỹ thuật Thành phố Hồ Chí Minh
138 69