Factors Influencing Consumers’ Intention to Use Cashless Payment among Public University ’S Undergraduate Students | Tài liệu nước ngoài
Factors Influencing Consumers’ Intention to Use Cashless Payment among Public University ’S Undergraduate Students | Tài liệu nước ngoài
Môn: Tài liệu Tổng hợp 3.6 K tài liệu
Trường: Tài liệu khác 3.9 K tài liệu
Tác giả:


Preview text:
Vol 14, Issue 10, (2024) E-ISSN: 2222-6990
Factors Influencing Consumers’ Intention to Use
Cashless Payment among Public University ’S Undergraduate Students
Chai Wen Jing, Mohd Amim Othman & Ahmad Hariza Hashim
Department of Resource Management and Consumer Studies, Faculty of Human Ecology, University Putra Malaysia
Corresponding Author Email: mohdamim@upm.edu.my
To Link this Article: http://dx.doi.org/10.6007/IJARBSS/v14-i10/23306 DOI:10.6007/IJARBSS/v14-i10/23306
Published Date: 20 October 2024 Abstract
The main objective of this study is to determine factors influencing consumers' intention to
use cashless payment among undergraduate students in Public University. A total of 200
undergraduate students were involved in this study selected through simple random
sampling. Questionnaires were distributed using Google Forms and the Statistical Package for
Social Science was employed to analyze the collected data. Mean was used to identify the
level of consumers' intention to use cashless payment and multiple linear regression analysis
was used to identify the predictor that influences consumers' intention to use cashless
payment. The results of this study showed that there is a high level of intention to use cashless
payment (mean score=4.319). Multiple linear regression analysis indicated that perceived
usefulness (p<0.001), trust (p<0.001) and perceived ease of use (p<0.002) is the significant
predictors for intention to use cashless payment in the future (adjusted R2=0.544). This shows
that the predictor factors ability to explain influencing intention to use cashless payment is as
high as 54.4 percent. The study's findings have increased understanding of the intention to
use cashless payment, Technology Acceptance Model (TAM) and its theoretical and practical
implications. In conclusion, perceived usefulnes, trust and perceived ease of use as predictor
variables influence consumer’ intention to use cashless payment among undergraduate
students in Public University.
Keywords: Consumer Intention, Cashless Payment, Technology Acceptance Model (TAM),
Undergraduate Students, Public University, Introduction
According to Abdullah et al (2020), the landscape of industry, especially the financial sector,
has been changed by rapidly emerging technology around the world. Besides that, people
presently choose to employ goods, including the wireless and the paperless, and even
perform financial transactions in the absence of using real cash, which is defined as cashless
payment (Ishak, 2020). Furthermore, digital developments have also led to significant changes 1915
INTERNATIONAL JOURNAL OF ACADEMIC RESEARCH IN BUSINESS AND SOCIAL SCIENCES
Vol. 1 4 , No. 10, 2024, E-ISSN: 2 2 2 2-6990 © 2024
in the business world, with cash-based payments being phased out in favour of electronic
based payments that provide a convenient, quick, secure, and cost-effective payment
mechanism (Premchand & Choudhry, 2015). Some nations, including the Netherlands,
Germany, and the Scandinavian countries, have implemented cashless payment systems far
more widely (Krüger & Seitz, 2014; Sreenu, 2020). These countries are the top nations that
are most near a cashless economy. The percentage of cash-based payments is now lower than
5% in all 10 of the nations identified as being most on the verge of going cashless. Sweden,
Denmark, the United Kingdom, and Singapore having the lowest percentages of 1%,
respectively, followed by Norway, Finland, New Zealand, and Switzerland having the
percentages of 2%, respectively, as well as Hong Kong and the Netherlands having the
percentages of 4%, respectively (Merchant Machine, 2022). The worldwide population
conducting cashless payments was 620.8 billion in 2018 (Statista, 2022).
According to Wrobel (2020), during the years 2018 to 2019 worldwide cashless
payment rates increased by 14% to reach 708.5 billion, the greatest growth rate in the last
decade. Besides that, cashless payment volumes are expected to expand at an 11.5%
compound annual growth rate (CAGR) from 2019 to 2023 to reach 1.1 trillion dollars. Rapidly
expanding smartphone usage, a rising e-commerce market, a blossoming acceptance of
electronic wallets, and Quick Response (QR) code payment technologies have all contributed
to the growth of the usage of cashless payment rates. Also, the epidemic of coronavirus
disease 2019 (COVID-19) has increased the use of digital and cashless payments. The epidemic
has boosted central banks’ motivation to build central bank digital currencies (CBDCs). Then,
consumers switched from physical currency to digital and cashless payment devices at an
unparalleled rate (Anneke & Szemere, 2021). As a result, a recent trend of going cashless has
emerged among individuals, organisations, and government activities, with the final idea
being to build a cashless society, which is becoming the ultimate goal across many nations
(Odi & Richard, 2013). Also, there has been a lot of research on the application of cashless
payment (Kadar et al., 2019; Olusola et al., 2013; Tee & Ong, 2016).
According to Yin (2022), in 2021, more than seven out of ten Malaysians (74%) had
experimented with becoming cashless. In 2021, the majority of Malaysian customers (55%)
indicated they can go for up to a week without having to spend cash. In comparison to 2020
(43% of Malaysian customers), this represents a 13% increase. In the long run, the COVID-19
epidemic has motivated Malaysian customers to choose cashless transactions over cash
transactions, with more than one-quarter (28%) of respondents indicating they would not
use cash after the epidemic, reflecting a long-term behavioural shift. Malaysian customers
notice that the epidemic has accelerated the country’s transition to a cashless society. They
estimate that, given current circumstances, a cashless society might be a reality by 2025.
Furthermore, Malaysians indicate that a cashless society has a number of advantages,
including preventing the transmission of the virus (58%), allowing customers to easily track
financial records (54%), decreasing the risk of stealing (52%), providing a hassle-free
experience for customers (52%), and removing the need to wait in line at banks (52%), among
many others. The study also found that acceptance of cashless payment methods is
increasing, particularly using QR codes (60%), e-wallets (54%), and contactless cards (51%).
Other cashless developments, including self-service checkouts (64%), automated app 1916
INTERNATIONAL JOURNAL OF ACADEMIC RESEARCH IN BUSINESS AND SOCIAL SCIENCES
Vol. 1 4 , No. 10, 2024, E-ISSN: 2 2 2 2-6990 © 2024
transactions (64%), and biometric transactions based on fingerprint or facial verification
(60%), are also popular (Yin, 2022).
Students in institutions of higher learning are leading the way in using cashless
transactions (Shaji & Mathias, 2021). According to Ng and Ismail (2021), students in
universities are more likely to use new or advanced technology. They are drawn to these
payment methods because of their convenience, promotions, and the fact that they are
quicker and cheaper (Shaji & Mathias, 2021). Also, it is possible that the intention to use
cashless payments is because of the generation where younger generation a more susceptible
to the changes in technology. Smartphones have become an indispensable aspect of students
daily lives. Smartphones are often used by university students to find information and
communicate with others (Ng & Ismail, 2021). The advancement of mobile platforms and
electronic commerce has a significant impact on everyday life, such as providing a variety of
new services (Kim et al., 2010). Statement of the Problem
Evan though many Malaysians are beginning to use cashless payments, but the engagement
is still relatively slow due to a lack of awareness and knowledge on the cashless payment
process, which in turn causes less trust in the cashless payment system and raises security
concerns about the payment process (Ozturk, 2016). Therefore, consumers who are
uncertain about the benefits of cashless payments continue to use cash for
transactions (Hataiseree, 2008). The higher the level of customer trust in cashless
payment, the more likely it is that it will be adopted and used. Initial trust assists
consumers in reducing perceived uncertainty and increasing usage (Ng & Ismail, 2021).
Despite the fact that 63% of Malaysian debit card holders use their cards for regular cashless
payments, consumers are still significantly reliant on cash (Azman et al., 2020). According to
the Nielsen Company (2019), 93% of Malaysians prefer cash for dinner; daily needs (90%),
public transportation (89%) and gasoline (81%).
In today’s world, cybercrime has become common in cashless payment. Cybercrime
in the context of online payments (Ng & Ismail, 2021). Bank fraud, identity theft, blackmail,
and the stealing of classified information are all examples of cybercrime (Mallow, 2019).
While using an online payment, the card information of the individuals involved must be
accessed in order for the transaction to be completed successfully. This could cause some
problems with classified information theft. Fraud and theft, as well as unauthorised access,
are the most serious security risks that consumers face when employing the e-payment
platform (Niranjanamurthy & Chahar, 2013). The cyber fraud was the most common, with
4741 occurrences, followed by the malicious codes (1023), the intrusion (755), the spam
(478), the intrusion attempt (180), the content-related (50), the vulnerabilities reported (48),
as well as the denial of service (17) (Malaysia Computer Emergency Response Team, 2022).
People are concerned about becoming victims of fraud, information theft, and theft,
especially when it pertains to financial information. As a result, customers are not persuaded
by its intention due to worries about data security and privacy as well as the potential for
fraud (Hajazi et al., 2021). Thus, the perceived risk associated with cashless payments might
decrease perceptions of behavioural and environmental control, which is likely to have a
negative impact on transaction intentions (Kailani & Kumar, 2011). 1917
INTERNATIONAL JOURNAL OF ACADEMIC RESEARCH IN BUSINESS AND SOCIAL SCIENCES
Vol. 1 4 , No. 10, 2024, E-ISSN: 2 2 2 2-6990 © 2024
University students are now more willing to use modern technology in their daily lives
(Ng & Ismail, 2021). University students would be drawn to the cashless payment method
since it is more convenient for them. For example, when a payment is made using cashless
payment, there is no need to wait in line. Additionally, it is really effortless and convenient.
However, for example, users are less likely to use mobile banking services if they require more
mental effort, are more time-consuming, or are more irritating than conventional banking
services (Chen, 2013). Besides that, when the consumer discovers that cashless payment is
not useful for their transaction needs, they will not use it (Ng & Ismail, 2021). Thus, perceived
ease of use and perceived usefulness are the significant factors in the usage of the cashless
payment system because they directly influence the consumer’s intention towards cashless
payments. On the other hand, some university students lack the knowledge to conduct
cashless payments. In reality, not every student is willing to embrace digital technologies.
University students’ daily programmes are frequently centred on digital technology. However,
some students prefer to pay with cash using the conventional method (Tiara & Usman, 2019).
Physical cash is used by students in their daily actions at university (Ng & Ismail, 2021).
There are various studies on the subject of cashless payment, but most of them are
from nations other than Malaysia, such as India, Nigeria, and other European countries
(Banerji, 2020; Gajjar, 2019; Gholami et al., 2010; Kotkowski & Polasik, 2021; Mukhopadhyay,
2016; Oyewole et al., 2013; Tiwari & Singh, 2019). Besides that, there is a lack of study on
factors that influence the intention to use cashless payment among university students (Ng &
Ismail, 2021). Furthermore, in previous research, there have been studies specifically focused
on e-payment and e-wallet among students at Public University (Jusoh & Jing, 2019; Osman
& Yi, 2021). Therefore, according to the problem above, perceived ease of use, perceived
usefulness, perceived risk, and trust might be the factors to test in order to determine
whether these factors influence the intention to use cashless payment or not. This research
assists in filling these gaps by determining the factors influencing consumers intention to use
cashless payment among undergraduate students in Public University. Research Objectives
The general objective is to determine the factors influencing consumers’ intention to use
cashless payment among undergraduate students in Public University. In addition, this study's
specific research objectives are as follows: 1.
To identify the level of consumers' intention to use cashless payment among
undergraduate students in Public University. 2.
To determine the predictors that influences consumers’ intention to use cashless
payment among undergraduate students in Public University.
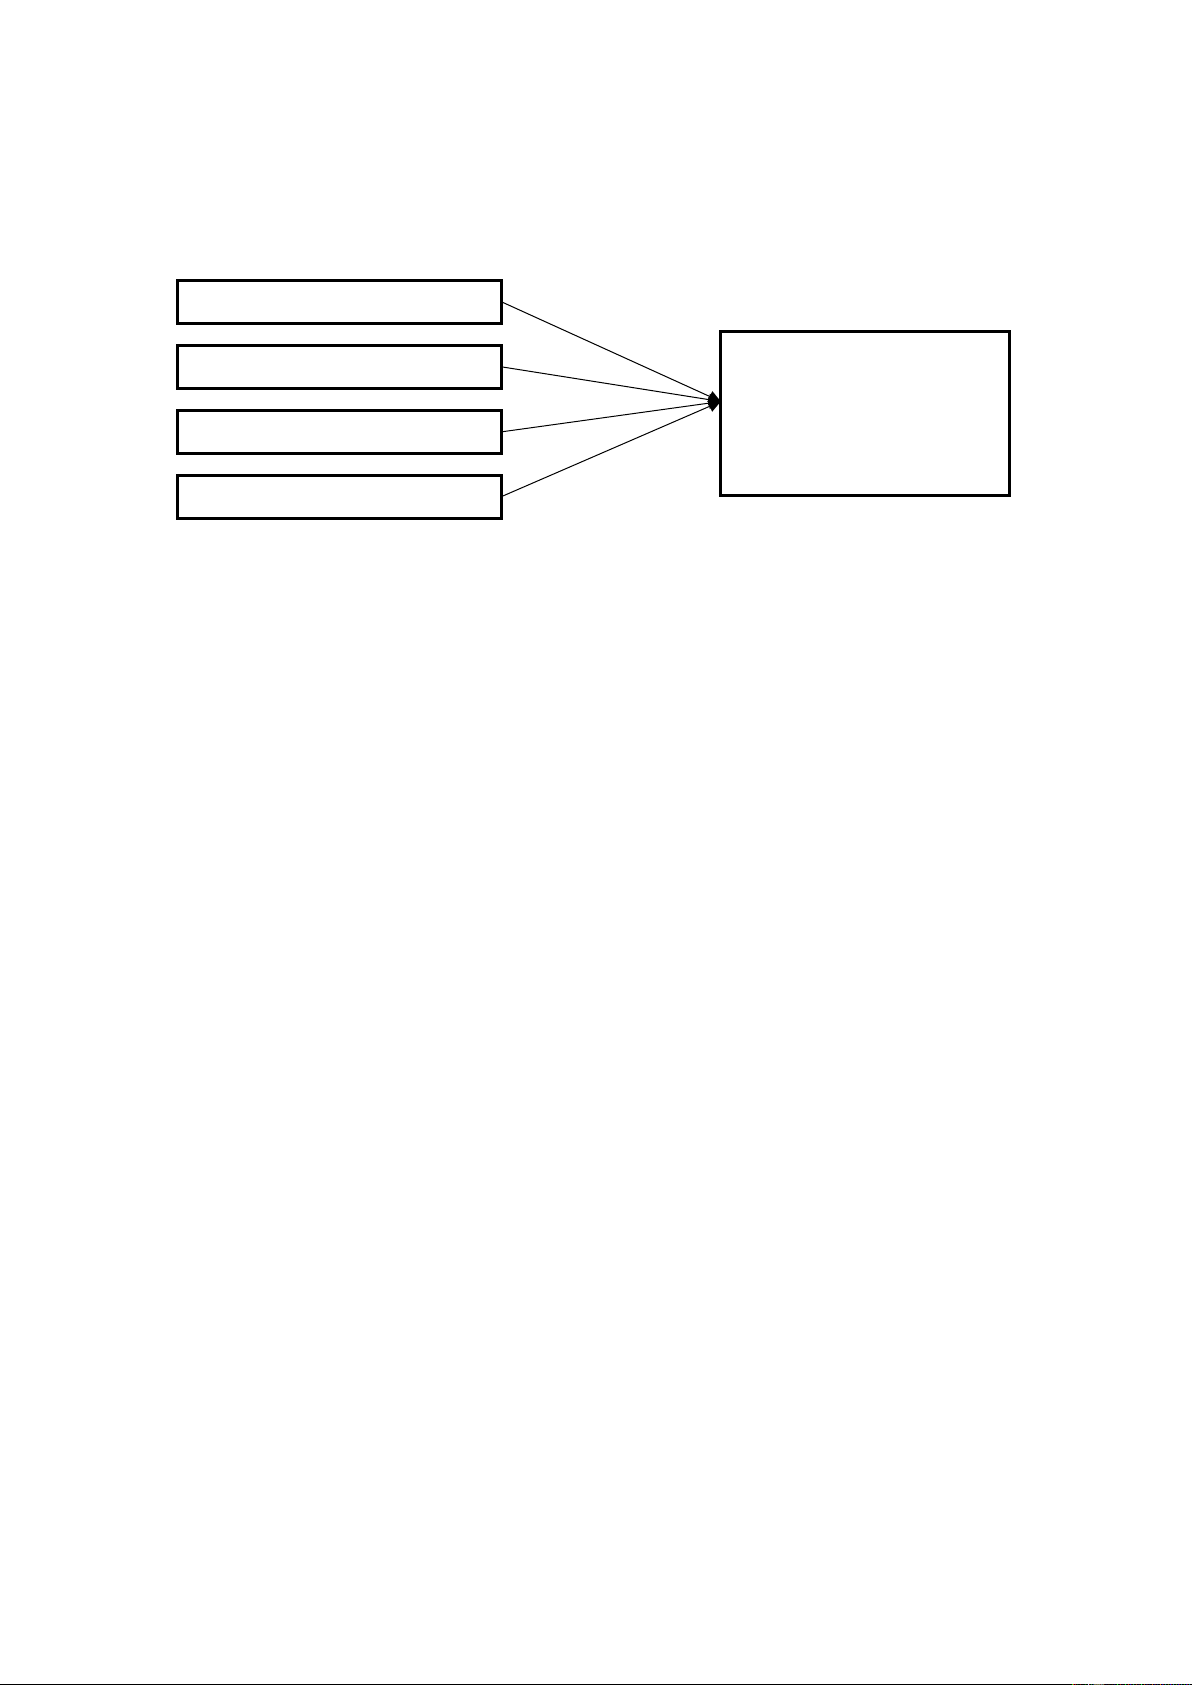
Technology Acceptance Model (TAM) was used to explain on the determinant of the user’s
intention to use the system, which is influenced by their perceptions of the system’s perceived
ease of use and perceived usefulness. Also, TAM has been updated and expanded by adding
variables of perceived risk and trust in accordance with earlier studies in order to better
comprehend the consumer’s intention to use the system. Thus, these variables served as the
foundation for the conceptual framework and hypotheses. Perceived ease of use, perceived
usefulness, perceived risk, and trust are the four independent factors with the intention to
use cashless payment as the dependent variable in this study, as shown in Figure 3. 1918
INTERNATIONAL JOURNAL OF ACADEMIC RESEARCH IN BUSINESS AND SOCIAL SCIENCES
Vol. 1 4 , No. 10, 2024, E-ISSN: 2 2 2 2-6990 © 2024 INDEPENDENT VARIABLES DEPENDENT VARIABLES Perceived Risk Trust Intention to use (the intention to use Perceived Ease of Use cashless payment) Perceived Usefulness
Figure 1: A Research Framework for This Study Methodology
A cross-sectional approach was adopted to answer the research questions above, in which
data is collected from undergraduate students at Public University. Simple random sampling
is employed. According to Thomas (2020), a simple random sample is a population subset that
has been chosen at random. With this sampling technique, every person in the population has
the exact same chance of being chosen.
In this study, Google form was used to gather data from four residential colleges who
were chosen at random. The first reason for selecting this target population is that the state
of Selangor was selected since it has the second highest mobile penetration rate (138.3%)
(Hand Phone Users Survey, 2019). The second reason for selecting this target population is
that young adults and those with a higher education level make up the majority of
smartphone users (Hand Phone Users Survey, 2022). The students will use modern technology
to conduct cashless payments (Ng & Ismail, 2021). Sampling Technique
There are nine residential colleges in the University, through sampling technique of simple
random sampling, all the names of residential colleges are written on paper and then put in a
container to be drawn at random. Four residential colleges were selected at random and then
blocks from every chosen residential college are then written on paper and put into the
random-draw container, where two blocks are selected. Later, two floors from each selected
block were selected at random. From each floor, list of email were collected and from the list,
25 email students were selected at random and the google form were send to these email.
According to Guilford (1973), a research sample size of 200 respondents is regarded as
sufficient. Thus, 200 undergraduate students were surveyed in order to complete the study
by simple random sampling, which was conducted through an online Google Form. Instruments
This research instrument is a questionnaire, which is developed in achieving the research
objective. The questionnaire is divided into six sections and it contains 46 questions in total.
In Section A, there are 11 questions that are mainly related to the demographics of 1919
INTERNATIONAL JOURNAL OF ACADEMIC RESEARCH IN BUSINESS AND SOCIAL SCIENCES
Vol. 1 4 , No. 10, 2024, E-ISSN: 2 2 2 2-6990 © 2024
respondents, such as gender, race, age, year of study, residential colleges, blocks, and another
five questions related to cashless payment using a nominal and ordinal scale. There are
another 35 questions, with 7 questions each for perceived ease, perceived usefulness,
perceived risk, trust and intention to use cashless payment.
Research Results and Discussion
Demographic Information of Respondents
The respondents are balanced for gender with 50% Male and 50% females, and in terms of
ethnic group majority are Malay (45%), followed by Chinese (39.5%) and 14.5% Indian.
Majority of the respondents are in the age between 20 and 22 years old and a large
percentage are final year students.
All the respondents had heard of the term cashless payment, with 42% of them stated that
they have heard about it between 1 to 3 years ago and 25.6% between 3 to 5 years ago.
Meaning that cashless transaction is quite new and becomes prevalent during Covid19 (Gang
et al., 2023). Majority of the respondents use e-wallet such as Boost, GrabPay, Touch and Go
e-Wallet, if there were to use cashless payment (52.0%), followed by 35.0% who use online
banking, and 13.0% frequently use the debit card. They also use cashless payment quite often,
where, 38.5% use the cashless payment around 9 or more times in a month with 33.0% use
it around 3 to 5 times in a month. They use it frequently for buying food and beverages
(52.5%), daily supplies (21%), and 19% use cashless for buying clothing (See Table below). A
study by researchers from the University of Adelaide has found that when using cashless
methods of payment, individuals tend to spend more when purchasing (Schomburgk et al., 2024). Table 1 Cashless Payment Usage Questions Frequency Percentage (%) (n-200)
Did you ever hear of cashless payment? Yes 200 100.0
How long have you heard or used cashless payment? Less than six months 7 3.5 A half-year to 1 year 19 9.5 >1 to 3 years 84 42.0 >3 to 5 years 53 26.5 More than 5 years 37 18.5
Which type of cashless payment do you use the most frequently? (choice one) Debit Card 26 13.0 Online Banking 70 35.0 1920
INTERNATIONAL JOURNAL OF ACADEMIC RESEARCH IN BUSINESS AND SOCIAL SCIENCES
Vol. 1 4 , No. 10, 2024, E-ISSN: 2 2 2 2-6990 © 2024 Touch and Go e-Wallet) 104 52.0
The number of times a month that cashless payment is used. 1 to 2 times 13 6.5 3 to 5 times 66 33.0 6 to 8 times 44 22.0 9 or more times 77 38.5
For what purpose will you use cashless payment most frequently? (choice one) Buying clothing 38 19.0 Buying daily supplies 42 21.0 Petrol 12 6.0 Buying food and beverages 105 52.5 Perceived Ease of Use
Based on Table 2, for perceived ease of use, the respondents stated that cashless payment is
simple to comprehend with mean 4.47, easy to learn, 4.46 and easy to use and user- friendly,
4.44. The overall mean for perceived of use is also high which is 4.427. This indicates that
they no longer seem cashless as complicated transaction. Once they are familiar with it they
tend to use it more often. When opting for cashless payment, the consumers will be mainly
taking account of the fast and convenient of making payments and transactions at anytime
and anywhere with the use of mobile phone payment (Humbani & Wiese, 2018). As the e-
wallet that can be virtually brought to anywhere in the form of mobile devices, it had
enhanced the convenient of consumer in making purchase and transaction from anywhere, anytime (Ishak, 2020). 1921
INTERNATIONAL JOURNAL OF ACADEMIC RESEARCH IN BUSINESS AND SOCIAL SCIENCES
Vol. 1 4 , No. 10, 2024, E-ISSN: 2 2 2 2-6990 © 2024 Table 2 Perceived Ease of Use Score Statement Mean S.D.
Cashless payment is simple to comprehend. 4.47 0.600
Learning to use cashless payment is simple for me. 4.46 0.671
I can remember how to conduct tasks by using cashless payment 4.40 0.723 with ease.
I spend less time and energy when I use cashless payment. 4.43 0.726
Cashless payment is easy to use and user-friendly. 4.44 0.692
I like the fact that transactions completed by using cashless 4.40 0.694
payment require minimum effort.
My interaction with the cashless payment interface is 4.39 0.699
understandable and straightforward. Mean score and Mean S.D. 4.427 0.6864 Perceived Usefulness
The statements of the perceived usefulness variable are summarised in Table 3 below,
along with their mean and standard deviation scores. Table 4 below shows that respondents
stated that they believed that cashless payment is more simplier especially when being online
(mean value 4.49), and work become simpler and can finish quickly (both mean value 4.45).
The study by Daisy et al. (2021) showed that there are many positive impacts of using the cashless method. Table 3 Perceived Usefulness Score Statement Mean S.D.
In my daily life, I find that using cashless payment is useful. 4.42 0.690
When using cashless payment, I will be more productive. 4.18 0.801
When using cashless payment, it is easier for me to perform 3.39 0.656 transactions. 1922
INTERNATIONAL JOURNAL OF ACADEMIC RESEARCH IN BUSINESS AND SOCIAL SCIENCES
Vol. 1 4 , No. 10, 2024, E-ISSN: 2 2 2 2-6990 © 2024
After using cashless payment, work becomes simpler. 4.45 0.670
I believe that making an online payment would be simpler for me 4.49 0.618 when using cashless payment.
When using cashless payment, I can complete tasks more quickly, 4.45 0.648 like making payments.
In general, I believe that cashless payment is more useful than 4.34 0.746
conventional methods of conducting transactions. Mean score and Mean S.D. 4.246 0.6899 Perceived Risk
Based on Table 5, what can be concluded is that respondents are confidents with the safety
of using cashless payment. This can be seen that the mean value for every statement
measuring risk is low as compare to other others statement measuring usefulness and ease
of use. The overall mean value for perceived is 3.981 which is low as compare to the other
variables. However, they are those who are still concern that the possibility of others to get
access to their account (mean value 4.08), whether they can easily get their money back if
they were to make mistake during transaction (mean value 4.07) and they show concern
about their money in the account to be used by others (mean value 4.06). The role of safety
and security is crucial in promoting the adoption of cashless payment methods. Previous
study also shown that there are several risks associated with security, including hacking,
stolen PINs, and card duplication. These risks provide consumers with sufficient reasons to
reconsider the adoption of cashless payment methods (Jain & Jain, 2017). 1923
INTERNATIONAL JOURNAL OF ACADEMIC RESEARCH IN BUSINESS AND SOCIAL SCIENCES
Vol. 1 4 , No. 10, 2024, E-ISSN: 2 2 2 2-6990 © 2024 Table 4 Perceived Risk Score Statement Mean S.D.
The use of cashless payment is not entirely secure. 3.91 0.799
I am concerned about using cashless payment since other 4.08 0.808
individuals might be able to access my account. While using
cashless payment, the risk of my information being 4.02 0.820 misused is high.
While using cashless payment, I am concerned if the money in 4.06 0.887 my account is at risk.
I am concerned that while using cashless payment, the system
would not be able to recover the capital loss for me if I made a 4.07 0.818 mistake.
In general, using cashless payment is not a secure method of 3.78 0.943
sending information and conducting transactions. Mean score and Mean S.D. 3.981 0.8504 Trust
For trust, overall respondents indicated that they have a medium level of trust towards the
cashless payment system where the mean value is below 4 at 3.959. However, they still have
trust to the system where they believed that those who involves in making the cashless
system have the consumer in mind (mean value 4.12), the cashless payment is reliable means
of payment (mean value 4.08) and the company who implemented this system are law abiding
citizen (mean value 4.05). The respondents have trust for the cashless system and if they
believe all the system is in place and safe with both the industry player and regulator play
their role in ensuring the safety of this transaction then they will feel safe and continue using it. 1924
INTERNATIONAL JOURNAL OF ACADEMIC RESEARCH IN BUSINESS AND SOCIAL SCIENCES
Vol. 1 4 , No. 10, 2024, E-ISSN: 2 2 2 2-6990 © 2024 Table 5 Trust Score Statement Mean S.D.
I believe that cashless payment keeps the best interests of the 4.12 0.710 customer in mind.
I believe that cashless payment is safe. 3.76 0.932
I believe that if I have any problems, the service provider will assist 3.82 0.928 me.
I believe that the companies that provide cashless payment will 3.88 0.874 keep my information private.
I believe in transactions that are made using cashless payment. 4.00 0.754
I believe that the companies that provide cashless payment adhere 4.05 0.781 to consumer law.
I believe that cashless payment provides a reliable means of 4.08 0.729 payment. Mean score and Mean S.D. 3.959 0.8154 Intention to Use
Table 7 shows that the commitment to continue using cashless payment is high with overall
mean value at 4.319. According to Kosnin and Lee (2008), mean score mean values ranging
from 3.68 to 5.00 are considered high. This a positive sign because they are committed to
continue using it in the future (mean value 4.42). However, if the opportunity to use and the
ease of use and it is easily available might provide them the reason to continue using in the
future (4.39) and also, if there is no additional cost involves and the time taken to process the
payment is shorten (mean value 4.36). Once, the consumer feels that they can gain benefit
from using the cashless payment, the possibility of them using this cashless payment in the
future is high. Previous study also shown that the use of digital currencies or electronic cards
and wallet are the most common methods to be used in the cashless payment (Rahman et al,
2020). According to the World Payments Report (2020), there has been a significant increase
in global cashless transactions, with a growth rate of approximately 14% observed between 2018 and 2019. 1925
INTERNATIONAL JOURNAL OF ACADEMIC RESEARCH IN BUSINESS AND SOCIAL SCIENCES
Vol. 1 4 , No. 10, 2024, E-ISSN: 2 2 2 2-6990 © 2024 Table 6 Intention to Use Score Statement Mean S.D.
I will probably use cashless payment in the near future. 4.42 0.636
I intend to increase the use of cashless payment in the future. 4.30 0.716
I intend to use cashless payment once the opportunity arises. 4.39 0.623
I will make every attempt to use cashless payment. 4.20 0.800
I intend to use cashless payment regularly in my daily life. 4.27 0.824
I will suggest others use cashless payment. 4.29 0.668
If the costs and the processing times are reasonable to me, I intend to use cashless payment. 4.36 0.626 Mean score and Mean S.D. 4.319 0.6990
Factors Influencing Intention to Use Cashless Payment
Factors such as perceived ease of use, perceived usefulness, perceived risk and trust were
regress with intention to use cashless payment in the future among university students in
UPM. The model summary as shon in Table 8 below, shows the strength and fit of the regression model. Table 7
Model Summary (Intention to Use) Model R R2 Adjusted R2 Std. Error of the Estimate 1 0.737a 0.544 0.534 0.35746
a. Predictors: (Constant), Trust, Perceived Risk, Perceived Ease of Use, Perceived Usefulness 1926
INTERNATIONAL JOURNAL OF ACADEMIC RESEARCH IN BUSINESS AND SOCIAL SCIENCES
Vol. 1 4 , No. 10, 2024, E-ISSN: 2 2 2 2-6990 © 2024 Table 8
Multiple Linear Regression (Intention to Use) Unstandardized
Standardized Coefficients Coefficients Variables B Std. Error Beta T Sig. (Constant) 0.493 0.276 1.787 0.076 Perceived ease of use 0.229 0.075 0.227 3.072 0.002 Perceived usefulness 0.451 0.080 0.428 5.597 0.001 Perceived risk 0.029 0.040 0.036 0.734 0.464 Trust 0.181 0.045 0.215 4.000 0.001 a. Intention to Use
Based on the results in Table 8, the value of R is 0.737, meaning that there are 73.7% of
correlations between the independent variables (perceived ease of use, perceived usefulness,
perceived risk, and trust) and the dependent variable (intention to use).
Besides that, determine the proportion of the variance in a regression model's
dependent variable (intention to use) that can be explained by the independent variables
(perceived usefulness, perceived risk, and trust). Based on Table 8, the R-Square value for this
study indicates that 54.4% (0.544) of the variation was explained.
The identified predictors for intention to continue use of the cashless payment are
perceived usefulness (p<0.001), trust (p<0.001) and perceived ease of use (p<0.002) (Table
9). However, perceived risk are not significant predictors for intention to use in the future of
the cashless payment. Similar results from earlier studies support this finding that perceived
ease of use is the most significant factor that influences consumer intention to use cashless
payment (Azman et al., 2020; Mun et al., 2017; Ng & Ismail, 2021; Osman & Yi, 2021; Sidek,
2015; Toh et al., 2009). In Malaysia, the campaign to create a cashless society does not denote
on the shortage of cash in the country but to promote on the use of cashless payment to
produce a new culture where individuals who manage their financial transaction digitally
without the use of physical cash (Ramya et al, 2017).
Furthermore, based on Table 8, perceived ease of use has the second- highest B-value
of a variable, with a B-value of 0.229, which is higher than the B- values of perceived risk and
trust. perceived usefulness‖ variable is the most significant factor that influences the
consumers' intention to use cashless payment among undergraduate students at Public University. Conclusion
This study investigates the factors influencing Public University undergraduate students'
intention to accept cashless payment systems employing the Technology Acceptance Model
(TAM). This research offers a thorough understanding of the factors that influence consumer
behaviour in the context of cashless payments through the integration of extra variables 1927
INTERNATIONAL JOURNAL OF ACADEMIC RESEARCH IN BUSINESS AND SOCIAL SCIENCES
Vol. 1 4 , No. 10, 2024, E-ISSN: 2 2 2 2-6990 © 2024
involving perceived risk and trust into the conventional TAM framework, which originally
consisted of perceived ease of use and perceived usefulness.
The results indicate the significant of perceived ease of use, perceived usefulness, and
trust on the need towards cashless payment systems. These findings suggest that if students
perceive cashless payment options are advantageous and user-friendly, they will be more
likely to adopt them. Consequently, organisations that offer cashless payment systems ought
to concentrate on improving the user interface and simplifying it.
Furthermore, the study shows that consumers' trust and, consequently, their
propensity to adopt cashless payment systems are negatively impacted by perceived risk.
Cashless payment providers need to have strong security measures in place, like security
seals, guarantees against fraud, and extensive user compensation programmes, to allay these
worries. Furthermore, in order to develop awareness campaigns that enlighten consumers
about cybersecurity, fraud prevention, and the legal safeguards in place to secure their
financial and personal information, cooperation with financial institutions, governments, and
legislators is crucial. These programmes have the potential to greatly reduce perceived risks and increase customer trust.
This work has consequences that go beyond scholarly contributions. The research
findings provide university students with a better understanding of cashless payment
methods, which may lead to increased awareness and adoption rates. The results highlight
important factors for cashless payment providers and developers that guide resource
allocation, innovation, and marketing plans meant to successfully satisfy customer
preferences and expectations. Government investment in and promotion of cashless
payment infrastructure can spur economic growth by lowering reliance on hard currency and
streamlining financial transactions. The government can facilitate the wider adoption of
cashless payment technology and ultimately aid in the modernization of economic processes
in Malaysia by establishing a dependable and steady ecosystem. To sum up, the incorporation
of perceived danger and trust into the TAM framework offers a refined comprehension of the
variables impacting the inclination to utilise cashless transactions. A more effective and safe
financial environment can be created by addressing these problems through focused
interventions by financial institutions, government agencies, and suppliers of cashless
payment systems. Doing so will greatly increase consumer trust and adoption of cashless payment systems. 1928
INTERNATIONAL JOURNAL OF ACADEMIC RESEARCH IN BUSINESS AND SOCIAL SCIENCES
Vol. 1 4 , No. 10, 2024, E-ISSN: 2 2 2 2-6990 © 2024 References
Abdullah, N., Redzuan, F., & Daud, N. (2020). E-wallet: factors influencing user acceptance
towards cashless society in Malaysia among public universities. Indonesian Journal of
Electrical Engineering and Computer Science, 20(1), 67– 74.
Anneke, K., & Szemere, R. (2021). Covid-19 accelerated the digitalisation of payments. BIS.
Azman, H., Tan, Z. Y., & Bakria, M. H. (2020). The factors that affecting consumer intention to
utilize the electronic payment system in Malaysia. Journal of Technology Management
and Technopreneurship, 8, 129–138.
Banerji, R. (2020). Cashless payments in India: An empirical study on credit card selection and
usage preferences. International Journal of Financial Services Management, 10(4), 309– 321.
Charfeddine, L., & Nasri, W. (2013). The behaviour of intention of Tunisian banks' customer
on using internet banking. International Journal of Innovation in the Digital Economy, 4(1), 16-30.
Chen, C. (2013). Perceived risk, usage frequency of mobile banking services. Managing
Service Quality, 23(5), 410-436. Communication Engineering, 2(7), 2885– 2895.
Daisy, M. H. Kee, Nur Nuha N. H., Nur Hidayu A. R., Nur Sobbah A. A., Nur Aqilah M., Nur Aimi
Zayani Binti Mahadi (2021). The Impact of Using Cashless Payment during the Covid-19
Pandemic: A Case Study of Maybank. International Journal of Applied Business and
International Management, Vol. 4, No. 2.
Gajjar, C. A. K. N. (2019). Study of cashless economy of India. International Journal of
Multidisciplinary Educational Research, 8(8), 143–152.
Gang, X., Sean, C. S., Ching, Y., Muzaini, O. & Dany, C. W. Ng (2023), A Comparative Study on the
Adoption of Cashless Payment: Malaysia and China. International Journal of Academic
Research in Business and Social Sciences (IJARBSS). Vol. 13, No. 11.
Guildford, J. P. (1973). Fundamental statistics in psychology and education (5th ed.).
Hajazi, M. U. A., Chan, S. S., Ya‘kob, S. A., Siali, F., & Latip, H. A. (2021). Usage intention to use
QR mobile payment system among millennials in Malaysia. International Journal of
Academic Research in Business and Social Sciences, 11(1).
Hataiseree, R. (2008). Development of e-payments and challenges for central banks:
Thailand’s recent experience. Payment Systems Department.
Humbani, M., & Wiese, M. (2018). A cashless society for all: Determining consumers’
readiness to adopt mobile payment services. Journal of African Business, 19(3), 409- 429.
Ishak, I. (2020). Determinant in acceptance of cashless payment: An empirical study in
Malaysia. International Journal of Psychosocial Rehabilitation, 24(4), 4683– 4692.
Jain, V., & Jain, P. (2017). A journey towards a cashless society. Banking Sector in Oman: Strategic
Issues, Challenges and Future Scenarios, 61-72.
Jusoh, Z. M., & Jing, T. Y. (2019). Perceived security, subjective norm, self-efficacy, intention,
and actual usage towards e-payment among UPM students. Journal of Education and
Social Sciences, 12(2), 8-22.
Kadar, H. H. B., Sameon, S. S. B., Din, M. B. M., & Rafee, P. A. B. A. (2019).
Kailani, M., & Kumar, R. (2011). Investigating uncertainty avoidance and perceived risk for
impacting internet buying: A study in three national cultures. International Journal of
Business and Management, 6(5), 76-92.
Kotkowski, R., & Polasik, M. (2021). COVID-19 pandemic increases the divide between cash
and cashless payment users in Europe. Economics Letters, 209, 110–139. 1929
INTERNATIONAL JOURNAL OF ACADEMIC RESEARCH IN BUSINESS AND SOCIAL SCIENCES
Vol. 1 4 , No. 10, 2024, E-ISSN: 2 2 2 2-6990 © 2024
Krüger, M., & Seitz, F. (2014). Costs and benefits of cash and cashless payment
instruments: overview and initial estimates. Study commissioned by the Deutsche Bundesbank. Frankfurt.
Liu, Z., & Zhang, A. (2020). Sampling for big data profiling: A survey. IEEE Access: Practical
Innovations, Open Solutions, 8, 72713–72726.
Malaysia Computer Emergency Response Team. (2022). Reported incidents based on general
incident classification statistics 2022. MyCERT. Malaysia towards cashless society.
Lecture Notes in Electrical Engineering, 565, 34–42.
Mallow, M. S. (2019). Cybercrimes: Security and cashless society. New Straits Times.Merchant
machine. (2022). Merchant Machine.
Mukhopadhyay, B. (2016). Understanding cashless payments in India. Financial Innovation, 2(1), 1-26.
Mun, Y., Khalid, H., & Nadarajah, D. (2017). Millennials’ perception on mobile payment
services in Malaysia. Procedia Computer Science, 124, 397-404.New York: McGraw-Hill.
Ng, P., & Ismail, S. N. (2021). Determinants of influence factors of consumer’s intention to use
cashless transaction mode among UTHM students. Research in Management of
Technology and Business, 2(1), 273–292.
Niranjanamurthy, M., & Chahar, D. (2013). The study of e-commerce security issues and
solutions. International Journal of Advanced Research in Computer and
Odi, N., & Richard, E. O. (2013). Electronic payment in cashless economy of Nigeria: Problems
and prospects. Journal of Management Research, 5(1), 138- 151.
Olusola, M., Oludele, A., Chibueze, O., & Samuel, O. (2013). Cashless society: Drive’s and
challenges in Nigeria. International Journal of Information Sciences and Techniques, 3(2), 1–11.
Osman, S., & Yi, L. Y. (2021). Factors influencing the intention to adopt ewallet among
students of Public University . Sciences, 11(11), 1624-1641.
Oyewole, O. S., Gambo, J., Abba, M., & Onuh, M. E. (2013). Electronic payment system and
economic growth: A review of transition to cashless economy in Nigeria. International
Journal of Scientific Engineering and Technology, 2(9), 913-918.
Premchand, A., & Choudhry, A. (2015). Future of payments–epayments. International Journal
of Emerging Technology and Advanced Engineering, 5, 110-115.
Rahman, M., Ismail, I., & Bahri, S. (2020). Analysing consumer adoption of cashless payment in
Malaysia. Digital Business, 1(1), 100004.
Ramya, N., Sivasakthi, D., & Nandhini, M. (2017). Cashless transaction: Modes, advantages and
disadvantages. International Journal of Applied Research, 3(1), 122-125.
Schomburgk, L., Belli, A., & Hoffmann, A. O. I. (2024). Less cash, more splash? A meta-analysis on
the cashless effect. Journal of Retailing.
Shaji, J., & Mathias, C. (2021). Impact of cashless payment mode among university students.
Journal of Interdisciplinary Cycle Research, 13(2), 1795–1809.
Sidek, N. (2015). Determinants of electronic payment adoption in Malaysia: the
stakeholders’ perspectives. University of Queensland Library.
Sreenu, N. (2020). Cashless payment policy and its effects on economic growth of India: An
exploratory study. ACM Transactions on Management Information Systems (TMIS), 11(3), 1-10.
Statista. (2022). Number of cashless transactions worldwide 2013–2018.
Tee, H. H., & Ong, H. B. (2016). Cashless payment and economic growth. Financial Innovation, 2(1), 1–9. 1930
INTERNATIONAL JOURNAL OF ACADEMIC RESEARCH IN BUSINESS AND SOCIAL SCIENCES
Vol. 1 4 , No. 10, 2024, E-ISSN: 2 2 2 2-6990 © 2024
Tiara, O. R., & Usman, O. (2019). Effect of trust, perceived of use, consumer perception, and
behavior intention on the use of digital wallet among college students. SSRN Electronic Journal.
Tiwari, N., & Singh, N. K. (2019). Factor affecting consumer satisfaction in cashless payment
systems in India with respect to Paytm and BHIM. International Journal of Recent
Technology and Engineering (IJRTE), 8, 10-15.
Public University. (2022). UPM facts & figures 2022. The Official Portal of Public University.
World Payments Report. (2020). Non-cash payments volume. Retrieved March 11, 2022, from
https://worldpaymentsreport.com/non-cash-payments- volume-2.
Wrobel, E. (2020). Non-cash payments volume. World Payments Report.
Yin, A. C. P. (2022). Visa study: Majority of malaysians can go without cash for more than a week. RinggitPlus. 1931
Tài liệu liên quan:
-
Ung dung game hoa trong cac chien dich MKT
23 12 -
Bao cao Chi so TMDT Viet Nam 2025
26 13 -
Thông tư quy định về việc phân quyền, phân cấp và phân định thẩm quyền quản lý nhà nước về giáo dục cho chính quyền địa phương
30 15 -
Nghị quyết về phát huy các giá trị di sản văn hóa gắn với phát triên du lịch bền vững tỉnh Khánh Hòa đến năm 2025, định hướng đến năm 2030
26 13 -
Quyết định phê duyệt Chiến lược phát triển du lịch Việt Nam đến năm 2030
16 8