Ôn tập kinh tế nông nghiệp | Trường Đại học Kinh Tế - Luật
Phát triển NN bền vững là mô hình phát triển mà trong đó có sự ràng buộc giữa tăng trưởng nông nghiệp và tăng trưởng chung nền kinh tế; tăng trưởng nông nghiệp với môi trường tự nhiên; sự nghèo đói và môi trường con người ở nông thôn. Tài liệu giúp bạn tham khảo, ôn tập và đạt kết quả cao. Mời đọc đón xem!
Môn: Kinh tế vi mô (KTVM) 238 tài liệu
Trường: Trường Đại học Kinh Tế - Luật, Đại học Quốc gia Thành phố Hồ Chí Minh 1.6 K tài liệu
Tác giả:


Preview text:
lOMoAR cPSD| 45688262
Q: What is the best definition of sustainable A: Phát triển NN bền vững là mô hình phát triển agricultural development?
mà trong đó có sự ràng buộc giữa tăng trưởng
nông nghiệp và tăng trưởng chung nền kinh tế;
A: Sustainable agricultural development is a tăng trưởng nông nghiệp với môi trường tự
development model in which there is a link nhiên; sự nghèo đói và môi trường con người ở
between agricultural growth and the overall nông thôn.
growth of the economy; agricultural growth with
natural environment; poverty and the human Q: Nông nghiệp bền vững tích hợp ba mục tiêu environment in rural areas.
chính, bao gồm sức khỏe môi trường, lợi nhuận
kinh tế và công bằng xã hội. Trong bài viết này,
Q: Sustainable agriculture integrates three major bạn chỉ phân tích và đưa ra quan điểm của bản
goals, including environmental health, economic thân về phát triển nông nghiệp bền vững ở Việt
profitability, and social equity. In this essay, you Nam dưới góc độ lợi nhuận kinh tế. Bạn có thể
only analyse and give your own perspectives sử dụng dữ liệu để chứng minh lập luận của mình
about the sustainable agricultural development in nếu cần thiết. Dữ liệu và thông tin phải được cập
Vietnam in terms of economic profitability. You nhật đến thời điểm hiện tại.
may use data to prove your arguments, if it’s
necessary. Data and information must be updated A: up to now.
Q: Chỉ ra những hàm ý đối với các chính sách A:
nông nghiệp liên quan đến phát triển bền vững
dựa trên khuôn khổ và phân tích trên của bạn
Q: Pointing out implications for agricultural
policies related to sustainable development
based on the framework and your above analysis A:
* Hệ thống chính sách kinh tế 1) Đầu tư cho A:
nghiên cứu ứng dụng và phổ biến các kỹ thuật
*Economic policy system
mới gắn với cân bằng sinh thái; 2) Ổn định giá 1) Invest in applied research
and các yếu tố đầu vào cho sản xuất nông nghiệp và
disseminationof techniques new associated with nông sản; ecological balance;
3) Tạo cơ hội sinh kế bền vững cho nông dân – 2)
Stabilize the prices of inputs for người dân nghèo ở vùng nông thôn;
agriculturalproduction and agricultural products; *
Hệ thống chính sách giáodục1) Nâng 3) Creating sustainable
livelihood cao trình độ văn hóa cho thế hệ tương lai của
opportunities for farmers - people poverty in
nông dân và người dân nông thôn; 2) Khả năng rural areas;
nhận thức về môi trường; 3) Kiểm soát tăng
*Education policy system trưởng dân số.
1) Raise the level of culture for futuregenerations *
Hệ thống chính sách bảovệ môi trường
of agriculture people and rural tựnhiên people; 1)
Tập trung vào hoàn chỉnh luật và hệ
2) Environmental awareness ability;
thốngcưỡng chế có hiệu quả đối với bảo vệ môi 3) Control population growth;*
Natural trường;
environmental protection policy system 2)
Hoàn chỉnh việc giao quyền sử dụng đất
1) Focus on complete law and enforcement rừngcho nông dân.
system efficiency for environmental Q: Định protection;
nghĩa đúng nhất về phát triển nông nghiệp bền 2) Complete the allocation of forest land use vững là gì? rights to agriculture people. lOMoAR cPSD| 45688262
* Health care and nutrition policy system Q: Trong các chiến lược phát triển bền vững, maintenance
chúng ta đã xác định một số chỉ tiêu quan trọng
Interested in improving the usability of people về phát triển không bền vững. Liệt kê một số chỉ
rural areas for community health services, clean tiêu (theo thức tự quan trọng về phát triển bền
water and nutrition maintenance
vững trong nông nghiệp và cho ví dụ về ứng dụng của chúng
Q: In Chapter7, in strategy for sustainable
development, we have identified several A: Các dấu hiệu của sự phát triển không bền
indicators of non-sustainable development, list a vững là suy thoái môi trường, quy hoạch tồi và
few indicators (in a sequence of important of khai thác tài nguyên. Việc tạo ra chất thải và ô
sustainable deverlopment and illustrate their nhiễm có ảnh hưởng xấu đến đa dạng sinh học. application, Giải thích:
A: The indicators of unsustainable development Do dân số tăng và sự phân tán dân số đô thị dẫn
are the degradation of the environment, bad đến các thành phố và thị trấn phải đối mặt với áp
planning and the exploitation of resources. The lực quản lý chất thải, giao thông vận tải, cung cấp
generation of waste and pollution that has a không khí trong lành, cung cấp nước sạch và tiếp
damaging effect on the biodiversity.
cận với môi trường xanh sạch. Explanation:
Due to increase in population and the spread of Tính bền vững lâu dài của thị trấn hoặc thành phố
urban population has resulted in the cites and bị cản trở do suy thoái môi trường và ô nhiễm
towns face the pressures of waste management, không khí.
transportation,fresh supply of air supply, supply Sự phát triển thiếu bền vững gây áp lực lớn đối
of clean water and access to clean and green với môi trường tự nhiên do khai thác các nguồn environment.
năng lượng từ các hệ sinh thái.
The long term sustainability of the town or city
gets hampered due to degradation of the
environment and the pollution in the air.
Q: Hãy tưởng tượng, bạn là một nông dân, bạn
The unsustainable development puts a major nên làm gì để đạt được mục tiêu đầu tiên, sức
pressure on the natural environment due to khỏe môi trường.
extraction of energy resources from the ecosystems.
A: Chọn trong các ý dưới đây
Bảo vệ bản thân và những người khác
Q: Imagine, you are a farmer, what you should
khỏi các nguy cơ môi trường như ô nhiễm
do to reach the first goal, environmental health.
tiếng ồn, không khí và nước, khói thuốc
thụ động, bức xạ tia cực tím A:
Đi bộ hoặc đạp xe (nếu thời tiết cho phép)
Protect yourself and others from bất cứ khi nào có thể
environmental hazards such as noise, air and
Tái chế và giảm chất thải
water pollution, second hand smoke,
Tiết kiệm năng lượng bằng cách sử dụng ultraviolet radiation
Walk or ride your bike (weather permitting) whenever possible
*Hệ thống chính sách chăm sóc sức khỏevà Recycle and reduce waste dinh dưỡng
Conserve energy by using energy
Quan tâm đến việc cải thiện khả năng sử dụng
efficient light bulbs and appliances
của người dân nông thôn đối với dịch vụ y tế
Print less. Try reading online or sharing
cộng đồng, nước sạch và dinh dưỡng
reading materials with classmates lOMoAR cPSD| 45688262 Eat locally produced food
Visit local farmers markets in London
Save water. Turn off the water when
brushing your teeth, shaving, or scrubbing the dishes
Use a reusable coffee cup, water bottle and lunch container
Unplug and turn off electronics and turn
down the heat at home, school and work
Purchase products in bulk when possible to reduce packaging waste
Use reusable bags or paper bags when shopping
Use toxic free cleaning materials and personal care products
Join an environmental organization
Educate yourself on environmental issues
bóng đèn và thiết bị tiết kiệm năng lượng
In ít hơn. Thử đọc trực tuyến hoặc chia sẻ
tài liệu đọc với bạn cùng lớp
Ăn thực phẩm sản xuất tại địa phương
Ghé thăm chợ nông dân địa phương ở London
Tiết kiệm nước. Tắt nước khi đánh răng,
cạo râu hoặc cọ rửa bát đĩa
Sử dụng cốc cà phê, chai nước và hộp
đựng đồ ăn trưa có thể tái sử dụng
Rút phích cắm và tắt thiết bị điện tử và
giảm nhiệt ở nhà, trường học và nơi làm việc
Mua sản phẩm với số lượng lớn khi có
thể để giảm lãng phí bao bì
Sử dụng túi tái sử dụng hoặc túi giấy khi mua sắm
Sử dụng vật liệu làm sạch không độc hại
và các sản phẩm chăm sóc cá nhân
Tham gia một tổ chức môi trường
Giáo dục bản thân về các vấn đề môi trường lOMoAR cPSD| 45688262
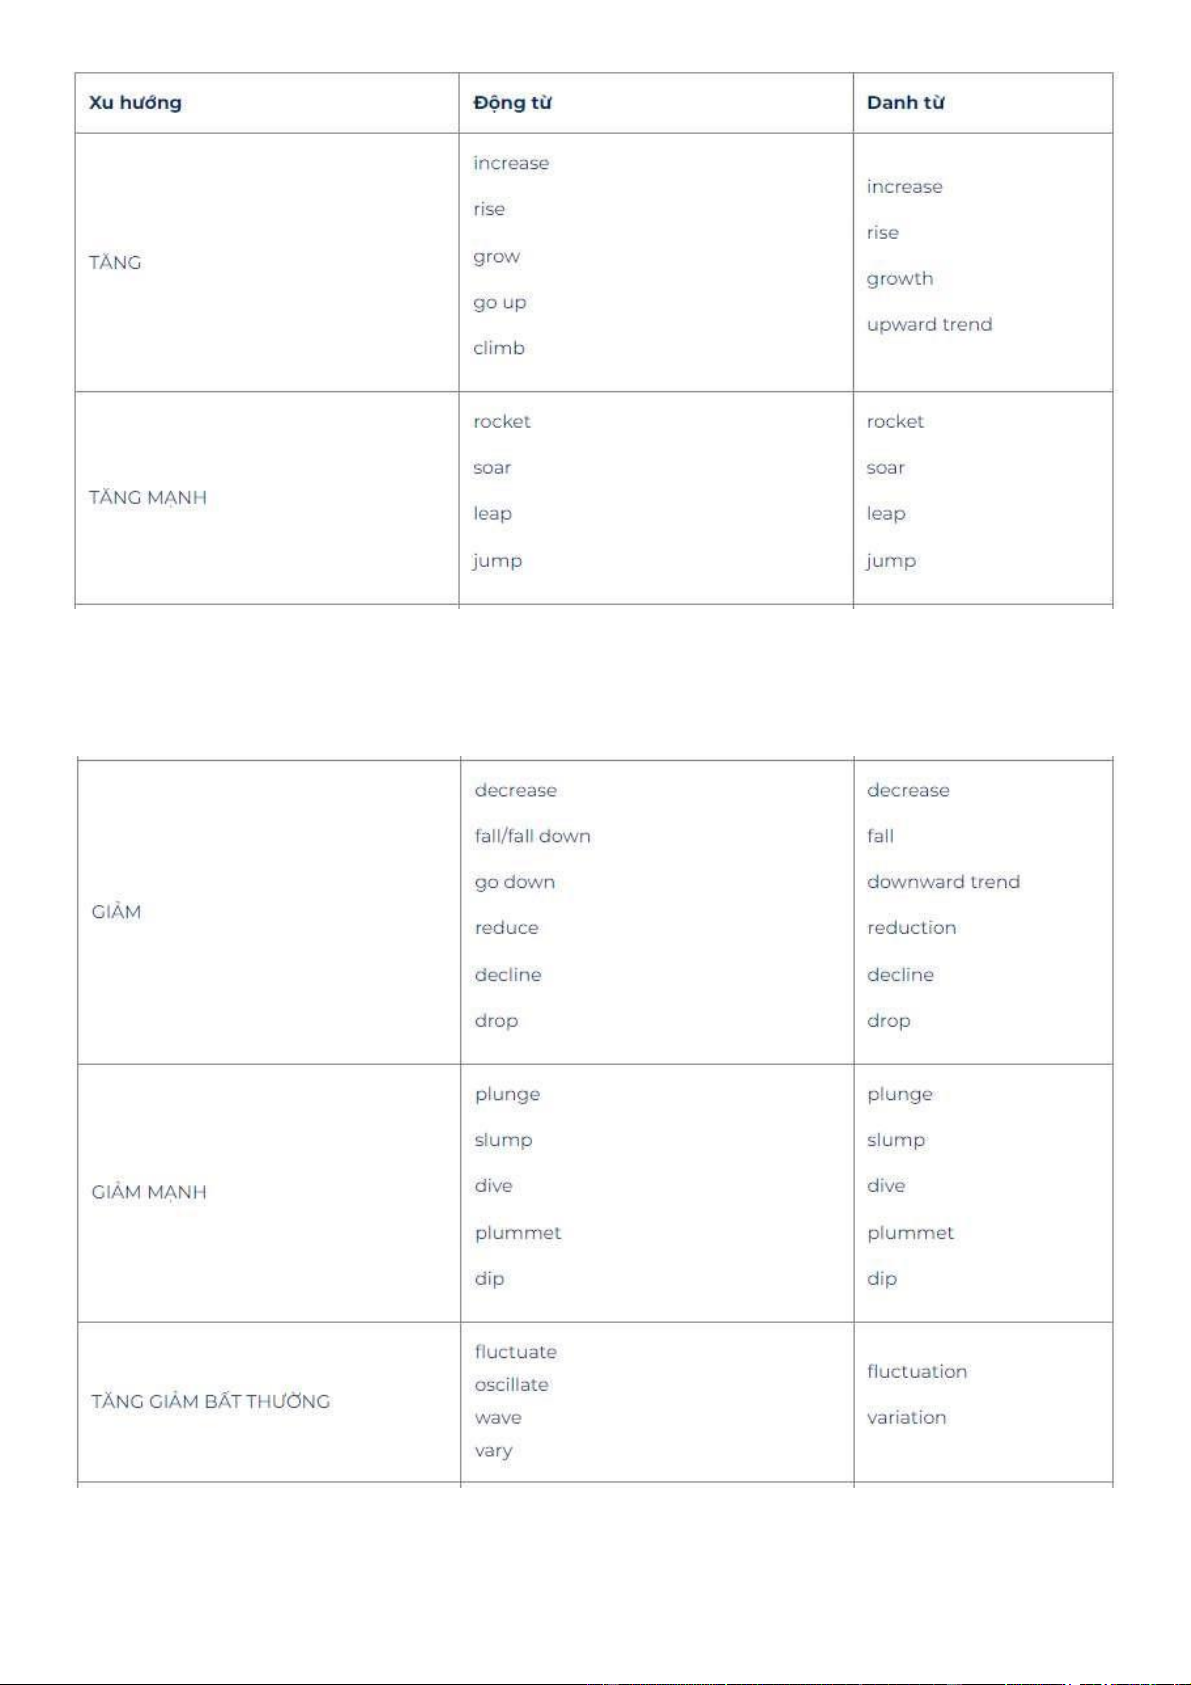
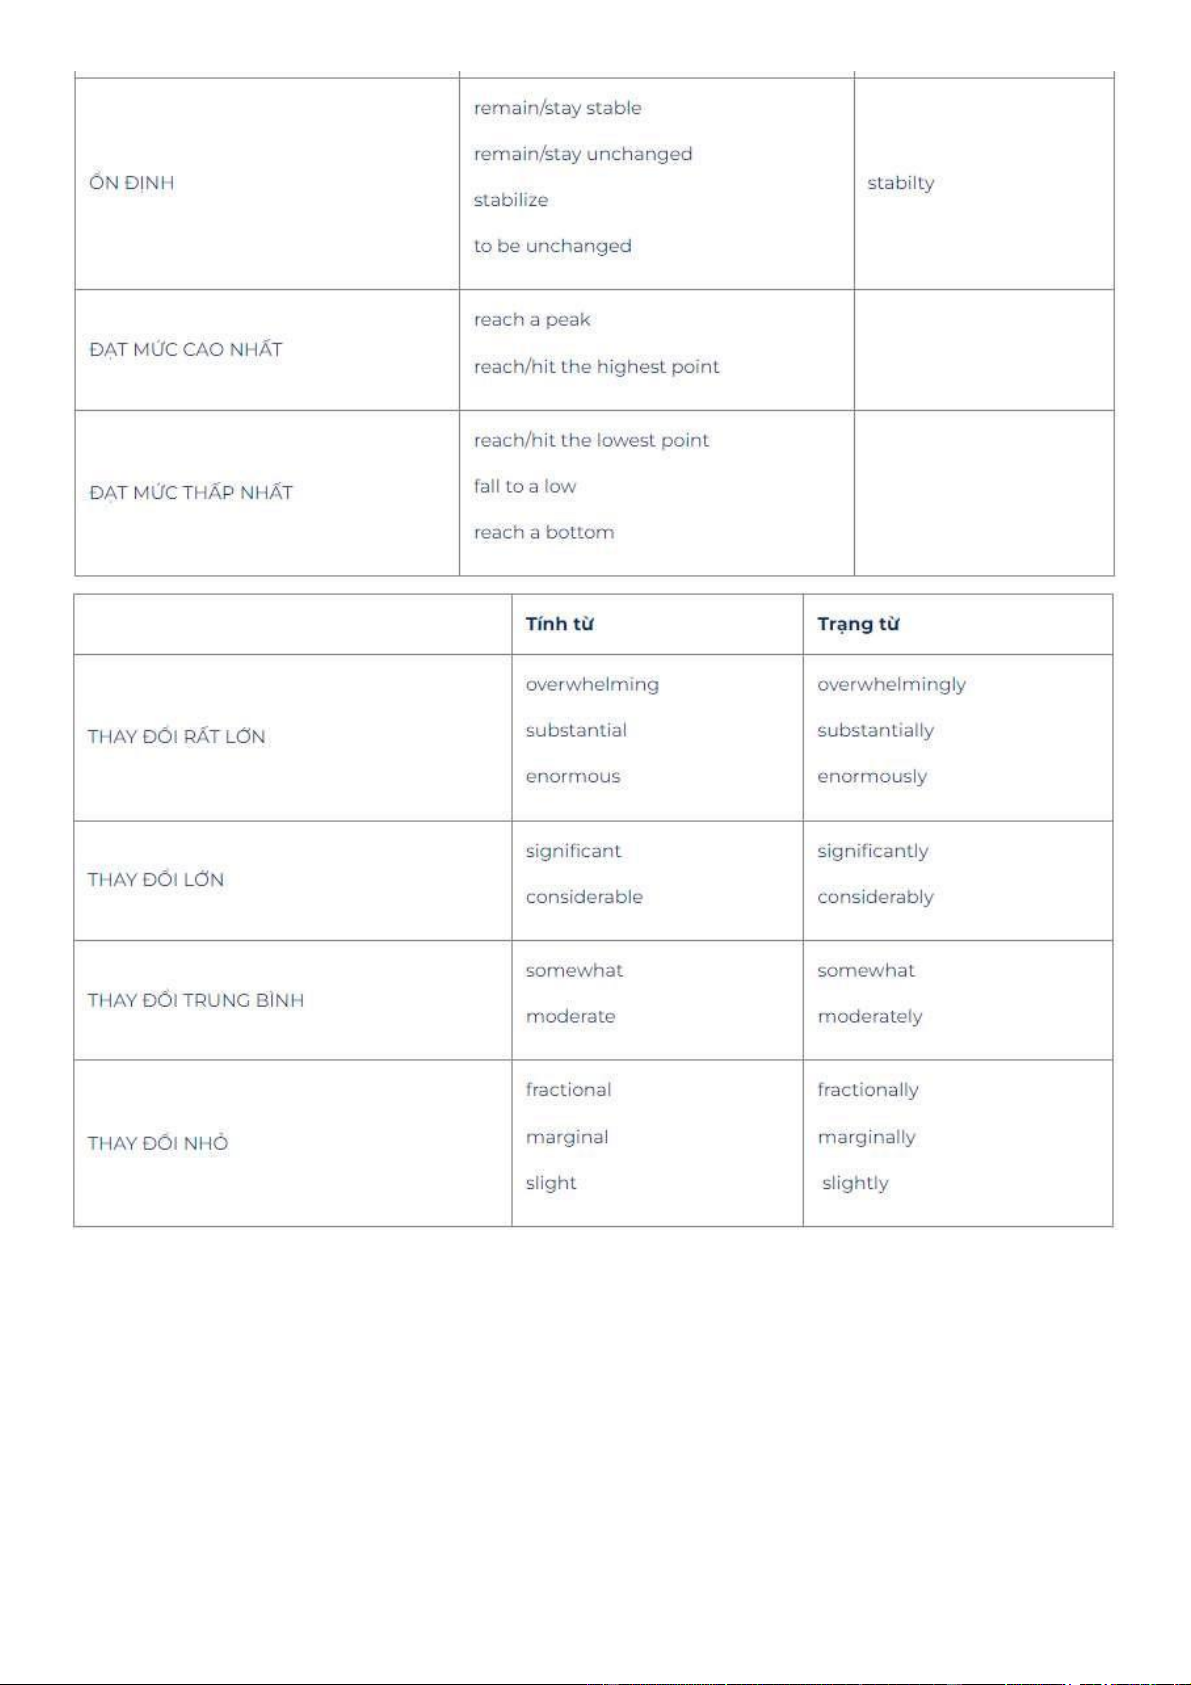
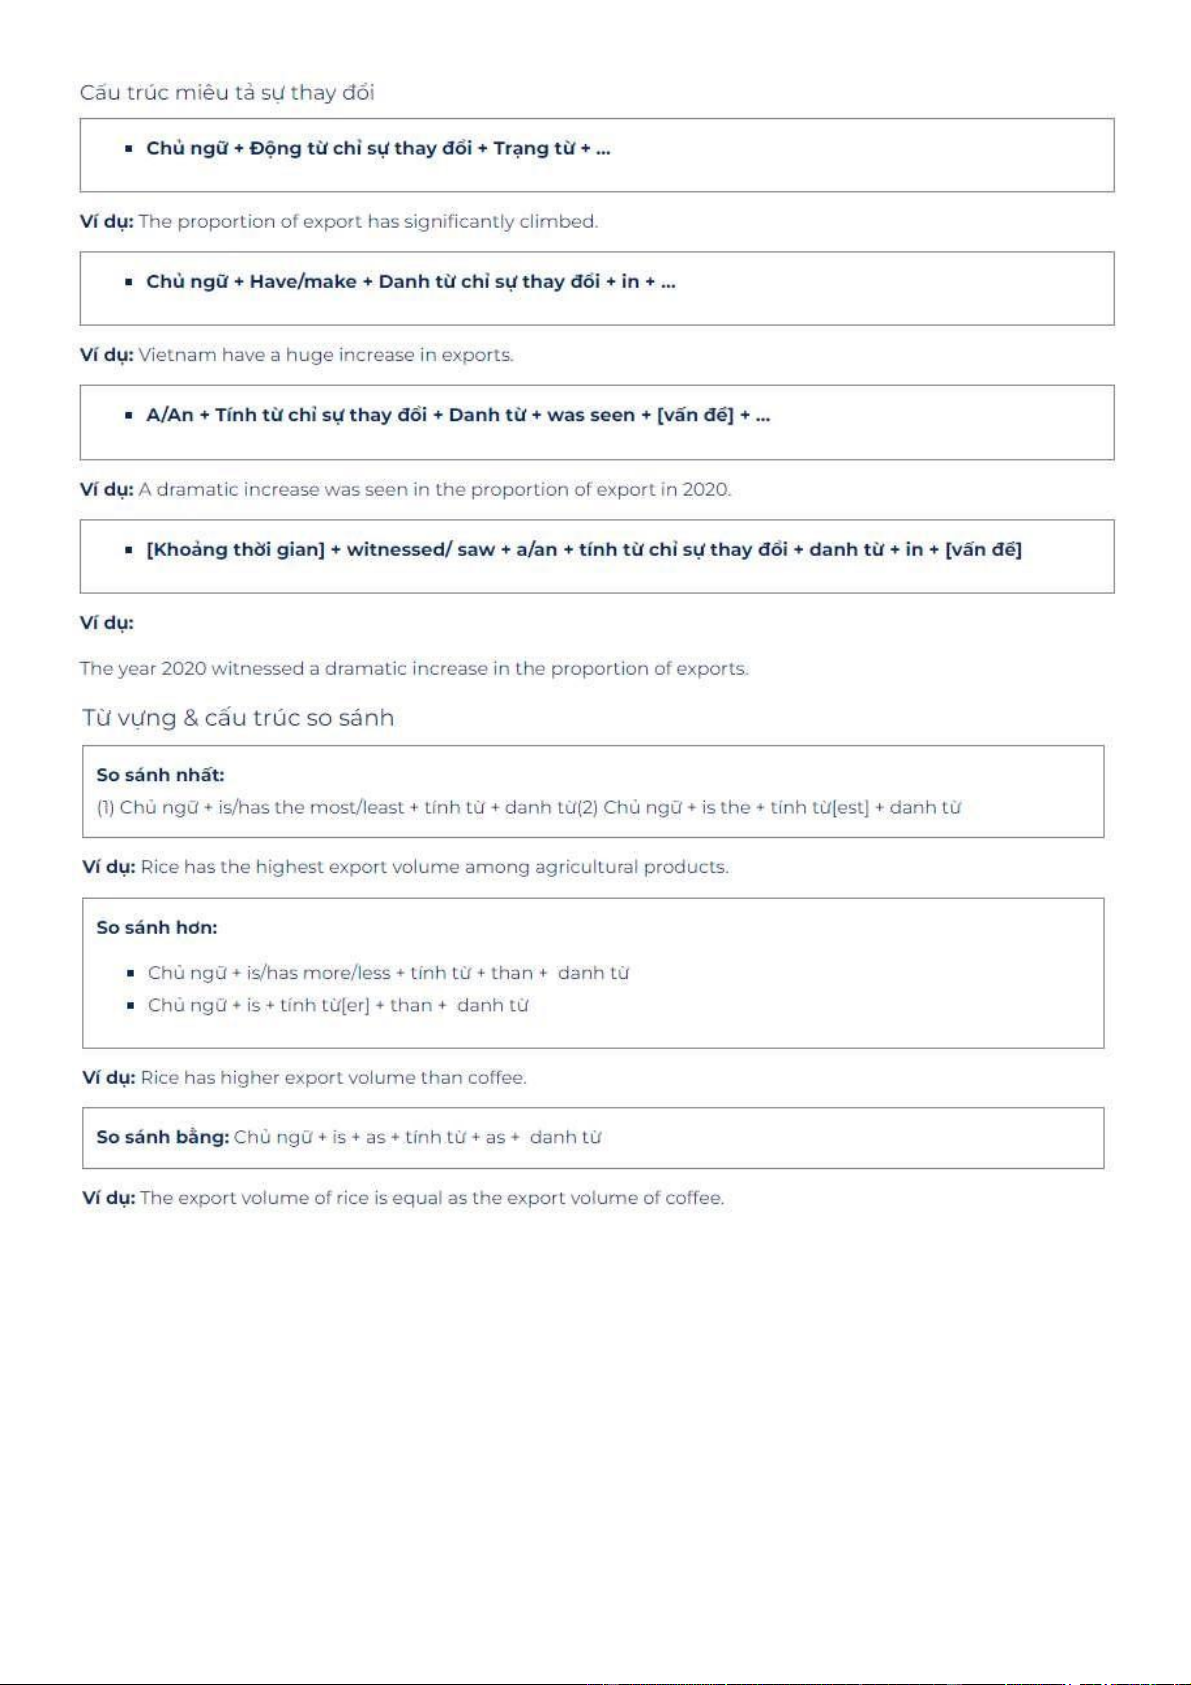
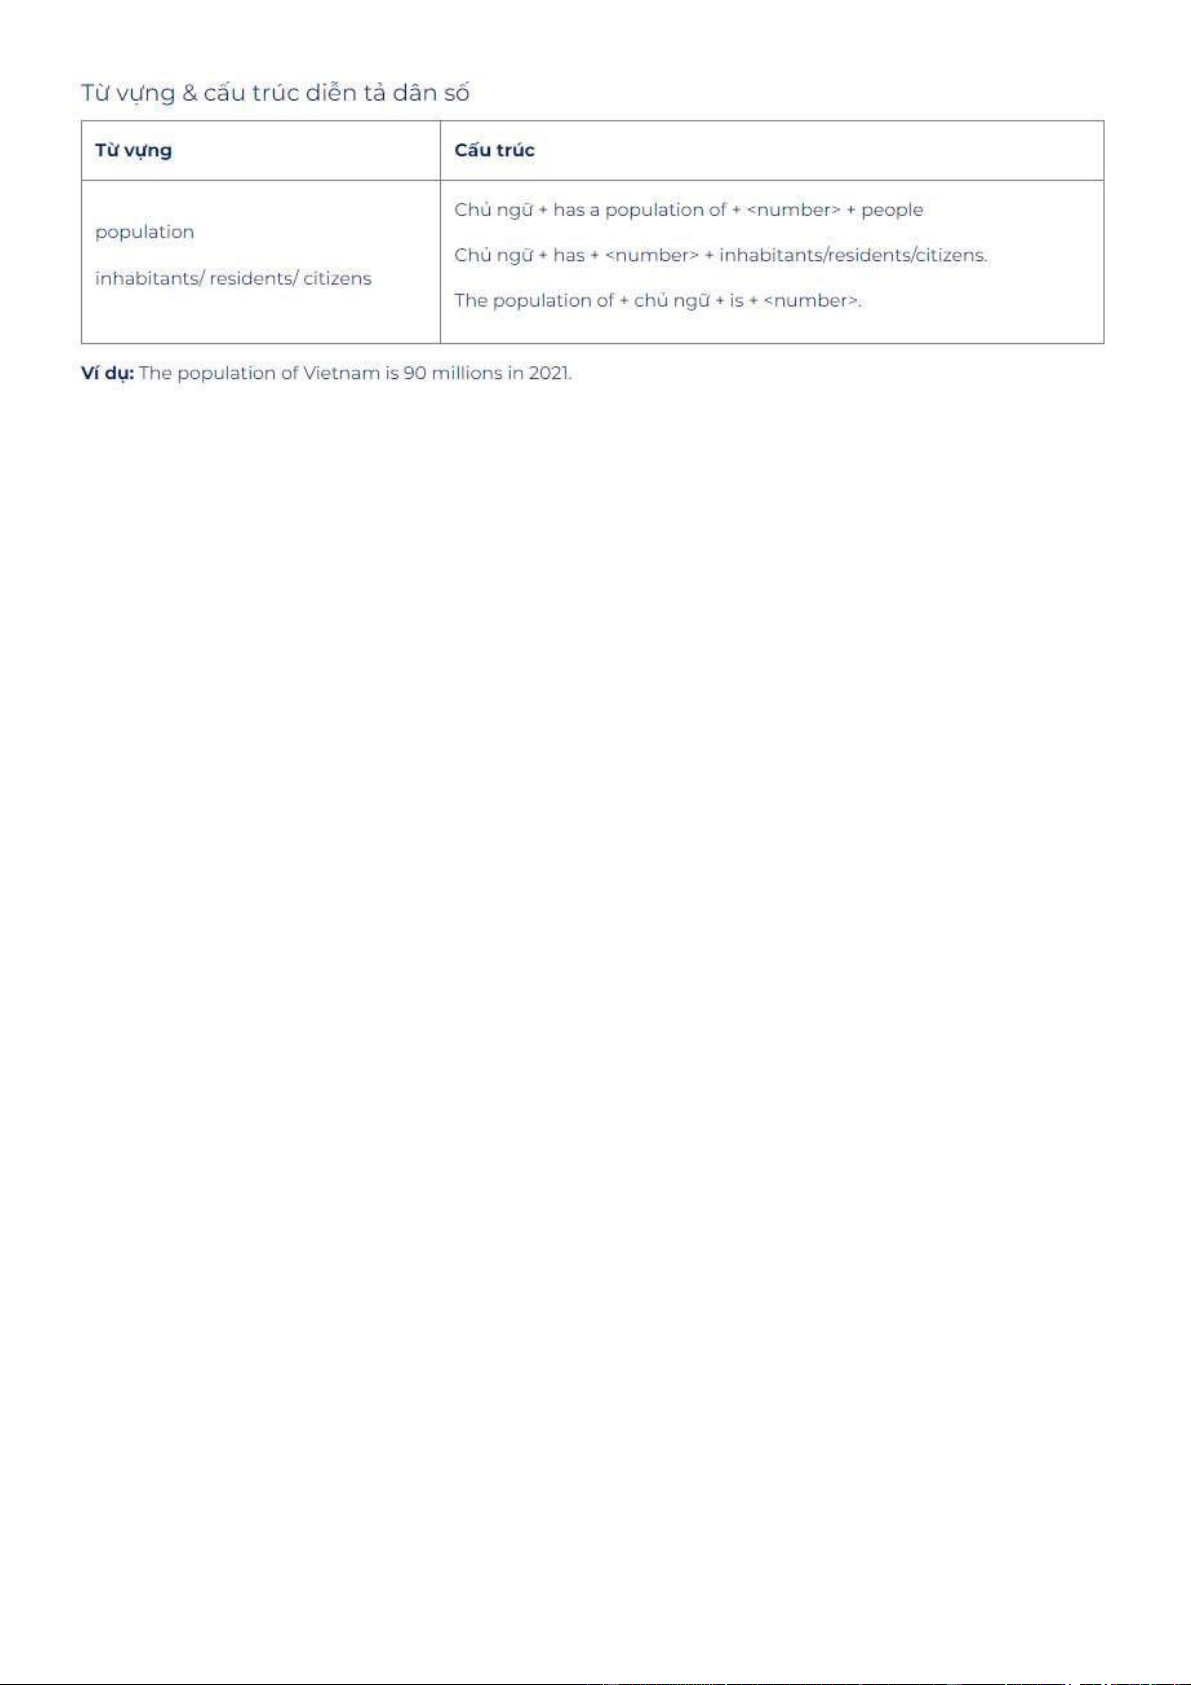
CÁC MẪU PHÂN TÍCH BIỂU ĐỒ
1.1 Dạng bài Writing Task 1 Line graph
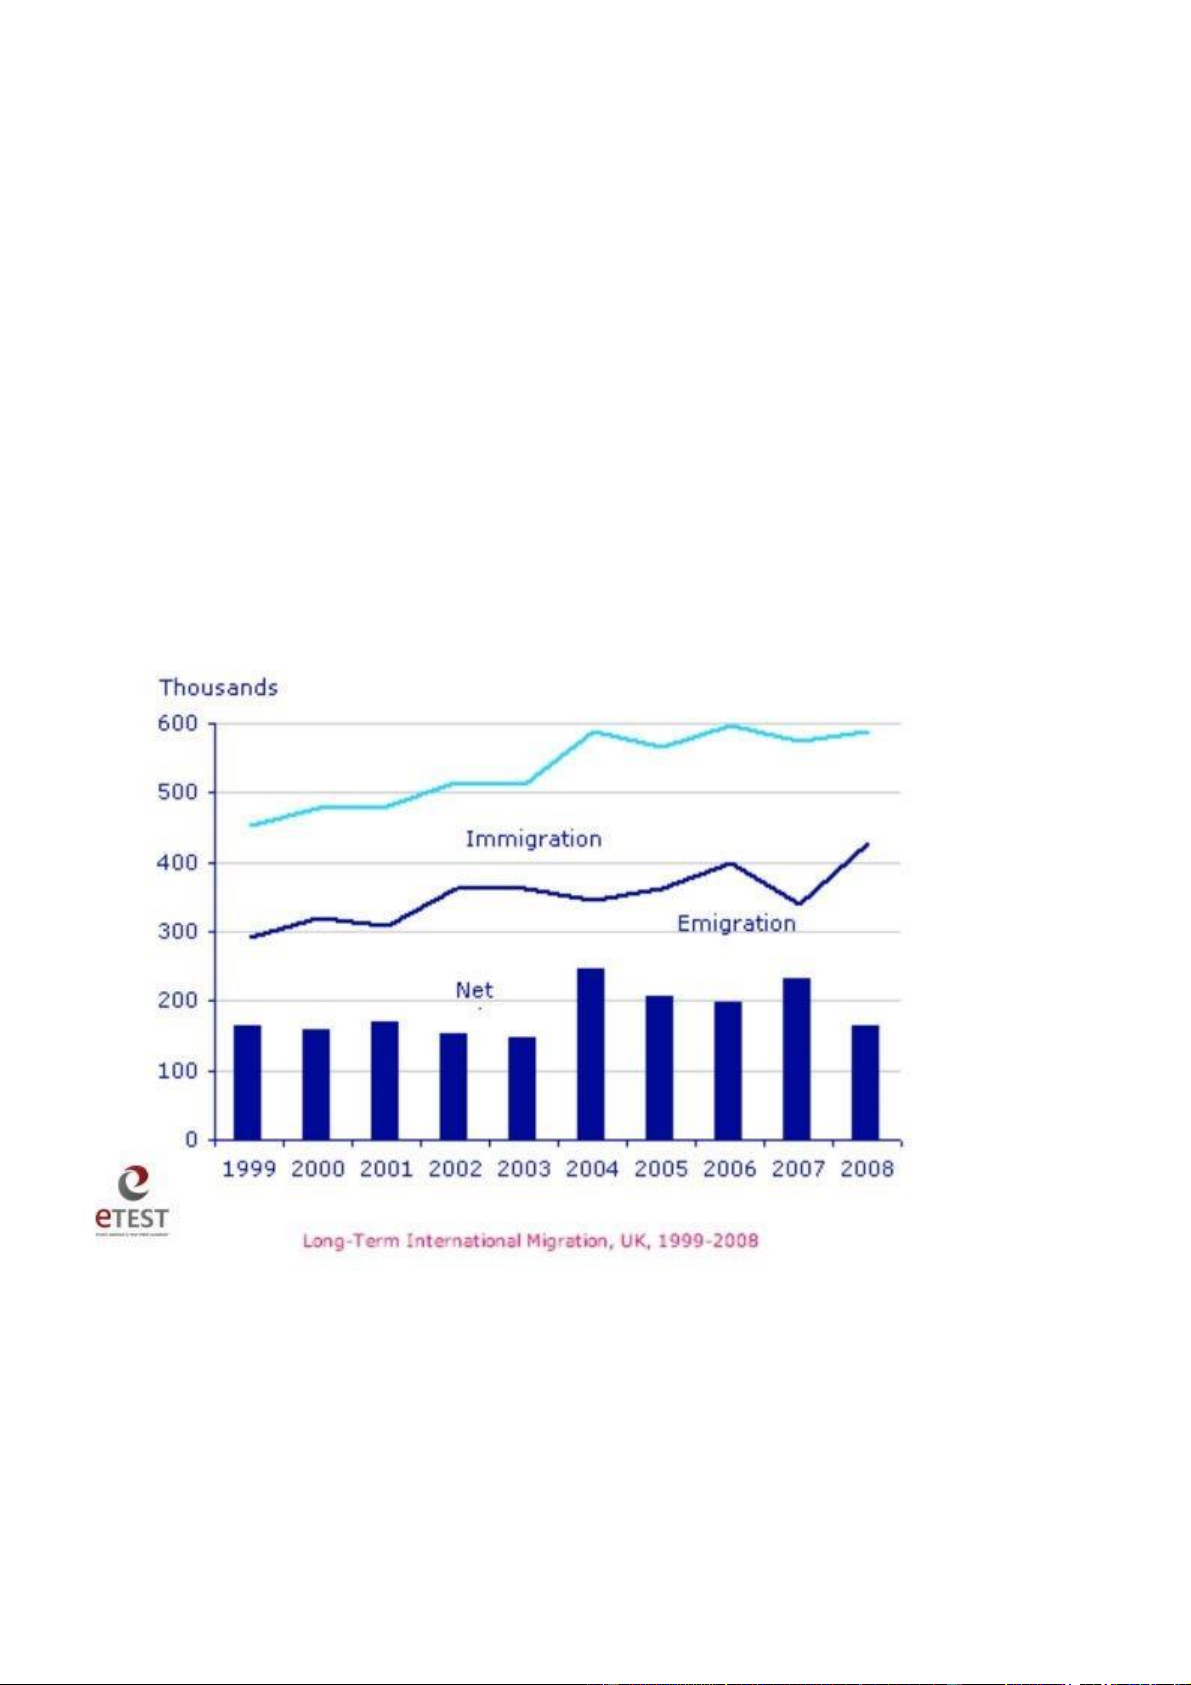
The chart gives information about UK immigration, emigration and net migration between 1999 and 2008.
Both immigration and emigration rates rose over the period shown, but the figures for
immigration were significantly higher. Net migration peaked in 2004 and 2007.
In 1999, over 450,000 people came to live in the UK, while the number of people who
emigrated stood at just under 300,000. The figure for net migration was around 160,000, and
it remained at a similar level until 2003. From 1999 to 2004, the immigration rate rose by
nearly 150,000 people, but there was a much smaller rise in emigration. Net migration
peaked at almost 250,000 people in 2004.
After 2004, the rate of immigration remained high, but the number of people emigrating
fluctuated. Emigration fell suddenly in 2007, before peaking at about 420,000 people in
2008. As a result, the net migration figure rose to around 240,000 in 2007, but fell back to around 160,000 in 2008.
Đây là dạng bài có các thông số biến đổi theo thời gian. Vì vậy, bạn nên lưu ý điều gì khi viết
dạng bài này? Một số mẹo giúp bạn triển khai ý tưởng và trình bày các luận điểm, luận cứ rõ ràng hơn bao gồm:
• Triển khai bố cục bài thành 4 đoạn văn, bao gồm giới thiệu chủ đề, tóm tắt luận
điểm và viết hai đoạn để triển khai luận điểm.
• Đoạn văn tóm tắt cần thể hiện cái nhìn tổng quát vấn đề, cụ thể là sự thay đổi chung
của biểu đồ. Ví dụ như, thời điểm bắt đầu và kết thúc của các đường trên biểu đồ,
xu hướng thay đổi chung của nó như thế nào,… lOMoAR cPSD| 45688262
• Với phần này, bạn chỉ cần mô tả chung, thể hiện sự so sánh giữa các đường, không
cần tập trung vào chi tiết: overall changes, highest, lowest,….
• Đoạn triển khai cần mô tả rõ ràng sự thay đổi các đường và các thông số như năm,
số lượng cụ thể, thay đổi, dao động bao nhiêu,…
• Nên sử dụng thì quá khứ đơn với những năm đã qua và thì tương lai đơn để mô tả
diễn biến thay đổi của chúng trong tương lai.
• Không nên dùng câu bị động, thì hiện tại tiếp diễn và thì quá khứ hoàn thành vì
tránh tạo câu đa nghĩa, gây ra sự mơ hồ cho giám khảo.
1.2 Dạng bài Writing Task 1 Bar chart
Dưới đây là bài mẫu với chủ đề “Levels of participation” cho dạng Writing Bar chart. Các bạn hãy tham khảo nhé.
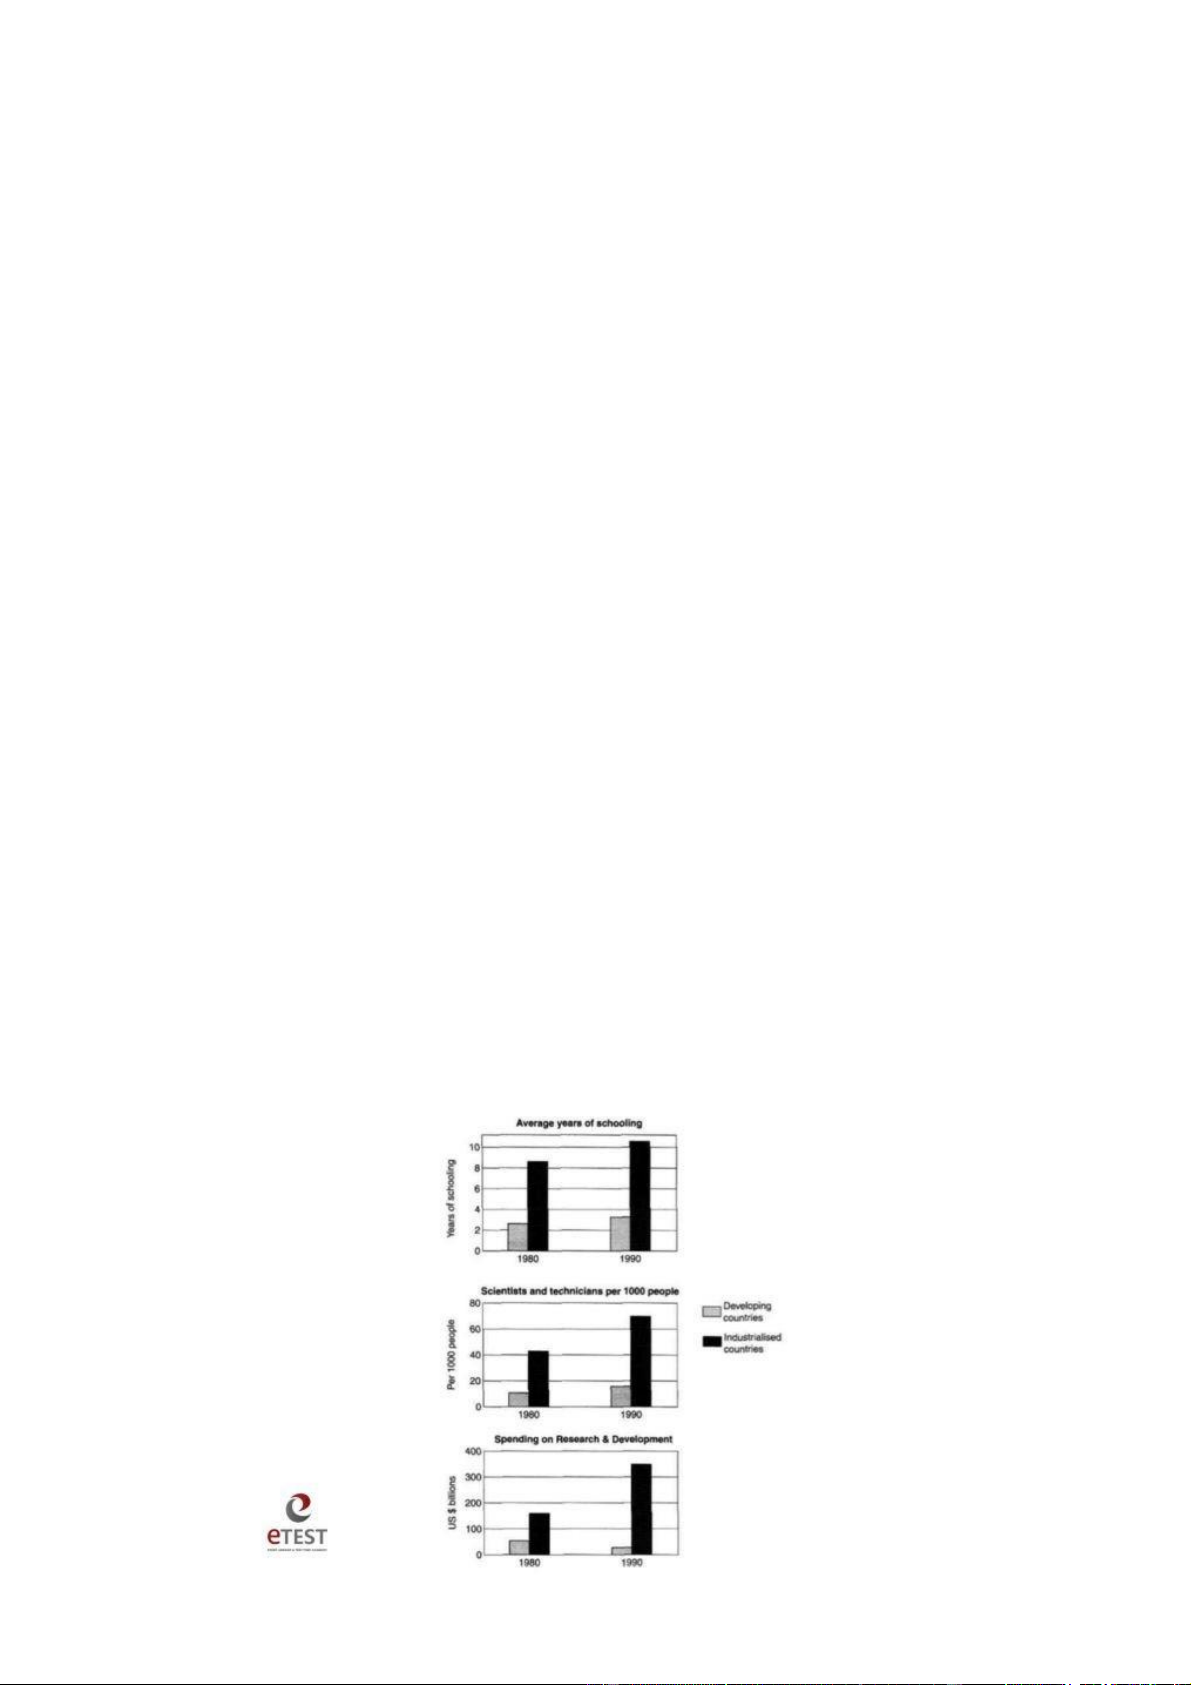
The three bar charts show average years of schooling, numbers of scientists and technicians,
and research and development spending in developing and developed countries. Figures are given for 1980 and 1990.
It is clear from the charts that the figures for developed countries are much higher than those
for developing nations. Also, the charts show an overall increase in participation in education
and science from 1980 to 1990.
People in developing nations attended school for an average of around 3 years, with only a
slight increase in years of schooling from 1980 to 1990. On the other hand, the figure for
industrialized countries rose from nearly 9 years of schooling in 1980 to nearly 11 years in 1990.
From 1980 to 1990, the number of scientists and technicians in industrialized countries
almost doubled to about 70 per 1000 people. Spending on research and development also
saw rapid growth in these countries, reaching $350 billion in 1990. By contrast, the number
of science workers in developing countries remained below 20 per 1000 people, and research
spending fell from about $50 billion to only $25 billion. lOMoAR cPSD| 45688262
1.3 Dạng bài Writing Task 1 Table
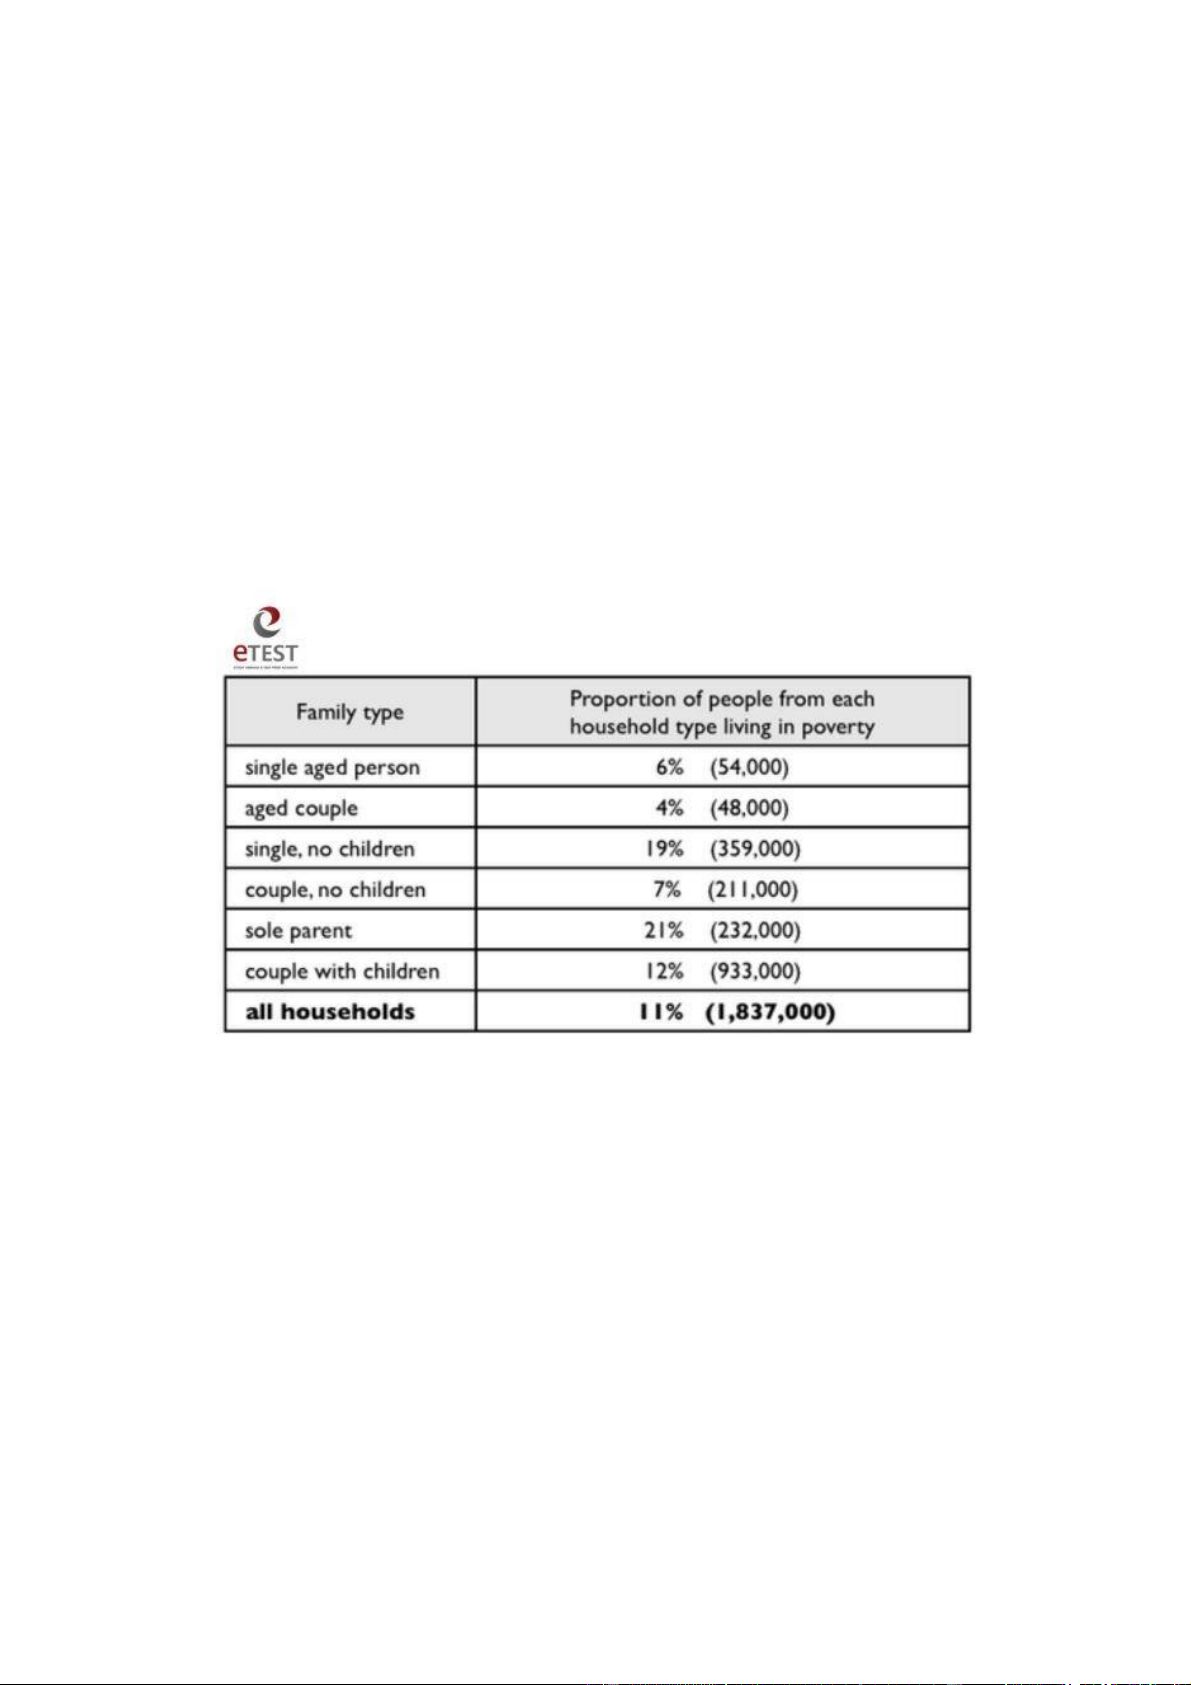
The table gives information about poverty rates among six types of household in Australia in the year 1999.
It is noticeable that levels of poverty were higher for single people than for couples, and
people with children were more likely to be poor than those without. Poverty rates were
considerably lower among elderly people.
Overall, 11% of Australians, or 1,837,000 people, were living in poverty in 1999. Aged
people were the least likely to be poor, with poverty levels of 6% and 4% for single aged
people and aged couples respectively.
Just over one fifth of single parents were living in poverty, whereas only 12% of parents
living with a partner were classed as poor. The same pattern can be seen for people with no
children: while 19% of single people in this group were living below the poverty line, the
figure for couples was much lower, at only 7%.
Với dạng Table, ETEST chia sẻ một số mẹo làm bài cho bạn như sau:
• Triển khai bài viết thành 4 đoạn văn như hai dạng trước.
• Đọc kỹ đề và đánh dấu hoặc gạch chân những con số quan trọng (lớn nhất, bé nhất
trong đầu mục của bảng) theo cột, hàng. Nếu bảng mô tả số liệu trong năm, bạn hãy
đánh dấu những khoảng thời gian có số liệu thay đổi lớn nhất giữa các năm
• Khi viết đoạn văn tóm tắt, nên thể hiện sự so sánh trong cột hoặc hàng thay vì so
sánh các ô riêng lẻ trong bảng. Nếu thông số và đối tượng quá nhiều, bạn hãy so
sánh số lớn nhất và số nhỏ nhất và thể hiện phần so sánh này trong 2 câu.
• Triển khai đoạn chi tiết bằng cách mô tả sự hoặc so sánh các keyword đánh dấu.
Bạn nên sử dụng ít nhất 3 số liệu và và thông tin trong mỗi đoạn.
• Dùng thì quá khứ đơn để mô tả số liệu năm cũ và thì tương lai đơn để dự đoán số
liệu các năm sau. Nếu không có thời gian cụ thể, sử dụng thì hiện tại đơn. lOMoAR cPSD| 45688262
1.4 Dạng bài Writing Task 1 Pie chart
Dạng Pie chart là dạng tương tự và có cách làm tương tự với Table, vì vậy bạn có thể triển
khai tương tự. Bài mẫu về “The amount of electricity produced” dưới đây là một ví dụ.
The pie charts compare the amount of electricity produced using five different sources of fuel
in two countries over two separate years.
Total electricity production increased dramatically from 1980 to 2000 in both Australia and
France. While the totals for both countries were similar, there were big differences in the fuel sources used.
Coal was used to produce 50 of the total 100 units of electricity in Australia in 1980, rising to
130 out of 170 units in 2000. By contrast, nuclear power became the most important fuel
source in France in 2000, producing almost 75% of the country’s electricity.
Australia depended on hydropower for just under 25% of its electricity in both years, but the
amount of electricity produced using this type of power fell from 5 to only 2 units in France.
Oil, on the other hand, remained a relatively important fuel source in France, but its use
declined in Australia. Both countries relied on natural gas for electricity production
significantly more in 1980 than in 2000.
The amount of electricity produced using five different sources of fuel lOMoAR cPSD| 45688262 lOMoAR cPSD| 45688262 lOMoAR cPSD| 45688262 lOMoAR cPSD| 45688262
Tài liệu liên quan:
-
Trắc Nghiệm Chương 2: Cung Cầu và Thị Trường | Bài tập kinh tế vi mô
13 7 -
Trắc Nghiệm Chương 1 - Kinh Tế Học và Nền Kinh Tế | Bài tập kinh tế vi mô
11 6 -
Phân Tích Tập Đoàn Thiên Long và Thị Trường | Bài tập kinh tế vi mô
21 11 -
Trắc nghiệm Kinh tế Vi mô | Trường Đại học Kinh Tế - Luật, Đại học Quốc gia Thành phố Hồ Chí Minh
15 8 -
Ôn Tập, Đáp Án Đề Thi Kinh Tế Vi Mô Giữa Kỳ | Trường Đại học Kinh Tế - Luật, Đại học Quốc gia Thành phố Hồ Chí Minh
16 8