Pin fin-PCM composite heat sink solution for thermal management of cylindrical Li-ion battery
Pin fin-PCM composite heat sink solution for thermal management of cylindrical Li-ion battery. Tài liệu được sưu tầm giúp bạn tham khảo, ôn tập và đạt kết quả cao. Mời bạn đọc đón xem.
Môn: Tài liệu Tổng hợp 3.6 K tài liệu
Trường: Tài liệu khác 3.9 K tài liệu
Tác giả:


Preview text:
Applied Thermal Engineering 248 (2024) 123146
Contents lists available at ScienceDirect Applied Thermal Engineering
journal homepage: www.elsevier.com/locate/ate Research Paper
Pin fin-PCM composite heat sink solution for thermal management of cylindrical Li-ion battery
Rajesh Akula, Abhiram Minnikanti, C. Balaji ∗,1
Heat Transfer and Thermal Power Laboratory, Department of Mechanical Engineering, Indian Institute of Technology Madras (IIT Madras), Chennai 600036, India A R T I C L E I N F O A B S T R A C T Keywords:
Phase Change Material (PCM) based heat sink is a state-of-the-art cooling technique for the effective thermal Phase change material
management of Lithium-ion batteries (LIBs). The low thermal conductivity of PCMs (<0.5 W∕m K) adversely Pin fins
affects their cooling performance. Fins are the most commonly used structures in augmentation with PCMs to Battery thermal management
enhance their effective thermal conductivity. All the studies on the thermal management of LIBs using PCM-fin Passive cooling
composites are confined to plate fins. Pin fins are very popular in electronic cooling and latent heat thermal Li-ion battery
energy storage, as they distribute heat uniformly into the PCM. In consideration of the above, the present study Electric vehicles Enthalpy-porosity approach
introduces pin fins into the thermal management of 18650 LIBs. Initially, the temperature regulation capability
of the paraffin based heat sinks with plate and pin fins, which have the same volume fraction of 2.4%, are
numerically investigated using commercially available ANSYS Fluent software. Preliminary results confirmed
that the pin fins outperform plate fins by recording a 3.3 ◦C lower average battery surface temperature for
a 5C discharge rate. The thermal performance of the pin fins is further investigated numerically for various
pin fin numbers (130, 200, 260, and 390), pin fin sizes (1, 1.4, 2, 3, 3.5, and 4 mm), heat loads (3, 4, and
5C discharges), ambient conditions (15, 25, and 35 ◦C), and PCMs (Eicosane, Paraffin wax, and Tetracosane).
Among multiple pin fin-based heat sink configurations, a heat sink with 260 pin fins of side 1 mm is observed
to be the best heat sink from all the above characterizations considered. The numerical results of the pin fin
heat sink with 260 fins are further validated against in-house experiments within a 5% discrepancy. Finally,
an attempt also has been made to implement this best heat sink for thermal regulation of actual Panasonic
NCR18650BD battery with variable heat generation and proved its effectiveness in thermal management. 1. Introduction
reduces the life span, and sometimes may leads to thermal runaway.
In addition, the cost of battery packs holds a major share in the cost
Global climate change and air pollution have been a cause of
of any EV. Therefore, it is important to focus on an effective ther-
concern in recent years. The Internal Combustion Engine (ICE) vehicles
mal management system that keeps the battery under safe operating
have been replaced with Electric Vehicles (EV) and Hybrid Electric temperatures [6].
Vehicles (HEV) to reduce greenhouse gas emissions and dependence on
Various thermal management techniques proposed in the literature
fossil fuels [1]. The HEVs/EVs are powered by hundreds of Lithium-
can be categorized into active and passive groups. In active cool-
ion batteries (LIBs) connected in series or parallel [2]. The vivid
implication of LIBs in EVs/HEVs are due to their high specific energy,
ing, a device that works on external energy is required to dissipate
long cycle life, and low auto-discharge features over other battery
heat from the LIBs to the ambient. Sending forced air using blowers,
chemistries [3]. However, the performance of the LIBs degrades with
forced liquid using pumps, and devices like thermoelectric coolers
an increase in their operating temperatures. The operating temperature
are examples of active cooling techniques [7,8]. In passive cooling,
of the LIBs is always on the rise under normal ambient conditions,
the generated heat is transferred by a natural phenomenon such as
as they generate heat during their charge/discharge operations due to
conduction, convection, and radiation. Heat spreaders, Phase Change
chemical reactions, charge transfer, and internal ohmic resistances. The
Material (PCM) based heat sinks, and heat pipes are examples in this
maximum operating temperature of LIBs is identified to be 60 ◦C from
passive cooling category [9]. Active cooling techniques are usually
the perspective of thermal safety and chemical efficiency [4,5]. The op-
more effective and capable than their counterparts in dissipating large
erating temperature above this limit degrades the battery performance, ∗ Corresponding author.
E-mail address: balaji@iitm.ac.in (C. Balaji). 1 Professor at IIT Madras.
https://doi.org/10.1016/j.applthermaleng.2024.123146
Received 4 October 2023; Received in revised form 12 March 2024; Accepted 7 April 2024 Available online 16 April 2024
1359-4311/© 2024 Elsevier Ltd. All rights reserved. R. Akula et al.
Applied Thermal Engineering 248 (2024) 123146 Nomenclature Subscripts 𝐴, 𝐵, 𝐶
Specific thermal resistance at melting point 𝐴𝑙 Aluminum temperature, K cm2∕W 𝑎𝑚𝑏 Ambient
𝐴 ∗, 𝐵 ∗, 𝐶 ∗
Specific thermal resistance at melt front 𝑏𝑎𝑡 Battery detach point, K cm2∕W 𝐶𝑢 Copper
𝐴′, 𝐵′, 𝐶′
Specific thermal resistance at thermal con- 𝑓 𝑖𝑛 Fin trol point, K cm2∕W ℎ𝑜𝑢 Housing 𝐴𝑚𝑢𝑠ℎ𝑦 Mushy zone constant, kg∕m3 s 𝑖 Tensor index 𝐴𝑏
Surface area of the battery, m2 𝑟𝑒𝑓 Reference state 𝐶 Specific heat, J∕kg K Acronyms ⃖⃗ 𝑔
Acceleration due to gravity, 9.81 m∕s2 ℎ
Total specific enthalpy, J∕kg C-rate
Charge/discharge current per nominal bat- ℎ𝑠 Sensible enthalpy, J∕kg tery capacity ℎ𝑙
Total latent heat content in body, J∕kg DAQ Data Acquisition ℎ0
Overall heat loss coefficient, W∕m2 K ED Energy Density 𝐼 current, A EDC Electric Density per Cost 𝑘 Thermal conductivity, W∕m K EV Electric Vehicles 𝐿 Latent heat of the PCM, J∕kg HEV Hybrid Electric Vehicles 𝑙 Fin height, mm ICE Internal Combustion Engine 𝑃 Power, P LIB Lithium ion batteries 𝑝 Pressure, N∕m2 PCM Phase Change Material 𝑞 Heat generation, W PRESTO PREssure STaggering Option 𝑞′
Volumetric heat generation, W∕m3 SIMPLE
Semi-Implicit Method for Pressure Linked ⃖⃖⃗ 𝑆 Source term, N∕m3 Equations 𝑡 Time, s SPT Set Point Temperature 𝑇 Temperature, ◦C TCE Thermal Conductivity Enhancer 𝑇𝑎 Ambient temperature, ◦C 𝑇𝐶
Temperature of battery at thermal control point, ◦C
cooling systems due to their advantages: lighter weight, simple design, 𝑇𝑚
Melting temperature of the PCM, ◦C
reliability, less prone to failure, and environmentally friendly [12,13].
𝑇𝑠𝑜𝑙𝑖𝑑𝑢𝑠
Solidus temperature of the PCM, ◦C
C-rate is the measure of current being used to charge or discharge
𝑇𝑙𝑖𝑞𝑢𝑖𝑑𝑢𝑠
Liquidus temperature of the PCM, ◦C
LIBs. The motors of EVs require more power during vehicle accelera- 𝑉 Voltage, V
tion. As a result, the batteries are discharged at higher C-rates (typically 𝑉𝑛 Nominal voltage, V
more than 2C). Whereas, the C-rates used for charging the vehicle are 𝑣 Volume, mm3
intentionally kept low to eliminate the adverse effects such as lithium 𝑣𝑡 Total volume, mm3
plating and capacity fading [14]. The amount of heat generation from ⃖⃗ 𝑣 Superficial velocity, m∕s
LIBs is proportional to the C-rate of charge or discharge [15]. In ⃖⃗ 𝑣
view of high discharge rates and low charge rates, the typical battery
𝑙𝑖𝑞𝑢𝑖𝑑
Liquid velocity of the PCM, m∕s 𝑉
thermal cycle consists of a heat generation phase for a shorter duration 𝑃 𝐶𝑀 Volume of the PCM, m3
(discharging phase) followed by a rest phase (charging phase) for a 𝑤 Fin width, mm
longer duration [16]. Since passive cooling techniques perfectly handle 𝑟, 𝜃, 𝑧 Radial coordinates
cyclic heat loads of moderate magnitudes, they can also be the best Greek letters
choice for the thermal management of LIBs. Many studies in literature
reported the potential use of passive cooling techniques for thermal 𝛼 Ratio of heat transfer area
management of LIBs [17–19]. Out of various passive cooling techniques 𝛾 Liquid fraction
available, solid–liquid Phase Change Material (PCM) based heat sinks 𝛥𝑇
Maximum temperature difference on the
are receiving the utmost attention from researchers all over the world battery surface, ◦C
due to their noteworthy characteristics, including high thermal energy 𝜇 Viscosity, Pa s
storage density, enhanced temperature uniformity, low cost, and stable 𝜌 Density, kg∕m3 chemical properties [20,21]. 𝜎 Uncertainty
Despite multiple advantages offered by the PCM, lower thermal 𝜙 Volume fraction of fins
conductivity of the PCM (typically <0.5 W∕m K) confines its vivid im-
plications in the battery thermal management systems. Lower thermal
conductivities offered by PCMs in heat sinks do not allow complete
exploitation of available latent heat, which makes cooling systems
amounts of heat into ambient [10]. However, disadvantages, including
inefficient and ineffective. Researchers have made considerable efforts
to discover several thermal conductivity enhancement techniques to
high cost, noise, maintenance, and external power requirements, hinder
overcome the drawback of lower thermal conductivities of PCMs [22,
their widespread applicability in various cooling requirements [11].
23]. One such method is suspending thermal conductive fillers into
Some Li-ion powered devices operate intermittently/cyclically, gener-
the PCM. This method was discussed by Samimi et al. [24], in which
ate moderate heat and do not require continuous assistance from the
carbon fibers are mixed with paraffin (a type of PCM), and reported
cooling system. In such cases, passive cooling systems dominate active
that the average thermal conductivity of PCM is enhanced by 105% 2 R. Akula et al.
Applied Thermal Engineering 248 (2024) 123146
and also proved that the thermal performance of mixture (PCM +
and PCM or water and PCM, also received greater advantage with
carbon fibers) surpassed air and pure PCM. Apart from adding fillers,
addition of fins in the PCM domain [42,43]. All these studies on PCM
saturating PCM into porous media, such as aluminum or copper foams,
based heat sinks for battery thermal management had used plate fins
can also effectively enhance the thermal conductivity [25] by creating
as the thermal conductivity enhancers to increase the effective thermal
thermal conductive paths. Khateeb et al. [26] proved that adding conductivity of the PCM.
aluminum foam to PCM in a PCM-based heat sink applied to a LIB
Though the usage of plate fins in PCM is effective, redesigning
module resulted in a temperature drop of 50%. In addition to the above-
them into pin fins may further enhance the thermal performance. It
mentioned Thermal Conductivity Enhancers (TCEs), finned structures
is noteworthy to mention here that the pin fins are the most effective
can also significantly improve the effective thermal conductivity of the
and common type of TCEs used in conjunction with PCM for electronic
PCM. Simple design, ease of fabrication, and enhanced heat transfer are
cooling and LHTES systems due to their superior performance over
the major features of the finned designs. Fins are predominantly used
other fin configurations whilst handling constant, cyclic, and surge heat
in various cooling techniques for thermal management of electronics,
loads [44]. Very few studies are available on application of pin-fin heat
automotive, and aerospace applications [27–30]; and also in energy
sinks for battery thermal management. Guo et al. [45] conducted three-
storage devices such as solar thermal storage systems, refrigeration
dimensional numerical studies on BTMS employing a mini-channel
systems, and cold storage systems to enhance heat transfer [31,32]. In
cold plate with pin fins. In their study, the performance of BTMS
the field of latent heat thermal energy storage (LHTES), many studies
is evaluated using Efficiency Index (𝐸𝐼) which considers both heat
concluded that the presence of fins spurred the rate of heat transfer
transfer performance and pressure loss. They found that the pin fins
into/away from the PCM and improved the thermal performance of
can improve the heat transfer performance of BTMS with acceptable LHTES systems [33,34].
pressure loss, i.e., 𝐸𝐼 > 1. The authors further added that the EI of
Despite having numerous applications for fin structures in various
vertically arranged pin fins was 4.54% higher than that of horizontally
fields of thermal management and thermal storage, their usage still
arranged pin fins. Mohammadian and Zhang [46] also worked on incor-
needs attention in the realm of thermal management of LIBs. In the
poration of pin fins with linear increment of height in the direction of
limited research available on PCM-fin composite heat sinks for thermal
coolant flow to enhance heat transfer. The effect of pin fin arrangement,
management of 18650 LIBs, the studies conducted by Wang et al.
discharge rates, inlet air flow velocities, and temperatures on battery
[35], Weng et al. [36], and Sun et al. [37] are significant. Wang
are investigated. There are a few more studies on the use of pin fins in
et al. [35] experimentally examined the thermal behavior of cylindrical
the BTMS, however, they too had discussed the designs for enhancing
heat transfer between pouch batteries and coolant [47] but not between
battery when it was inserted in paraffin-fin composite structure. They
the cylindrical batteries and the coolant. Akula and Balaji [15] were
concluded from the experimental results that the composite PCM-fin
one of the earliest in introducing pin fins for thermal regulation of
system had good thermal performance with prolonged work time.
cylindrical batteries for higher discharge rates. The authors considered
The authors further identified the logarithmic dependence of the time
three heat sinks with zero, 130, and 260 pin fins to investigate the effect
averaged Nusselt number with the heat transfer area. Weng et al. [36]
of pin fins on the temperature distribution over battery surface. From
conducted series of experiments on PCM based heat sink without and
the detailed experimental investigation, the authors concluded that the
with fins for thermal management of 18650 cylindrical Li-ion batteries
heat sink with 260 pin fins outperformed other heat sink configurations
to investigate the effects of fin configurations on the temperature
by recording 14.2, 17.6, and 19.1 ◦C lower temperatures compared to
evaluation under 1C/2C discharge rates. The authors proved from the
plain heat sink for discharge rates 2, 3, and 4C, respectively. However,
experimental investigations that increasing fin number beyond certain
the study had considered only three heat sinks to propose the best heat
limit does not yield any thermal advantage. From their study, they sink.
further identified that the optimum number of longitudinal fins were
Based on the detailed literature survey conducted on the BTMS, it is
four for the maximum thermal regulation in a limited-space mod-
clear that the effect of geometrical parameters associated with pin fins
ule. Zare et al. [38] also studied the effect of fin number in addition to
for thermal management of cylindrical LIBs using PCM based heat sinks
the other parameters including heat storage capacity, energy density,
have not been studied so far, either experimentally or numerically.
and heat storage capacity on thermal performance. From the detailed
The goal of this study is not only to address these gaps but also the
numerical investigations, the authors found that the BTMS with four
following shortcomings of the previous studies: impact of pin fin shape,
internal–external plate fins regulated the operating temperature of the
size, and number on the temporal evolution of temperature distribution
battery below 45 ◦C even at the ambient temperature of 35 ◦C, while
on LIBs, quantification of the influence of various PCMs and ambient
providing 32.81, 11.11, and 10.02% higher fin efficiency, heat storage
temperatures on the thermal regulation capability of pin fins, and
capacity, and energy density, respectively, compared to the BTMS
thermal performance comparison of pin fin based heat sinks proposed
without fins. Furthermore, Sun et al. [39] proposed novel fin structures
in the present study against literature for different heat loads generated
constituting straight and arc fins for heat transfer enhancement. From
by the LIBs operate at higher discharge rates.
their experimental investigations, they proved that the proposed fins
prolong the working time of the battery by 54%–90% compared to pure
2. Numerical methodology
PCM under various discharge conditions. Zhang et al. [40] introduced
different fin configurations including straight, cross, branch, T, I, V, and 2.1. Physical model
N-shape fins to enhance the effective thermal conductivity of the PCM
and compared their thermal performance against conventional straight
The main idea of the present study is to find the best pin fin
fins under 5C discharge rate. From the numerical investigations, they
configuration that reports the lowest average temperature and thermal
concluded that all the newly introduced fin configurations showed su-
gradients on the battery surface. Four heat sinks with 0, 2, and 4 plate
perior performance over conventional straight fins. The authors further
fins are initially considered. These heat sinks are geometrically in line
modified the new designs by changing transverse fin converge area
with the heat sinks considered by Wang et al. [35] in their experimental
and fin number to obtain the thermal regulation advantage of 3.14
study for thermal management of an 18650 Li-ion battery. Later, a
and 3.92 ◦C, respectively. Similarly, Weng et al. [41] also studied the
heat sink configuration employing 130 pin fins with the same volume
thermal performance of PCM based heat sinks with fins of shapes V,
fraction as 2 and 4 plate fins, is introduced. Following this, pin fins
Y, and X under ambient temperature of 40 ◦C and observed that the
with different fin sizes and fin numbers are also modeled and simulated
X-shaped fins delivered the best performance by regulating the battery
to identify the best heat sink configuration. All the numerical models
temperature below 47 ◦C. From the holistic perspective, the hybrid
in the present study are designed using the Design modular software
battery thermal management systems, which are combinations of air
available in commercial Ansys 2020R2. 3 R. Akula et al.
Applied Thermal Engineering 248 (2024) 123146
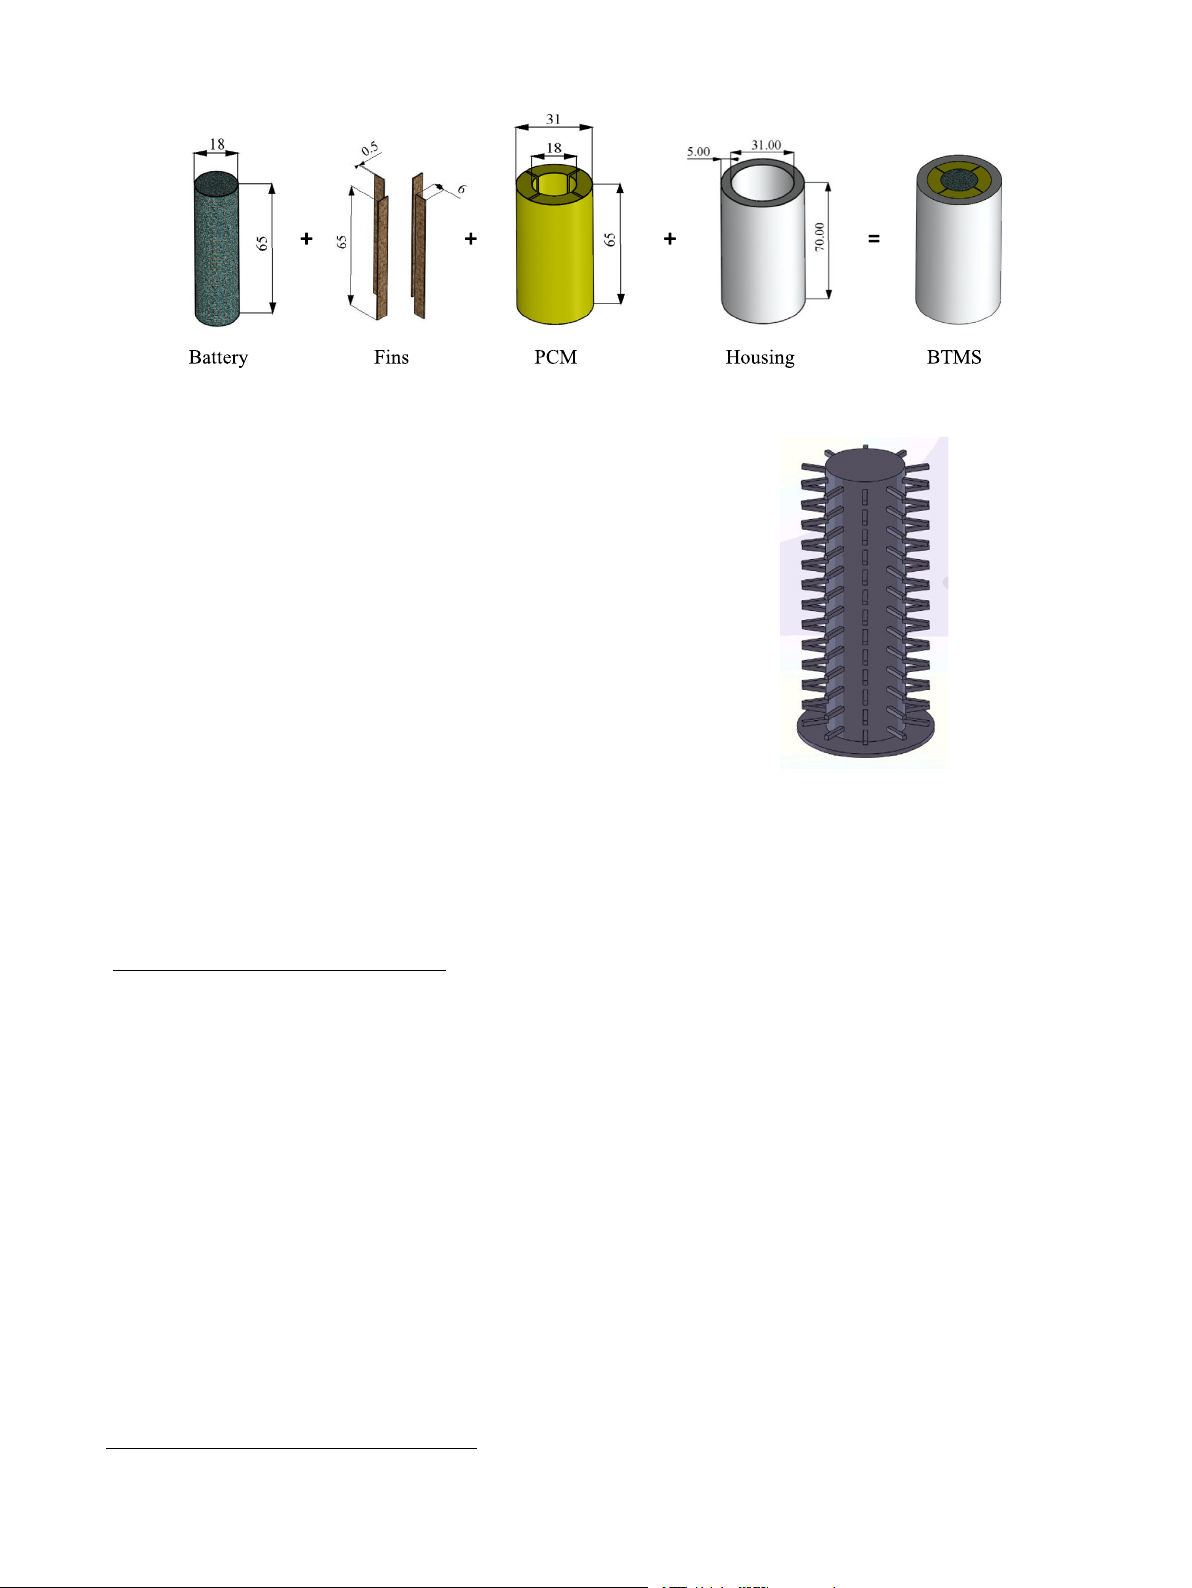
Fig. 1. Schematic representation of BTMS with four plate fins.
Heat sink configurations with plate fins
Three heat sinks, with zero, two, and four plate fins attached on
the outer periphery of the simulated battery, are considered in the
present study for preliminary investigations. In the case of heat sink
configuration with two plate fins, the fins on the battery surface are
separated by 180 degrees. Whereas, for heat sink configuration with
four plate fins, the fins are separated by 90 degrees. The arrangement
of BTMS in the present study is as follows: The 18650 simulated battery
is placed at the center surrounded by fins submerged in PCM. The outer
housing and heat sink base (5 mm thick) further confines the PCM in
the heat sink (see Fig. 1). All the plate fins, either in the case of heat
sink with two or four plate fins, have dimensions of length (or height)
and width equal to 65 and 6 mm, respectively. The thickness of each
fin is equal to 1 mm in the case of the heat sink with two plate fins,
whereas it is equal to 0.5 mm in the case of the heat sink with four plate
fins. Battery with the fins setup is placed in a housing with length, inner
diameter, and thickness are equal to 70, 31, and 5 mm, respectively.
Fig. 2. Schematic representation of base, and battery with 130 pin fins (each fin of
The gap between the battery with fins and the housing is filled with
size 1 mm) on its outer periphery.
PCM. The volume fraction of fins (𝜙) in the present study is defined as
the ratio of volume of fins to the combined volume of fins and PCM
(see Eq. (1)). As per the definition, the volume fraction of fins for the
Heat sink configurations with various pin fins
heat sinks with 2 and 4 plate fins is the same and equal to 2.4%.
To comprehensively evaluate the advantages offered by pin fins,
various heat sink configurations with different fin numbers and sizes
Volume fraction of fins(𝜙)
are considered. The dimensions and arrangement of the 130-pin fin
Volume of fins (𝑣𝑓𝑖𝑛) = (1)
heat sink, with each fin having a square cross-section of a side equal to
Volume of fins (𝑣𝑓𝑖𝑛) + Volume of PCM (𝑣𝑃 𝐶𝑀 )
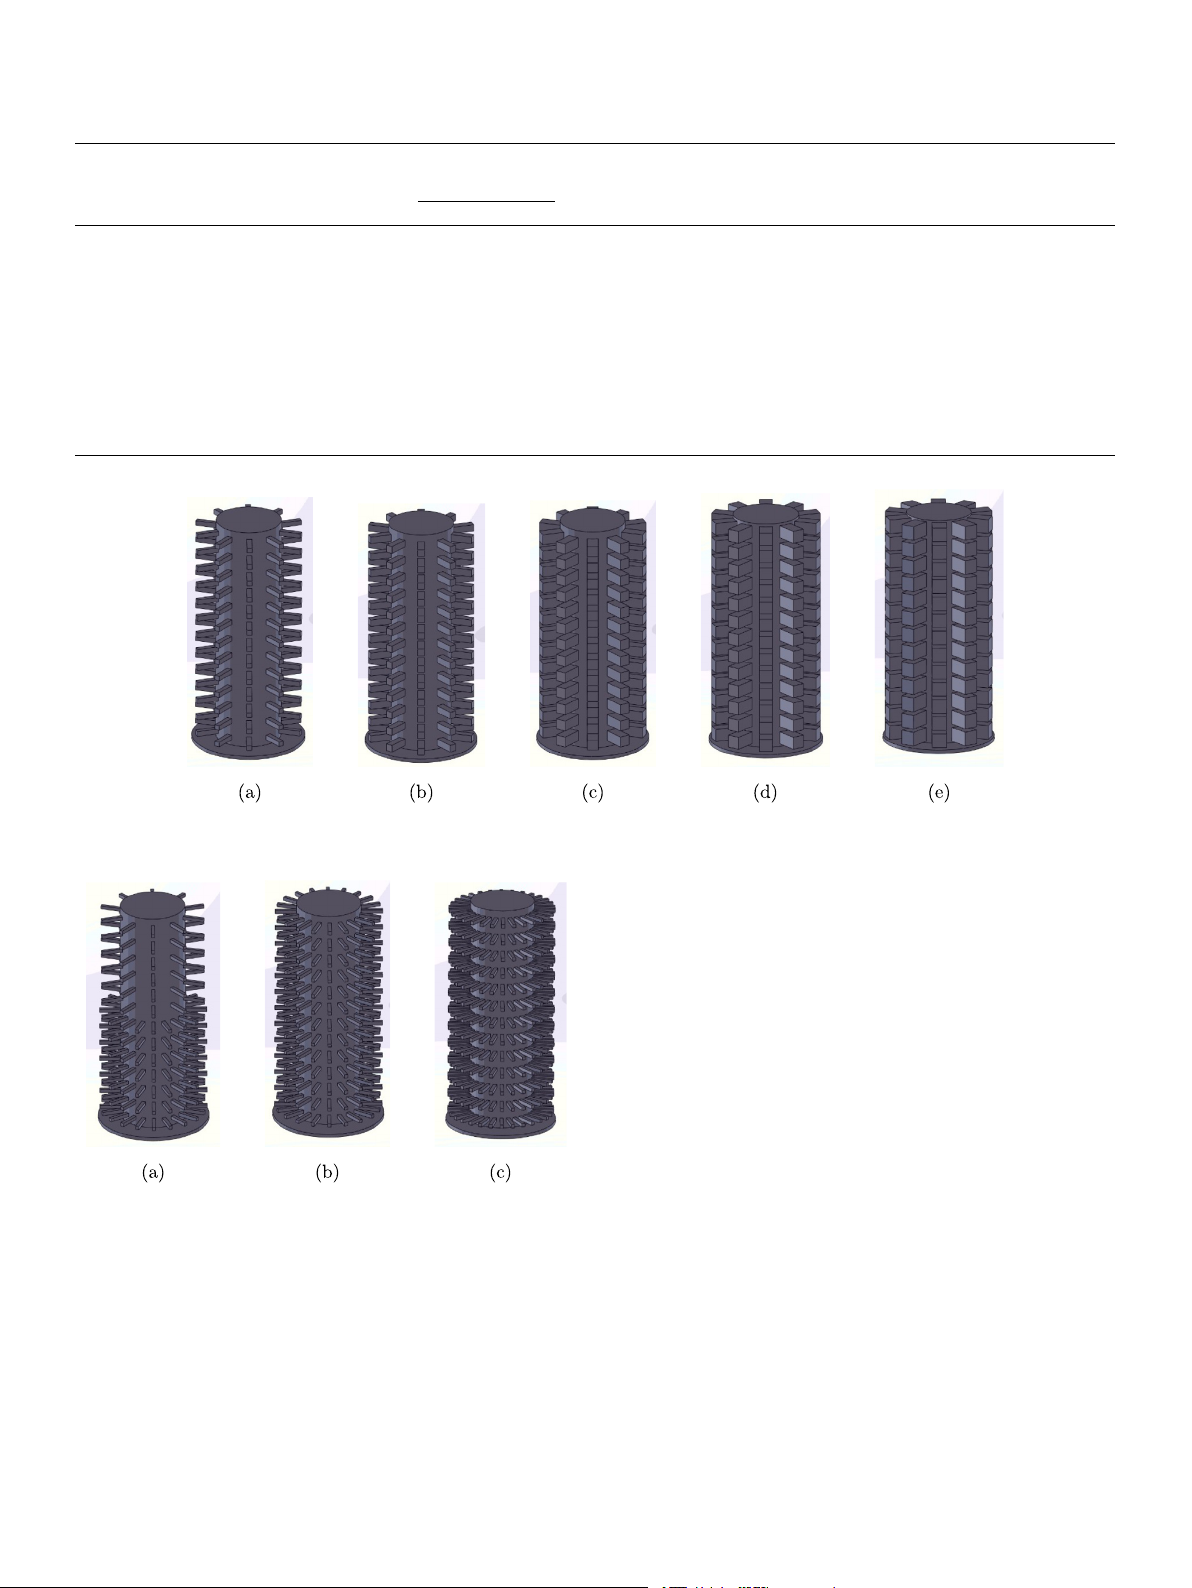
1 mm, are already discussed in the previous section. Further, five more
heat sinks, each has 130 fins with square cross-section, but with sides
equal to 1.4, 2, 3, 3.5, and 4 mm are modeled to identify the effect of
Heat sink configuration with 130 pin fins
fin size (see Fig. 3) on the thermal performance. The volume fractions
A heat sink employing 130 pin fins with the same volume fraction
of fins for these five heat sink configurations with fin sizes 1.4, 2, 3,
of 2.4% is modeled numerically, as shown in Fig. 2. All the designed
4.5, and 4 mm are calculated to be 4.7, 9.6, 21.6, 29.4, and 38.4%,
pin fins have a square cross-section, with side and length are equal to
respectively. In addition to these five heat sinks, three more heat sinks,
1 and 6 mm, respectively. A total of 13 fin sets, each containing ten
each with square fins of side 1 mm, but with different fin numbers
equally spaced pin fins along the circumference in the radially outward
equal to 200, 260, and 390 are also modeled as shown in Fig. 4. The fin
direction from the battery, are placed at equidistant positions (3.7 mm)
arrangement for heat sinks with 260 and 390 fins is the same as that
along the length of the battery. The simulated battery with 130 fins
with 130 fins, but the number of fins on each fin set is doubled and
is placed in the same PCM and housing with the same geometrical
tripled, respectively. The heat sink with 200 fins is a special case. In
dimensions considered for heat sinks with plate fins. The ratio of heat
this configuration, seven fin sets, with 20 fins in each set, are attached
transfer area (𝛼) is defined as the ratio of contact areas between battery
from the bottom of the battery, whereas six fin sets, with ten fins in
and PCM for with and without fins (see Eq. (2)). The contact area,
each set, are attached from the top. Each fin set is equally spaced along
between PCM and battery with fins, changes based on the fin size and
the battery length, as observed in other pin-fin configurations in this
number of fins. Whereas, the contact area between PCM and battery
study. The reason behind considering the heat sink configurations with
without fins is the same for all the fin configurations and the value is
this fin arrangement is as follows. Conduction and convection are the
equal to 3670 mm2. As per the definition, the values of 𝛼 for the heat
dominating modes of heat transfer in the bottom and top portions of
sinks with 2 and 4 plate fins, and 130 pin fins are equal to 1.39, 1.81,
cylindrical arrangements, respectively, when they erected vertically. and 1.81 respectively.
Hence, the heat sink configuration, with more fins at the bottom and
Contact area between PCM and battery with fins
fewer fins at the top, may have a high chance of enhancing conduction 𝛼 = (2)
Contact area between PCM and battery without fins
and convection simultaneously in the PCM domain. The geometrical
parameters, such as spacing and volume fraction of the fins, and the 4 R. Akula et al.
Applied Thermal Engineering 248 (2024) 123146 Table 1
Geometric parameters associated with the heat sinks considered in this study. S.no Heat sink No. of Fin size (mm) Spacing Fins’ PCM Volume Fin’s heat Ratio of type fins b/w fins volume volume fraction transfer heat transfer (mm) (mm3) (mm3) of fins area (mm2) area (𝛼) Width (w) Height (l) 1 Plain heat sink 0 – – – 0.0 32 500.0 0 0 1.00 2 Two plate fins 2 1.0 65.0 27.3 780.0 31 720.0 2.4 1560 1.39 3 Four plate fins 4 0.5 65.0 13.6 780.0 31 720.0 2.4 3120 1.81 4 130 pin fins (1 mm) 130 1.0 1.0 4.7 780.0 31 720.0 2.4 3120 1.81 5 130 pin fins (1.4 mm) 130 1.4 1.4 4.3 1528.8 30 971.2 4.7 4368 2.12 6 130 pin fins (2 mm) 130 2.0 2.0 3.7 3120.0 29 380.0 9.6 6240 2.56 7 130 pin fins (3 mm) 130 3.0 3.0 2.7 7020.0 25 480.0 21.6 9360 3.23 8 130 pin fins (3.5 mm) 130 3.5 3.5 2.2 9555.0 22 945.0 29.4 10 920 3.54 9 130 pin fins (4 mm) 130 4.0 4.0 1.7 12 480.0 20 020.0 38.4 12 480 3.83 4.7 (Top) 10 200 pin fins (1 mm) 200 1.0 1.0 1200.0 31300.0 3.7 4800 2.25 1.8 (Bottom) 11 260 pin fins (1 mm) 260 1.0 1.0 1.8 1560.0 30 940.0 4.8 6240 2.63 12 390 pin fins (1 mm) 390 1.0 1.0 0.9 2340.0 30 160.0 7.2 9360 3.44
Fig. 3. Schematic representation of battery and 130 fins, with each fin of size equal to (a) 1.4 mm, (b) 2 mm, (c) 3 mm, (d) 3.5 mm, and (e) 4 mm.
particular C-rate, the discharge/charge current is capacity times the C-
rate, and the duration is capacity times inverse of the C-rate. With this
mathematical definition, one can calculate the current and operating
time of the battery for any discharge rate. For example, a battery with
3 Ah capacity produces 6 A of current for 0.5 h when it is discharge
at a rate of 2C. Batteries generate heat in proportion to their discharge
rates. The heat generation from any LIB varies continuously with time,
even for a constant discharge. Despite variable heat generation with
time in the real batteries, a constant heat load, obtained by the time
average of varying heat generation, is taken as a heat load in the
present study for simplifying the analysis. Constant heat generation
is a valid assumption and widely used by researchers in the thermal
management studies of LIBs [39,48–50]. Heat generation rates of a
Panasonic NCR18650BD battery are observed to vary between 2.6 to
5.6, 4.2 to 8.0, and 6.4 to 10.4 W, in almost linear fashion, for 3C, 4C,
Fig. 4. Schematic representation of battery with number of fins on each battery are
equal to (a) 200, (b) 260, and (c) 390, with each fin of size equal to 1 mm.
and 5C discharge rates, respectively [15]. Given this, the time average
heat generation rates from the same battery are taken as 4, 6, and 8 W
for 3, 4, and 5C discharge rates for thermal performance evaluation of
ratio of heat transfer area (𝛼) for all the heat sinks considered in the
the above-mentioned heat sinks.
present study are tabulated in Table 1.
The present study conducts thermal performance comparison stud-
ies among different heat sinks for a 5C discharge rate. The best heat sink 2.2. Heat generation
obtained from this thermal analysis for a 5C discharge rate is further
characterized for 3 and 4C discharge rates and their corresponding
As mentioned in the introduction chapter, the rate at which the
results are also reported. After obtaining the best heat sink from the
battery is charged/discharged is defined as the C rate. For example,
thermal performance comparison analysis with constant heat loads, it
if a battery has a capacity of 3 Ah and is discharged at a 1C rate, it
is again characterized for transient heat loads obtained from Panasonic
indicates that 3 A of current can be withdrawn for one hour. For a
NCR18650BD battery at 3, 4, and 5C discharge rates. 5 R. Akula et al.
Applied Thermal Engineering 248 (2024) 123146 Table 2
energy equations are solved in the solid regions (battery, housing, and
Thermophysical properties of the materials considered in the present study [54,55]. fins) of the heat sinks. Materials Thermal Specific heat Density ( ) ( ) conductivity (J/kg K) (kg/m3) 𝜕 𝜕 𝜕𝑇
𝜌𝑏𝑎𝑡ℎ𝑏𝑎𝑡 = 𝑘𝑏𝑎𝑡 + 𝑞′ (3) (W/m K) 𝜕𝑡 𝜕𝑥𝑖 𝜕𝑥𝑖 ( ) Acrylic 0.21 1470 1190 𝜕 ( ) 𝜕 𝜕𝑇 𝜌 = 𝑘 (4) Aluminum 202 900 2719 𝜕𝑡
ℎ𝑜𝑢ℎℎ𝑜𝑢 𝜕𝑥 ℎ𝑜𝑢 𝑖 𝜕𝑥𝑖 Copper 401 385 8933 ( ) 𝜕 ( ) 𝜕 𝜕𝑇 Panasonic NCR18650BD 𝑘 = 0.413 959 1113 𝑟
𝜌𝑓𝑖𝑛ℎ𝑓𝑖𝑛 = 𝑘𝑓𝑖𝑛 (5)
𝑘 = 𝑘 = 1.78 𝜕𝑡 𝜕𝑥 𝜕𝑥 𝜃 𝑧 𝑖 𝑖
In Eqs. (3)–(5), 𝑞′, 𝜌, ℎ, and 𝑘 represent volumetric heat generation,
density, specific enthalpy, and thermal conductivity, respectively. Suf-
2.3. Mathematical formulation
fixes 𝑏𝑎𝑡, ℎ𝑜𝑢, and 𝑓 𝑖𝑛 represent the domains of battery, housing, and
fins, respectively. The continuity, momentum, and energy conservation
Thermal performance evaluations of different heat sink configura-
equations solved in the PCM domain are as follows.
tions in the present study are performed using ANSYS Fluent 2020 R2. Continuity equation:
The properties of aluminum are assigned to housing and the simulated
𝜕𝜌 + 𝜌(∇.⃖⃗𝑣) = 0 (6)
battery domains, whereas the properties of copper are assigned to fins. 𝜕𝑡
The gap between the housing, fins, and battery is filled with PCM. Momentum equation:
Paraffin wax is the most commonly used PCM for low temperature ( )
thermal management applications due to its noteworthy characteristics 𝜕⃖⃗ 𝑣 𝜌 + ⃖⃗ 𝑣.∇⃖⃗ 𝑣
= −∇𝑝 + 𝜇∇2 ⃖⃗
𝑣 + 𝜌⃖⃗ 𝑔 + ⃖⃖⃗ 𝑆 (7) 𝜕𝑡
including suitable melting point temperature, high latent heat, and low
thermal expansion coefficient [37,38,40]. In view of several advantages Energy equation:
with paraffin wax, the heat sinks considered in the present study are 𝜕
filled with the same PCM for their thermal performance comparison.
(𝜌ℎ) + ∇.(𝜌⃖⃗
𝑣ℎ) = ∇.(𝑘∇𝑇 ) (8) 𝜕𝑡
Moreover, an additional investigation is also carried out at the end of
In Eq. (7), 𝜇 represents dynamic viscosity of the PCM. The pressure in
present study to identify the effect of PCM on the thermal performance
the PCM domain is represented by 𝑝, and the gravity that acts vertically
of the heat sink. Properties of all the materials used in the present study
downwards in the −ve 𝑧-direction is represented by ⃖⃗ 𝑔.
are articulated in Tables 2 and 3. Although the battery is made of com-
The ratio of volumes of liquid PCM to total PCM in each mesh cell
posite materials in reality, the reason behind choosing an aluminum rod
is defined as the liquid fraction. The melt front movement in the cells
as a simulated battery in the present study is as follows: Invariably, all
is tracked using their respective liquid fraction values. The region of
studies on thermal management of LIBs in literature focused on surface
the solid–liquid phase transition in PCM is a porous zone with porosity
temperature of the battery. While designing cooling systems for LIBs at
equal to the liquid fraction in that particular cell. The solidus and
high discharge rates, real batteries are not preferred in the experiments
liquidus temperatures are used to define porosity or liquid fraction, 𝛾,
due to safety concerns. The real batteries are replaced with metallic
in a particular cell, as follows.
rods integrated with heaters. Actual heat generation profiles from the
real batteries, which are estimated using battery models, are used to ⎧ ⎪0
𝑇 < 𝑇𝑠𝑜𝑙𝑖𝑑𝑢𝑠
power the heaters in the metallic rods to mimic the actual battery ⎪
𝑇 − 𝑇𝑠𝑜𝑙𝑖𝑑𝑢𝑠
behavior. By using highly conductive material (aluminum in this study) 𝛾 = ⎨ 𝑇 𝑇
𝑠𝑜𝑙𝑖𝑑𝑢𝑠 < 𝑇 < 𝑇𝑙𝑖𝑞𝑢𝑖𝑑𝑢𝑠
𝑙𝑖𝑞𝑢𝑖𝑑𝑢𝑠 − 𝑇𝑠𝑜𝑙𝑖𝑑𝑢𝑠
as the simulated battery, its surface and core temperatures are almost ⎪ ⎪1 𝑇 > 𝑇
the same and higher than the surface temperature of actual battery ⎩
𝑙𝑖𝑞𝑢𝑖𝑑𝑢𝑠
under the same heat generation rates. It is always better to design
The superficial velocity (⃖⃗
𝑣) in the governing equations is equal to
a cooling system for higher temperatures than the usually observed
porosity (𝛾) times the liquid PCM velocity vector (⃖⃗
𝑣𝑙𝑖𝑞𝑢𝑖𝑑 )
temperatures on the surface of the actual batteries. As a result, the
heat sink, which is designed based on the temperature evaluations ⃖⃗
𝑣 = 𝛾 × ⃖⃗
𝑣𝑙𝑖𝑞𝑢𝑖𝑑 (9)
of simulated battery will definitely work for real battery. The same
The total enthalpy (ℎ) of the PCM in a particular cell at a time instant
assumption has been considered by several researchers in their studies
is the sum of sensible enthalpy (ℎ
on BTMS [51–53]. However, out of all the heat sink configurations
𝑠) and the utilized latent heat (ℎ𝑙 )
obtained from the temperature state and liquid fraction, respectively,
considered in Section 2.1, the outperforming heat sink, which effec- as shown below
tively regulates the thermal excursions of the simulated battery, is again
tested for its applicability for a real battery with actual thermophysical
ℎ = ℎ𝑠 + ℎ𝑙 (10) properties.
The following assumptions are made while performing the numeri- where, cal simulations [57,58]. 𝑇
ℎ𝑠 = ℎ𝑟𝑒𝑓 + 𝐶.𝑑𝑇 (11)
(i) Unsteady, laminar flow of the liquid PCM. ∫𝑇𝑟𝑒𝑓
(ii) Density variation of the PCM is taken care by the Boussinesq
ℎ𝑙 = 𝛾𝐿 (12) approximation.
(iii) The thermal conductivity, density, and specific heat of the PCM
In the above equations (Eqs. (11) and (12)), the notations C and L
in both the solid and liquid phases are constant [41,42].
represent specific heat and latent heat of the PCM, respectively.
(iv) Volume expansion of the PCM is negligible [37,38,40].
The momentum sink term in Eq. (7) is given by
(v) Radiation heat loss from any surface is negligible. (1 − 𝛾)2 ⃖⃖⃗ 𝑆 = − . 𝐴
(vii) The contact resistance between the heat sink and the TCEs is
𝑚𝑢𝑠ℎ𝑦.⃖⃗ 𝑣 (13) 𝛾3 + 𝑐 negligible.
In Eq. (13), c is a small number (0.001), added to 𝛾3, to avoid zero
In the PCM domain, the governing equations for continuity, mo-
in the denominator. The mushy zone, an interface of solid and liquid
mentum, and energy are solved, simultaneously, using the enthalpy-
phases, allows a smooth velocity transition from solid to liquid phases.
porosity approach proposed by Voller and Prakash [59]. The following
The development of velocity vectors and their strength in the liquid 6 R. Akula et al.
Applied Thermal Engineering 248 (2024) 123146 Table 3
Thermophysical properties of the PCMs considered in the present study [38,55,56]. Materials Thermal conductivity Specific heat Latent heat Melting point Density Thermal expansion (W/m K) (kJ/kg K) (J/kg) (◦C) (kg/m3) coefficient (K−1) Eicosane 0.23 2.10 (solid) 255 000 35–42 781 (solid) 0.00086 2.42 (liquid) 759 (liquid) Paraffin wax 0.22 1.93 (solid) 272 600 41–44 880 (solid) 0.00076 2.38 (liquid) 770 (liquid) Tetracosane 0.25 1.87 (solid) 289 600 47–54 777 (solid) 0.00094 2.29 (liquid) 746 (liquid)
PCM is decided by the mushy zone constant (𝐴𝑚𝑢𝑠ℎ𝑦) in the momentum
using Ansys Fluent 2020R2 are conducted on each mesh model for
equation (Eq. (7)). The increase in the mushy zone constant decreases
every heat sink configuration, and the temporal variation of average
the strength of convection currents in the liquid PCM and vice versa.
battery temperature for 5C discharge is noted. Fig. 5(b) shows the
temperature–time history of the average battery temperature of the
2.4. Initial and boundary conditions
plain heat sink for the three grid sizes 1, 0.5, and 0.32 mm when
subject to a discharge rate of 5C (constant heat generation rate of
The initial and boundary conditions are set in accordance with the
8 W). The maximum discrepancy in the average battery temperatures
experiments conducted by Wang et al. [35].
obtained from the grid sizes 0.5 mm and 0.32 mm are less than 1%. At time, 𝑡 = 0
By taking accuracy and computational cost as important objectives, 𝑇 = 𝑇
the mesh with an element size of 0.5 mm has been taken as the
𝑏𝑎𝑡 = 𝑇𝑓 𝑖𝑛 = 𝑇𝑃 𝐶𝑀 = 𝑇ℎ𝑜𝑢 = 25 ◦C (14)
optimum grid size for generating mesh on the plain heat sink. Grid
The top and bottom surfaces of the heat sink are insulated,
and time independence studies are also conducted for all the remaining 𝜕𝑇 𝜕𝑇 𝜕𝑇 𝜕𝑇
heat sink configurations considered in Section 2.1. Their results show = 𝑏𝑎𝑡 = 𝑃 𝐶𝑀 = ℎ𝑜𝑢 = 0 (15) 𝜕𝑧 𝜕𝑧 𝜕𝑧 𝜕𝑧
that the grid size of 0.5 mm is sufficient to accurately predict the
At the interface between battery and PCM, the following equation is
temporal variation of average temperature for the remaining heat sink valid
configurations. However, the solutions did not converge during melting 𝜕𝑇 𝜕𝑇
when the time step size was 0.5 s. Given this, a time step size of 0.1 s − 𝑏𝑎𝑡 𝑃 𝐶𝑀 𝑘𝑏𝑎𝑡 = −𝑘 (16) 𝜕𝑟 𝑃 𝐶𝑀 𝜕𝑟
is set for the melting, and 0.5 s is used during the pre and post-melting
Natural convection heat loss with heat loss coefficient ℎ
phases of PCM for all the heat sinks in all the simulations carried out 0 (details of the choice of ℎ in this study.
0 are given in Section 2.6) is given as a boundary condition
on the outer curved surface of the housing, as follows 𝜕𝑇
2.6. Validation of current numerical methodology − ℎ𝑜𝑢 𝑘𝑏𝑎𝑡 = ℎ 𝜕𝑟
0(𝑇ℎ𝑜𝑢 − 𝑇𝑎𝑚𝑏) (17)
The Semi-Implicit Method for Pressure Linked Equations (SIMPLE)
To validate the numerical methodology adopted in the present
algorithm is used for pressure-velocity coupling, and the PREssure
study, the numerical results for the heat sink configurations with plate
STaggering Option (PRESTO) scheme is adopted for pressure correction
fins are compared against the experimental results of the same heat sink
equations. The Second Order upwind scheme is used for discretizing
configurations reported by Wang et al. [35] for a discharge rate of 5C
momentum and energy equations, and the first-order implicit method
(constant heat load of 8 W). A parametric study is conducted to identify
is used for transient formulation. The under-relaxation value factors
the appropriate heat loss coefficient (ℎ0), which needs to be given as a
are set at 0.3, 1.0, 0.7, and 0.9 for pressure, density, momentum, and
boundary condition on the outer walls of the heat sinks in the numerical
liquid fraction, respectively. The convergence criteria for continuity,
simulations, to quantify the heat loss to the ambient. Three heat loss
momentum, and energy equations are set at 10−4, 10−6, and 10−8,
coefficients 5, 10, and 15 W/m2K are applied as boundary conditions
respectively. The Aqua cluster, a high-performance computing facility
on the outer surface of the housing in the current numerical modeling
at the Indian Institute of Technology Madras, India, is used to perform
and compared the obtained numerical results against the experimental the computations.
results reported by Wang et al. [35]. The discrepancy between the
experimental results reported by Wang et al. [35] and the numerical
2.5. Grid independence study
results obtained for heat loss coefficient of 10 W/m2K is the lowest
compared to heat loss coefficients 5 and 15 W/m2K (see Fig. 6(a)).
Grid and time-step independence studies are necessary to ascertain
In view of this, a heat loss coefficient of 10 W/m2K is applied as the
the appropriate spatial and temporal discretization for generating mesh
boundary condition on the outer surface of the housing for validation
on various heat sink configurations considered in the present study.
of other heat sink configurations with 2 and 4 plate fins. Figs. 6(b)
As fin dimensions change from geometry to geometry and the full
Navier–Stokes equations are being solved in the PCM domain, the
and 6(c) show the comparison of the average battery temperatures
mesh quality of both fins and PCM domains decides the accuracy of
obtained from the current numerical methodology, with 10 W/m2K as
simulation results. Given this, the grid independence study is conducted
the heat loss coefficient, against experimental results reported by Wang
only for the PCM and fin domains. Tetrahedral elements with different
et al. [35] for 2 and 4 plate fins, respectively. The maximum difference
element sizes, 1, 0.5, and 0.32 mm, are considered to generate a
between the experimental and the numerical results for the heat sink
mesh in the PCM and fin domains. The same type of elements with
configurations with 2 and 4 plate fins is identified to be less than 5%.
a 1 mm size is chosen to generate a mesh in other parts of the heat
Given the close agreement between the experimental and numerical
sink (battery and housing) for all the heat sink geometries presented
results, the current numerical methodology is assumed to give accu-
in Section 2.1. Fig. 5(a) shows the plain heat sink with tetrahedral
rate results. Hence, the same numerical methodology is adopted to
mesh elements of size 1 mm in the battery and housing domains and
explore the flow and heat transfer characteristics of the other heat sink
of size 0.32 mm in the PCM and fins domains. Numerical simulations
configurations considered in this study. 7 R. Akula et al.
Applied Thermal Engineering 248 (2024) 123146
Fig. 5. Figures showing (a) meshed model of plain heat sink with tetrahedral elements of size 0.32 mm in the PCM and fin domains and the same type of elements with size
1 mm in the battery and housing domains, and (b) results of the grid independence study conducted on a plain heat sink for 5C discharge (constant heat load of 8 W).
Fig. 6. Comparison of average temperature–time histories, obtained experimentally by Wang et al. [35] and numerically from the current numerical methodology, for (a) plain
heat sink with heat loss coefficients 5, 10, and 15 W∕m2K, and for (b) heat sinks with 2 plate fins and for (c) 4 plate fins with heat loss coefficient equal to 10 W∕m2 K.
3. Results and discussion
be as low as possible for any configuration to be considered as the best-performing heat sink.
Two performance metrics are used in the present study to evaluate
This section is organized as follows. Initially, the advantage of
the thermal performance of the heat sinks. One is the average surface
adding PCM to the heat sink is quantified. After that, the superiority
temperature of the battery, and other is the maximum temperature dif-
of the pin fins over plate fins in the thermal regulation of the battery
ference on the surface of the battery. The average surface temperature
is presented. Following this, the influence of changing fin size and
and the maximum temperature difference on the battery surface should
the effect of changing fin number on the battery temperature are 8 R. Akula et al.
Applied Thermal Engineering 248 (2024) 123146
the operation in terms of temperature uniformity and regulation of
average temperatures. It is further observed from Fig. 8 that the heat
sink with 130 pin fins records slightly higher average temperatures than
latter heat sinks near the set point temperature (SPT) of 60 ◦C (see
Fig. 8(b)). However, this difference is observed to be minimal (<1 ◦C).
In view of lower operating temperatures (except near SPT) and higher
temperature uniformity throughout the operation, the heat sink with
130 pin fins is a better option compared to heat sinks with 2 and 4 plate
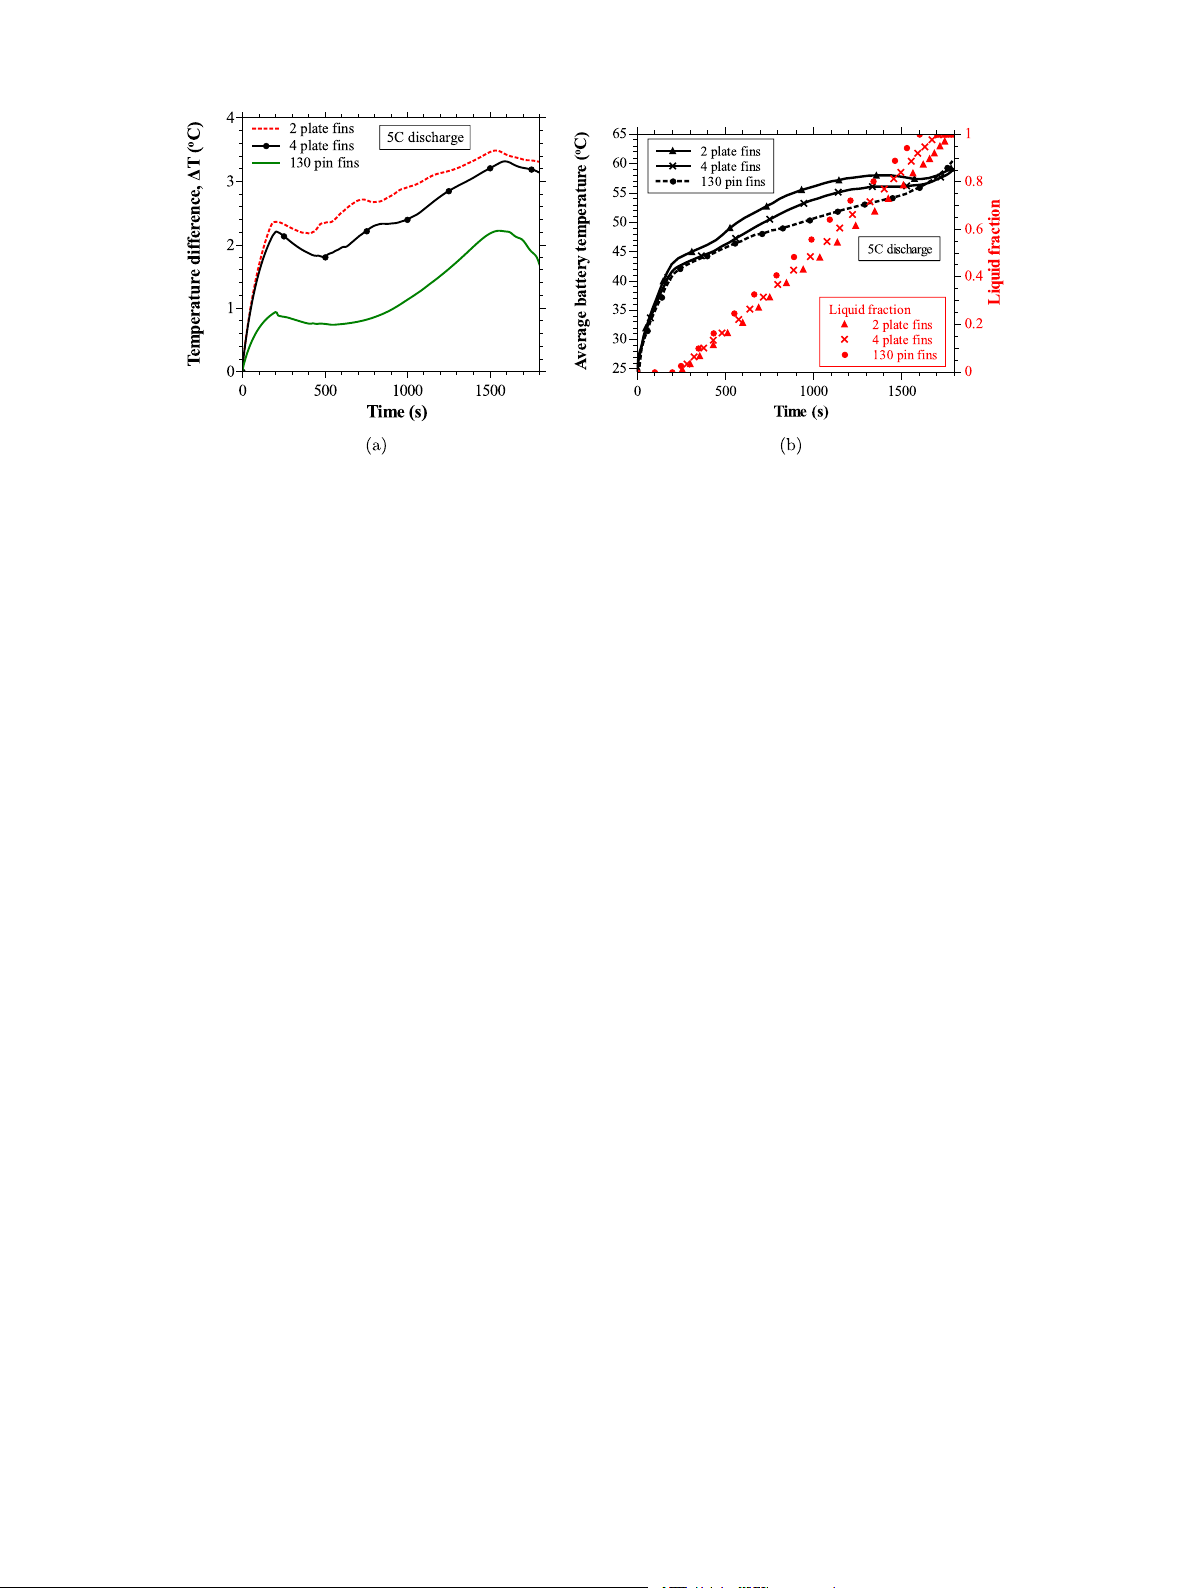
fins. From the liquid fraction-time histories reported in Fig. 8(b), it is
clear that the accelerated melting of PCM in consequence of uniform
and swift diffusion of heat through pin fins is the major reason for the
greater thermal regulation with heat sink of 130 pin fins. The superior
performance of pin fins over plate fins can be further explained using
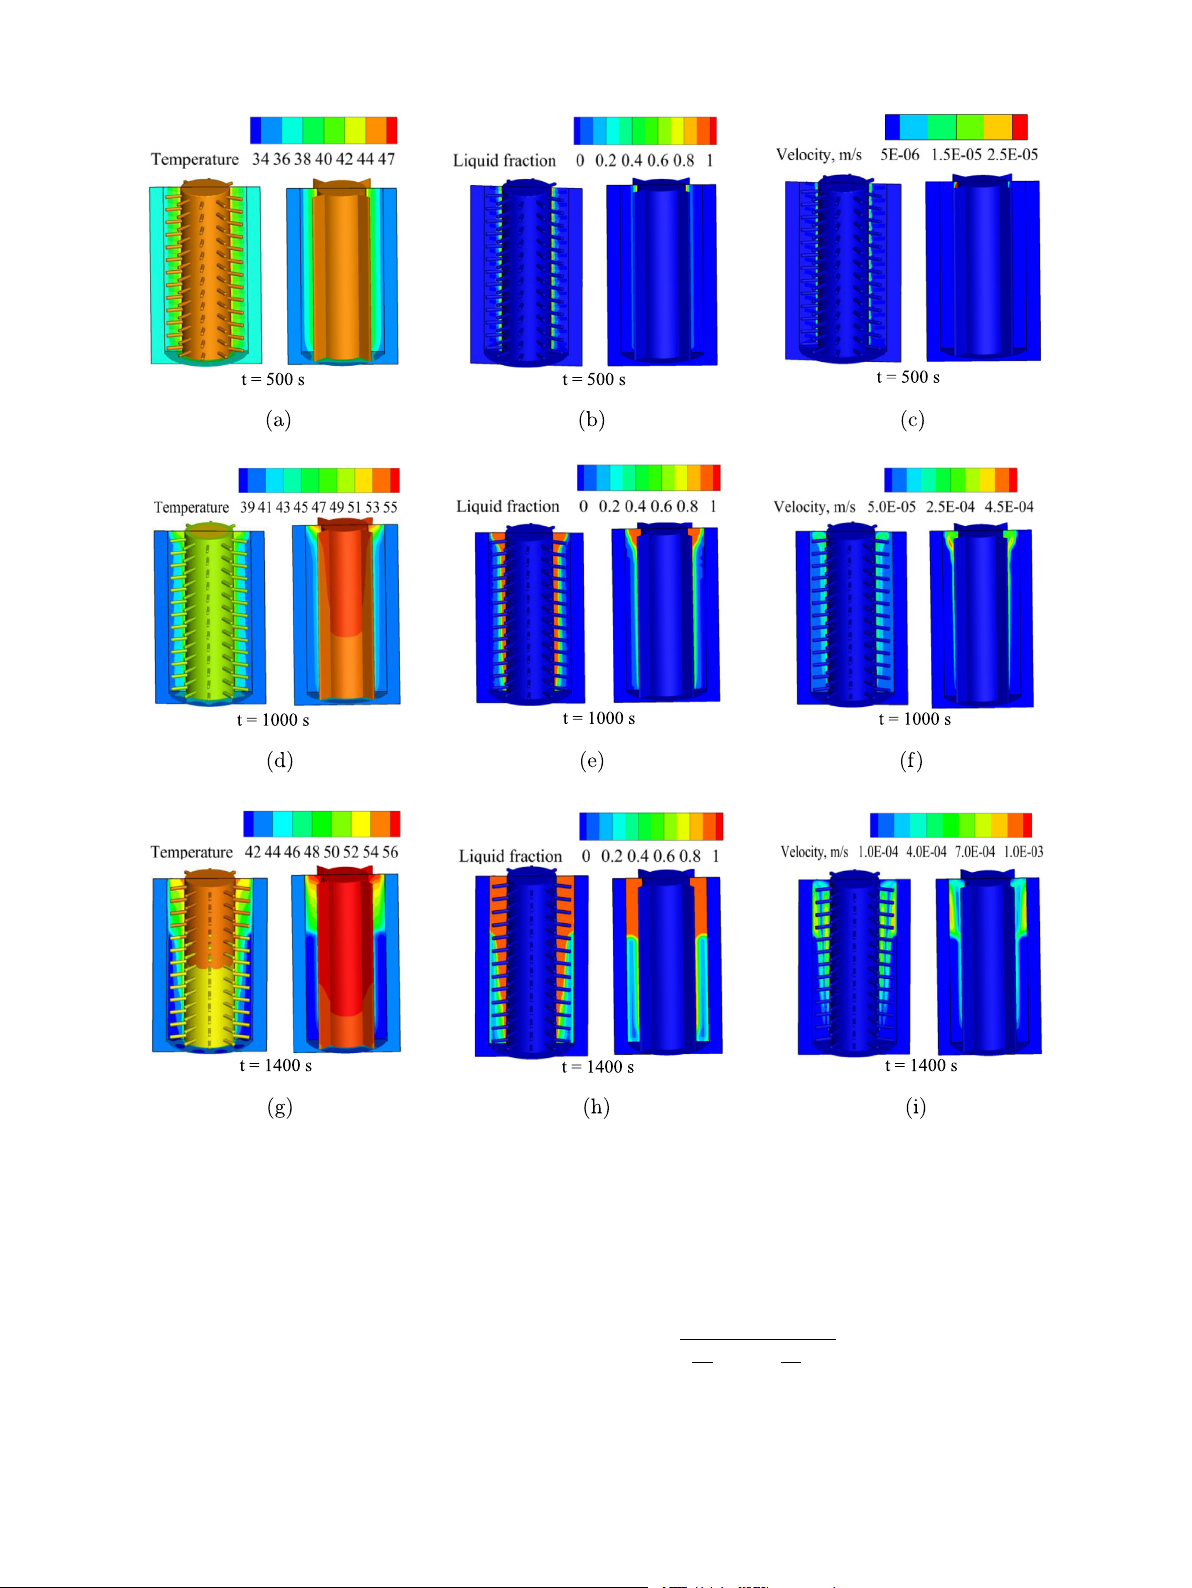
temperature, liquid fraction, and velocity contours. Fig. 9 shows the
temperature, liquid fraction, and velocity contours for these two heat
sinks (heat sink with 130 pin fins and heat sink with 4 plate fins)
at mid plane of the battery. The contours presented in Fig. 9 are at
three different time instants: (1) at the onset of melting, i.e., 𝑡 = 500 s
(Figs. 9(a)–9(c)), (2) during melting, i.e., 𝑡 = 1000 s (Figs. 9(d)–9(f)),
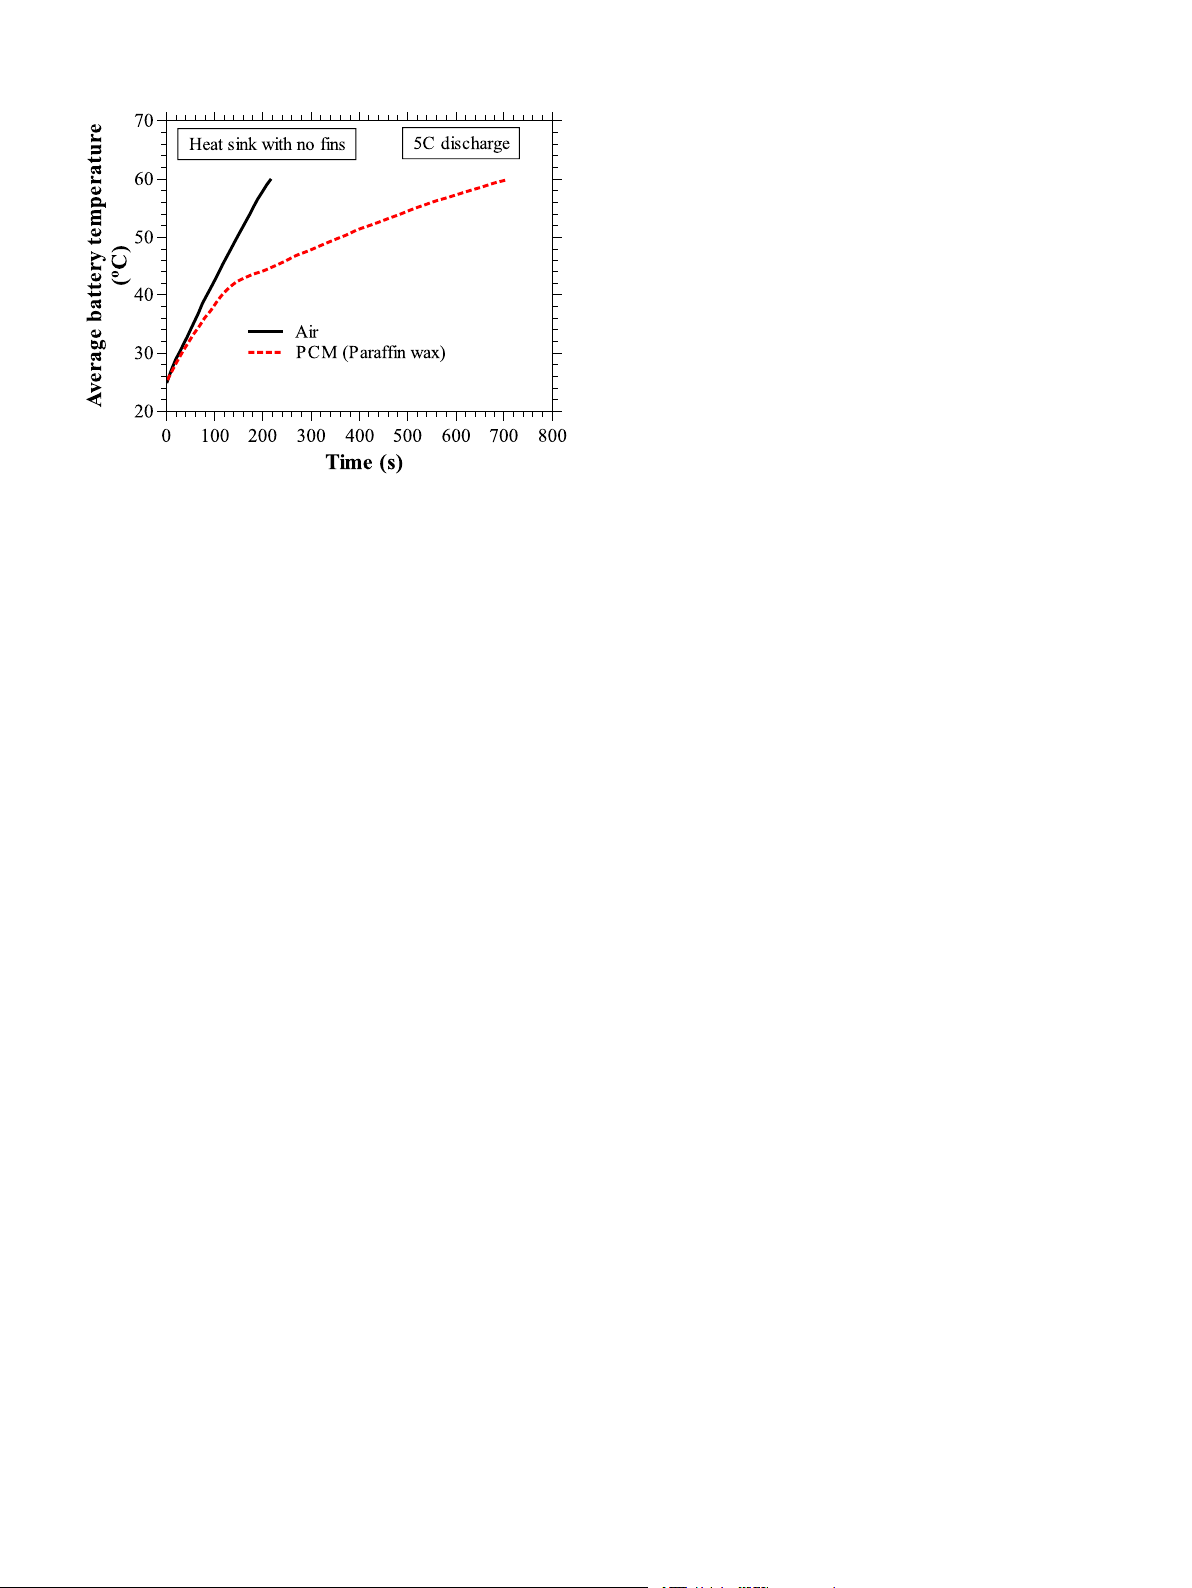
Fig. 7. Comparison of temperature–time histories obtained from plain heat sink, for air
and (3) at the thermal control point of the heat sink with four plate fins,
and PCM as working fluids, when the discharge rate of battery is equal to 5C (constant
i.e., 𝑡 = 1400 s (Figs. 9(g)–9(i)). The thermal control point is the instant heat load of 8 W).
at which the housing of the heat sink reaches the liquidus temperature
(for paraffin wax, it is 44 ◦C) of the PCM, beyond which the heat sink
no longer absorbs heat in the form of latent heat. Despite stronger
conferred. The best heat sink among all the heat sinks is selected and
convection currents in the PCM for the heat sink with four plate fins, the
validated against in-house experiments. Next, the best heat sink is
melt front movement and the temperature distribution in the PCM are
further characterized for various ambient conditions, heat loads, and
more uniform for the heat sink with 130 pin fins than its counterpart
PCMs. Finally, the best heat sink is tested to check its applicability for
due to the dominance of conduction created by pin fins in the domain
thermal management of actual battery with transient heat generation.
of PCM. In the total operation, the heat sink having 130 pin fins records
a 3.3 ◦C lower average temperature than the heat sink with four plate
3.1. Effect of PCM on the thermal performance of the plain heat sink
fins. In addition, the maximum temperature difference on the surface
of the battery for the heat sink with 130 pin fins is confined below
Fig. 7 shows the comparison between the temporal evaluation of the
2.2 ◦C, whereas it is 3.2 ◦C for the heat sink with four plate fins. Given
average surface temperature of the battery for plain heat sink (heat sink
this, the heat sink with 130 fins (fin size: 1 mm) is considered the base
with no fins) filled with air and PCM under 5C discharge rate (constant
heat sink in the upcoming studies to compare the improvement in the
8 W heat load). From the figure, it is clear that the time required to
thermal performance of other heat sinks with pin fins.
reach a Set Point Temperature (SPT) of 60 ◦C is just 214 s when air
is the working fluid, and this gets extended to 716 s when the air is
3.3. Effect of volume fraction of pin fins
replaced with PCM (paraffin wax). Considering the high latent heat
capacity of the PCM, the operating time of 716 s is still very low. The
The volume fraction of the pin fins is varied from the base model
low thermal conductivity of PCM hinders the diffusion of heat, and as
(heat sink with 130 pin fins of size 1 mm) by (i) increasing the fin size
a consequence, only a little heat is absorbed by the PCM, and more
by keeping the number of fins constant (130 fins) and by (ii) increasing
the number of fins by maintaining the fin size constant (fin size: 1 mm).
heat is stored as sensible heat in the battery, which results in a rapid
In the first case, a total of five heat sink configurations are considered
temperature rise of the battery due to minimal latent heat exploitation.
with fin sizes equal to 1.4, 2.0, 3.0, 3.5, and 4.0 mm, resulting fin
Hence, the heat sink reaches the SPT of 60 ◦C reasonably early. Given
volume fractions equal to 4.7, 9.6, 21.6, 29.4, and 38.4%, respectively
this, the use of thermal conductivity enhancers is inevitable for the
(see Fig. 3). In the second case, three heat sink configurations with 200,
effective diffusion of heat into the core of the PCM and better utilization
260, and 390 fins of volume fractions 3.7, 4.8, and 7.2%, respectively,
of the available latent heat in the PCM. are simulated (see Fig. 4).
3.2. Advantage of pin fins over plate fins
3.3.1. Effect of fin size
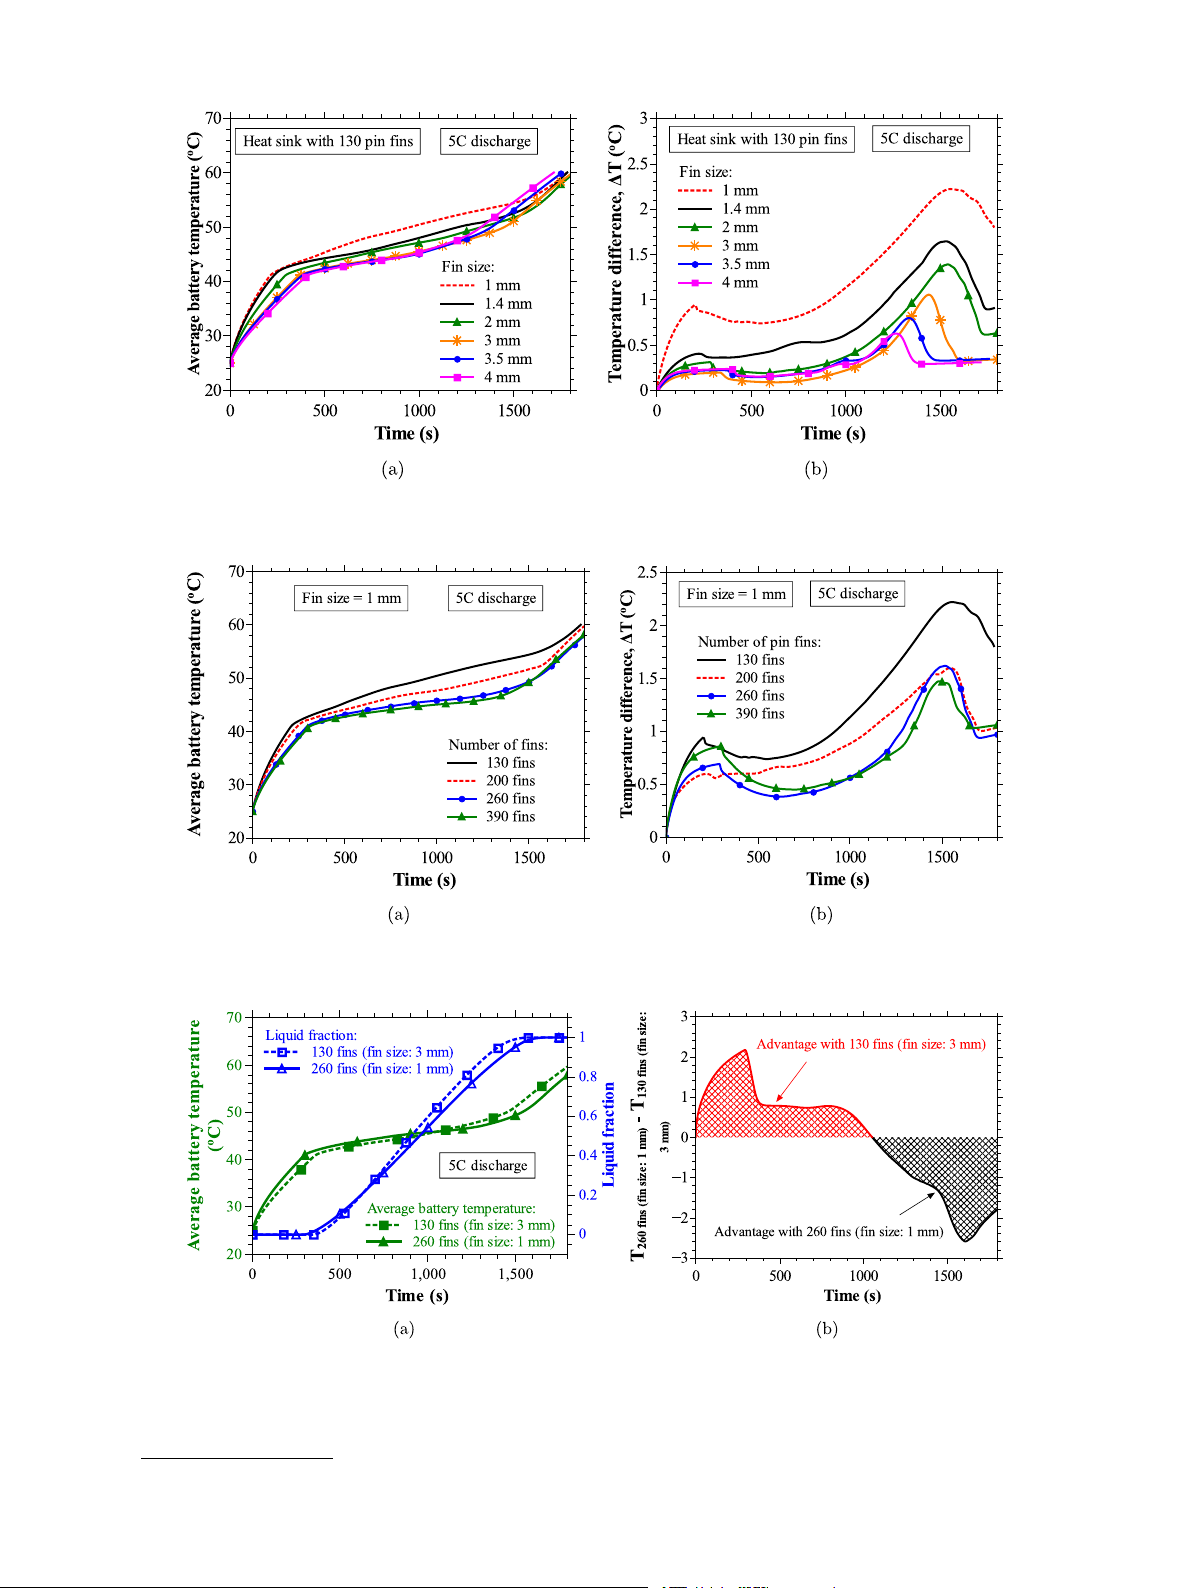
Fig. 10 shows the temporal evaluation of average temperature and
In the previous section (Section 3.1), it was established that the
the maximum temperature difference on the surface of the battery for
TCEs are essential to improve the heat sink performance by creating
five heat sink configurations, each employing 130 pin fins of square
thermal conductive paths for the input heat to diffuse into the core of
cross-section, of size equal to 1.4, 2.0, 3.0, 3.5, and 4.0 mm for a 5C
the PCM. As discussed earlier, the plate-fin heat sink with 2 and 4 fins,
discharge rate. As the fin size increases from 1 to 3 mm, the average
and the pin fin heat sink with 130 fins (see Fig. 2) are designed and sim-
temperature and the temperature difference on the surface of the
ulated to comprehensively understand the thermal regulation capability
battery decreases. After that, the increase in fin size adversely affected
of the heat sink with pin and plate fins. Figs. 8(a) and 8(b) compare
the thermal regulation capability by recording lower operating times
the numerical results for the maximum temperature difference and the
and higher thermal gradients compared to a heat sink with a 3 mm
average battery temperature on the battery surface, respectively, for the
fin size (see Figs. 10(a) and 10(b)). This is because the improvement
heat sinks with 2 and 4 plate fins and the heat sink with 130 pin fins.
in the thermal conductivity overcomes the reduction in the available
The point to be noted here is that the volume fraction of these three
latent heat of the composite PCM (combination of fins and PCM) till
heat sinks is equal to 2.4%. Though the volume fraction of fins is the
fin size increases from 1 to 3 mm, which means the positive impact
same for the heat sinks with 2 and 4 plate fins, the latter shows superior
of the increase in effective thermal conductivity of PCM dominates the
performance over the former due to its high value of 𝛼. Despite having
negative effect of reduction in its volume. Based on these results, the
the same 𝜙 and 𝛼, it can be seen from Fig. 8 that the heat sink with 130
heat sink with a fin size of 3 mm is considered optimum in regulating
pin fins outperforms the heat sinks with 2 and 4 plate fins throughout
thermal excursions during high heat generation rates from the battery. 9 R. Akula et al.
Applied Thermal Engineering 248 (2024) 123146
Fig. 8. Comparison of (a) the maximum temperature difference on the surface of the battery, and (b) average surface temperature–time and liquid fraction-time histories for heat
sink configurations with 2 and 4 plate fins, and 130 pin fins for 5C discharge rate (constant heat load of 8 W) of the battery.
3.3.2. Effect of fin number
battery. However, it also reduces the space available to accommodate
In the previous section (Section 3.3.1), the effect of increase in
the PCM in the heat sink, resulting in less latent heat availability. As a
volume fraction due to increase in fin size was studied in detail. This
result, the heat sink with 130 fins (fin size: 3 mm) exhibits superior and
section presents an elaborate discussion on the effect of increase in
poor performance during the initial and final stages of the operation,
fin volume fraction by increase in the number of fins. Figs. 11(a) and
respectively, over the heat sink with 260 fins (fin size: 1 mm) (see
11(b) show the time-varying responses of average temperature and
Fig. 12(b)). Apart from thermal performance, the weight of the heat
the maximum temperature difference on the surface of the battery,
sink also plays a significant role in choosing the best heat sink. It is
respectively, for the heat sinks with 130 (base case), 200, 260, and
observed from the weight calculations that the heat sink with 130 fins
390 fins. Please refer to Section 2.1 for a detailed discussion on the
(fin size: 3 mm) is 12.2% more weighed than its counterpart, i.e., the
design and dimensions of the heat sink having 200, 260, and 390 fins.
heat sink with 260 fins (fin size: 1 mm). Considering the thermal
The volume fractions offered by these heat sinks with the number of
performance and weight metrics, the heat sink with 260 fins, each
fins equal to 200, 260, and 390 are 3.7%, 4.8%, and 7.2%, respec-
fin of size 1 mm, is finalized as the best heat sink among all heat
tively. One can assess from Figs. 11(a) and 11(b) that the thermal
sinks considered in the present study. To further explore the thermal
performance of the heat sinks increases with an increase in fin number.
behavior of the best heat sink (i.e., 260 fins with each fin size equal
This is because of increase in locations on the battery to dissipate heat
to 1 mm) for various ambient conditions, heat loads, and PCMs, the
uniformly into the overall volume of the PCM resulted by the increase
remaining heat sinks considered in the present study are omitted from
in fin number. However, the thermal performance of the heat sink is
analysis in the ensuing sections.
improved marginally beyond 260 pin fins, which means, doubling (260
fins) and tripling (390 fins) the fins from the base heat sink (130 fins)
3.4. Experimental validation of the best performing heat sink
showed similar results because the advantage of uniform diffusion of
heat with the number of fins beyond 260 is counterbalanced by the
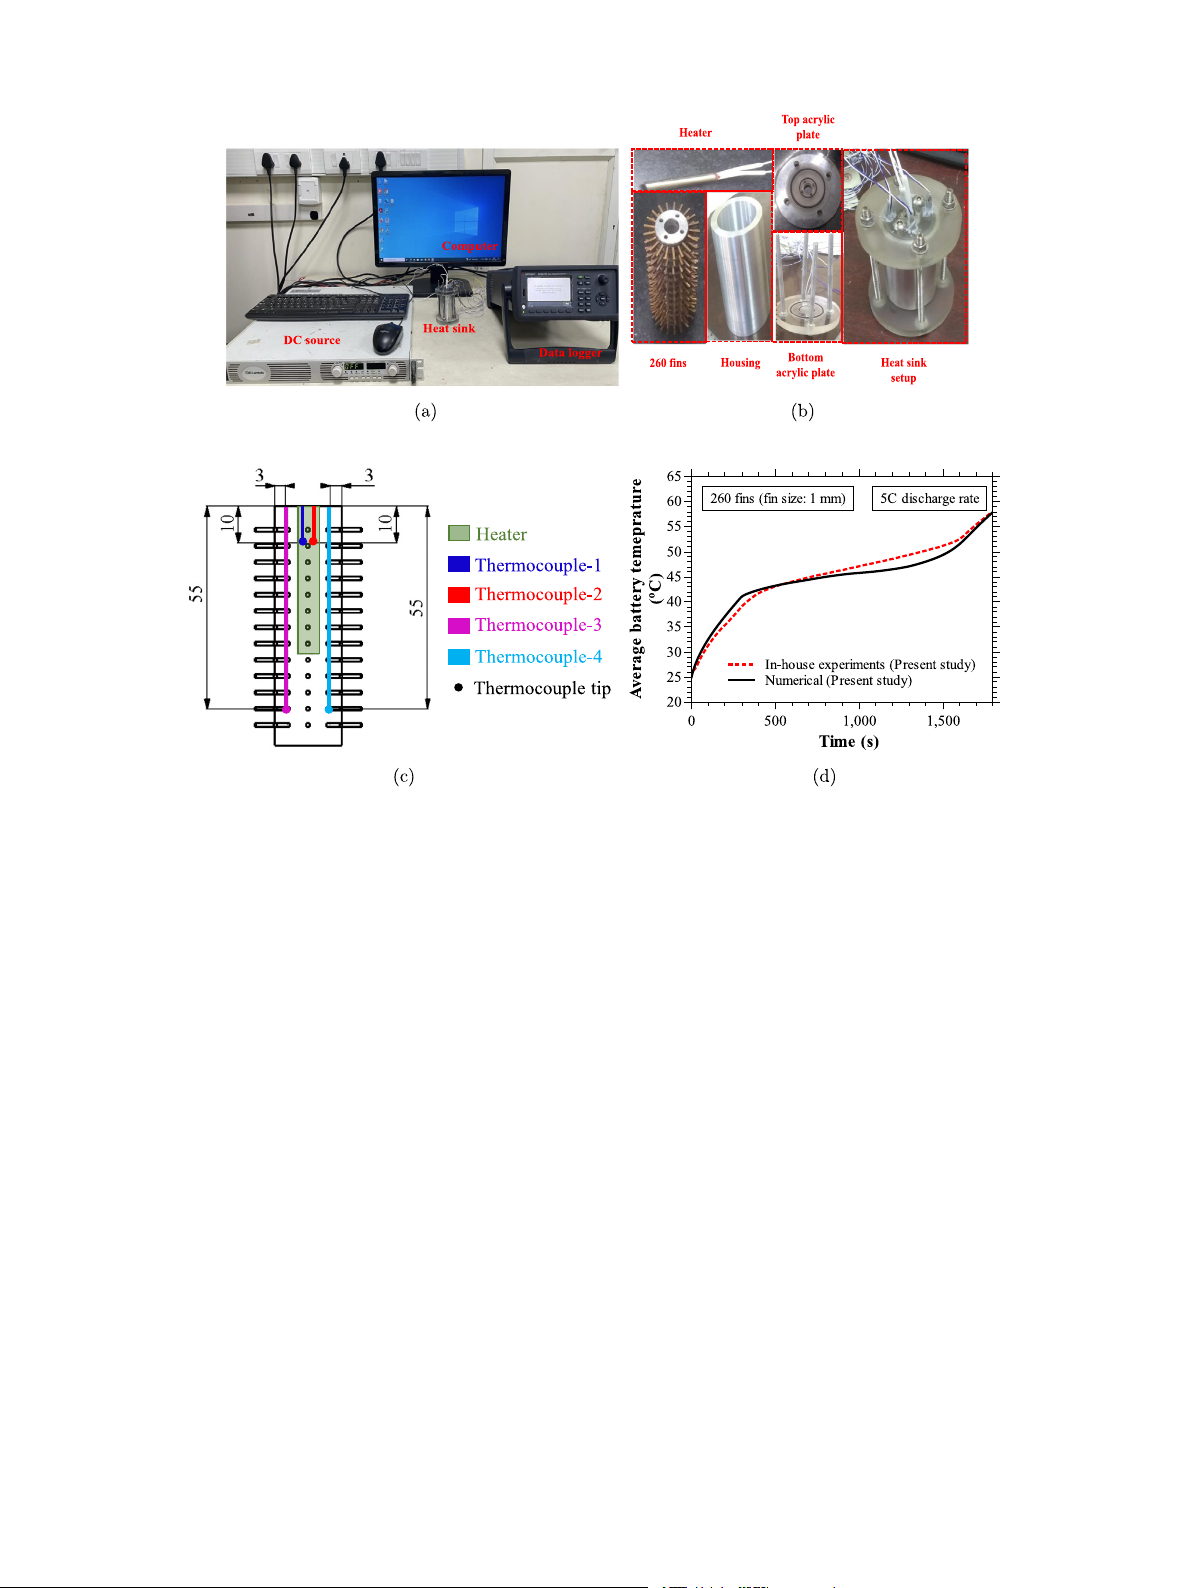
In-house experiments are conducted on the best-performing heat
disadvantage of reduction in the latent heat of the PCM. Despite having
sink (260 pin fin heat sink with each fin of size 1 mm) to validate the
a little advantage in thermal regulation with 390 pin fins, the heat sink
above numerical results for paraffin wax at 5C discharge (constant heat
with 260 fins can be considered as the better choice by keeping the
load of 8 W). Figs. 13(a), 13(b), and 13(c) show the experimental setup,
thermal performance, weight, and intricacy involved in fabricating the
parts of the 260 pin fin heat sink, and locations of the thermocouples heat sinks as the metrics.
inserted in the heat sink, respectively. The heat sink consists of a rod-
In Section 3.3.1, the heat sink with 130 fins (each fin of size 3 mm)
type heater (diameter = 6.5 mm, length = 40 mm), an aluminum rod
turned out to be the best heat sink when the thermal performances
having the same dimensions as 18650 battery (diameter = 18 mm,
of the heat sinks with different fin sizes were compared. Based on
length = 65 mm) with 260 copper fins (each fin dimension = 1 ×
the results presented in Section 3.3.2, it is seen that the heat sink
1 × 6 mm3) brazed on its curved surface, a cylindrical housing (inner
with 260 fins (each fin of size 1 mm) results out to be the best heat
diameter = 31 mm, thickness = 5 mm, height = 65 mm), and two
sink when the thermal performance of heat sinks with different fin
acrylic plates. A cylindrical groove of dimensions equal to the heater is
numbers was compared. Fig. 12(a) compares the thermal performance
made at the center of the aluminum rod from the top to accommodate
of these two best heat sinks, i.e., heat sink with 130 fins (fin size:
the heater. The heater and aluminum rod combination replicates the
3 mm) and heat sink with 260 fins (fin size: 1 mm), on the metric of
cylindrical 18650 Li-ion battery with heat generation. Four holes are
average battery temperature, for 5C discharge, to finalize the one best
made in the aluminum rod, two at a depth of 55 mm and the other two
heat sink. From Fig. 12(a), it is clear that a heat sink with 130 fins
at a depth of 10 mm from the top, to insert four T-type thermocouples
(fin size: 3 mm) records lower average battery temperature during the
to measure the temporal evaluation of average temperature (average of
conduction-dominated phase (pre-melting and initial phase of melting).
four thermocouple readings at a instant) and the temperature difference
During later phases of melting and post-melting, the average battery
(average of first and second thermocouple readings at a instant- average
temperature obtained with a heat sink having 130 fins (fin size: 3 mm)
of third and fourth thermocouple readings at a instant) in the battery
surpasses the heat sink with 260 fins (fin size: 1 mm). The volume
(see Fig. 13(c)). The thermocouples are calibrated, and the uncertainty
fractions of fins in the heat sink with 130 fins (fin size: 3 mm) and
in the temperature measurements is measured to be within ±0.25 ◦C.
260 fins (fin size: 1 mm) are 21.6 and 4.7%, respectively. A higher
The battery with thermocouples and housing is placed over the bottom
volume fraction of fins helps to diffuse more heat into the PCM from the
acrylic plate and sealed with top another acrylic plate, and the whole 10 R. Akula et al.
Applied Thermal Engineering 248 (2024) 123146
Fig. 9. The contours of temperature (a, d, and g) in ◦C, liquid fraction (b, e, and h), and velocity (c, f, and i) in m/s on the middle plane at three time instants: (i) onset of
melting, i.e., 𝑡 = 500 s (a, b, c), (ii) during melting, i.e., 𝑡 = 1000 s (d, e, f), and (iii) at the thermal control point.i.e, 𝑡 = 1400 s (g, h, i).
setup is tightened with a nut and bolt locking system. Initially, the
and voltage in the DC power leads to uncertainty in the heat generation
amount of PCM (in grams) required to fill the heat sink cavity is
from the heater. The propagation of this error in the fundamental
calculated from the mass, density, and volume relation. The required
quantities (current and voltage) to the derived quantity (power) can
amount of solid PCM is taken into a beaker, and then, it is heated
be calculated using the method of propagation of errors using the
to 80 ◦C using a temperature water bath. The melted PCM in the
beaker is poured into the heat sink through a hole provided in the
following equation (see Eq. (18)).
top acrylic plate using a glass funnel. The PCM is filled up to 95% √( )2 ( )2
volume available in the heat sink. The remaining 5% of the volume is 𝜕𝑃 𝜕𝑃 𝜎𝑃 = ± 𝜎𝑉 + 𝜎𝐼 (18)
left out for thermal expansion of the PCM during melting, as its thermal 𝜕𝑉 𝜕𝐼
expansion coefficient is 0.00076 K−1 [39]. The heater placed in the
In the above equation, 𝜎
aluminum rod is connected to the DC power supply (TDK Lambda DC
𝑉 and 𝜎𝐼 represent uncertainties in voltage and
current, which are observed to be ± 0.1 V and ± 0.01 A, respectively.
source) to generate the required heat. The thermocouples are connected
to DAQ (Agilent 34970 A), and DAQ is connected to a computer to
The voltage and current values set in the DC power source to obtain
measure temperatures for every interval of 5 s. The resolution of current
8 W power output are equal to 12.5 V and 0.64 A. The uncertainty in 11 R. Akula et al.
Applied Thermal Engineering 248 (2024) 123146
Fig. 10. Comparison of (a) average temperature–time history, (b) maximum temperature difference-time history on the surface of battery for heat sink configurations having 130
pin fins with each fin size equal to 1, 1.4, 2, 3, 3.5, and 4 mm.
Fig. 11. Comparison of (a) average temperature–time history, (b) maximum temperature difference-time history on the surface of the battery for heat sink configurations having
number of fins equal to 130, 200, 260, and 390 with each fin of size 1 mm.
Fig. 12. Comparison of (a) average surface temperature–time history of the battery for heat sinks with 260 fins (fin size: 1 mm) and 130 fins (fin size: 3 mm) and (b) advantage
of one heat sink over other during complete operation in terms of temperature regulation.
the power supply is calculated using Eq. (18), as follows.
The uncertainty in the power supply is calculated to be ±0.14 W for √
a nominal power of 8 W. The percentage of uncertainty is just 1.75% 𝜎𝑃 = ±
(0.64 × 0.1)2 + (12.5 × 0.01)2 = ±0.14 W (19)
and can be ignored. Each experiment is conducted twice to check the 12 R. Akula et al.
Applied Thermal Engineering 248 (2024) 123146
Fig. 13. Figure showing (a) photograph of the experimental setup, (b) parts of the 260 pin fin heat sink used, (c) location of the thermocouple positions in the battery, and (b)
average surface temperature–time histories for heat sink with 260 pin fins (fin size: 1 mm) obtained from in-house experiments and numerical simulations for 5C discharge rate.
repeatability. In each experiment, the initial and ambient tempera-
on the heat sink is investigated numerically. The initial temperatures
tures are almost constant and equal 25 ± 1 ◦C. Fig. 13(d) compares
of the heat sink, PCM, and battery are set at the respective ambient
the temperature–time histories of the heat sink, with 260 fins (fin
temperatures (either 15, 25, or 35 ◦C) when studying the effect of
size: 1 mm) obtained from both in-house experiments and numerical
ambient temperature on the thermal performance of the heat sink.
simulations, for paraffin wax as PCM, when subject to a discharge
The average temperature–time histories of the battery and the liquid
rate of 5C. Fig. 13(d) clearly shows that the numerical results are in
fraction-time histories of the PCM for ambient temperatures 15, 25,
good agreement with the experimental results, within the maximum
and 35 ◦C are depicted in Fig. 14(a). From intuition, one can easily
discrepancy of 5%. The deviation between the experimental and nu-
understand that the heat sink with lower ambient temperature takes
merical results could be attributed to the assumptions employed in the
longer to reach the set point temperature consequent upon higher
numerical simulations including constant thermophysical properties of
temperature difference between the initial and set point temperatures.
the PCM during phase change, and omitting contact thermal resistance
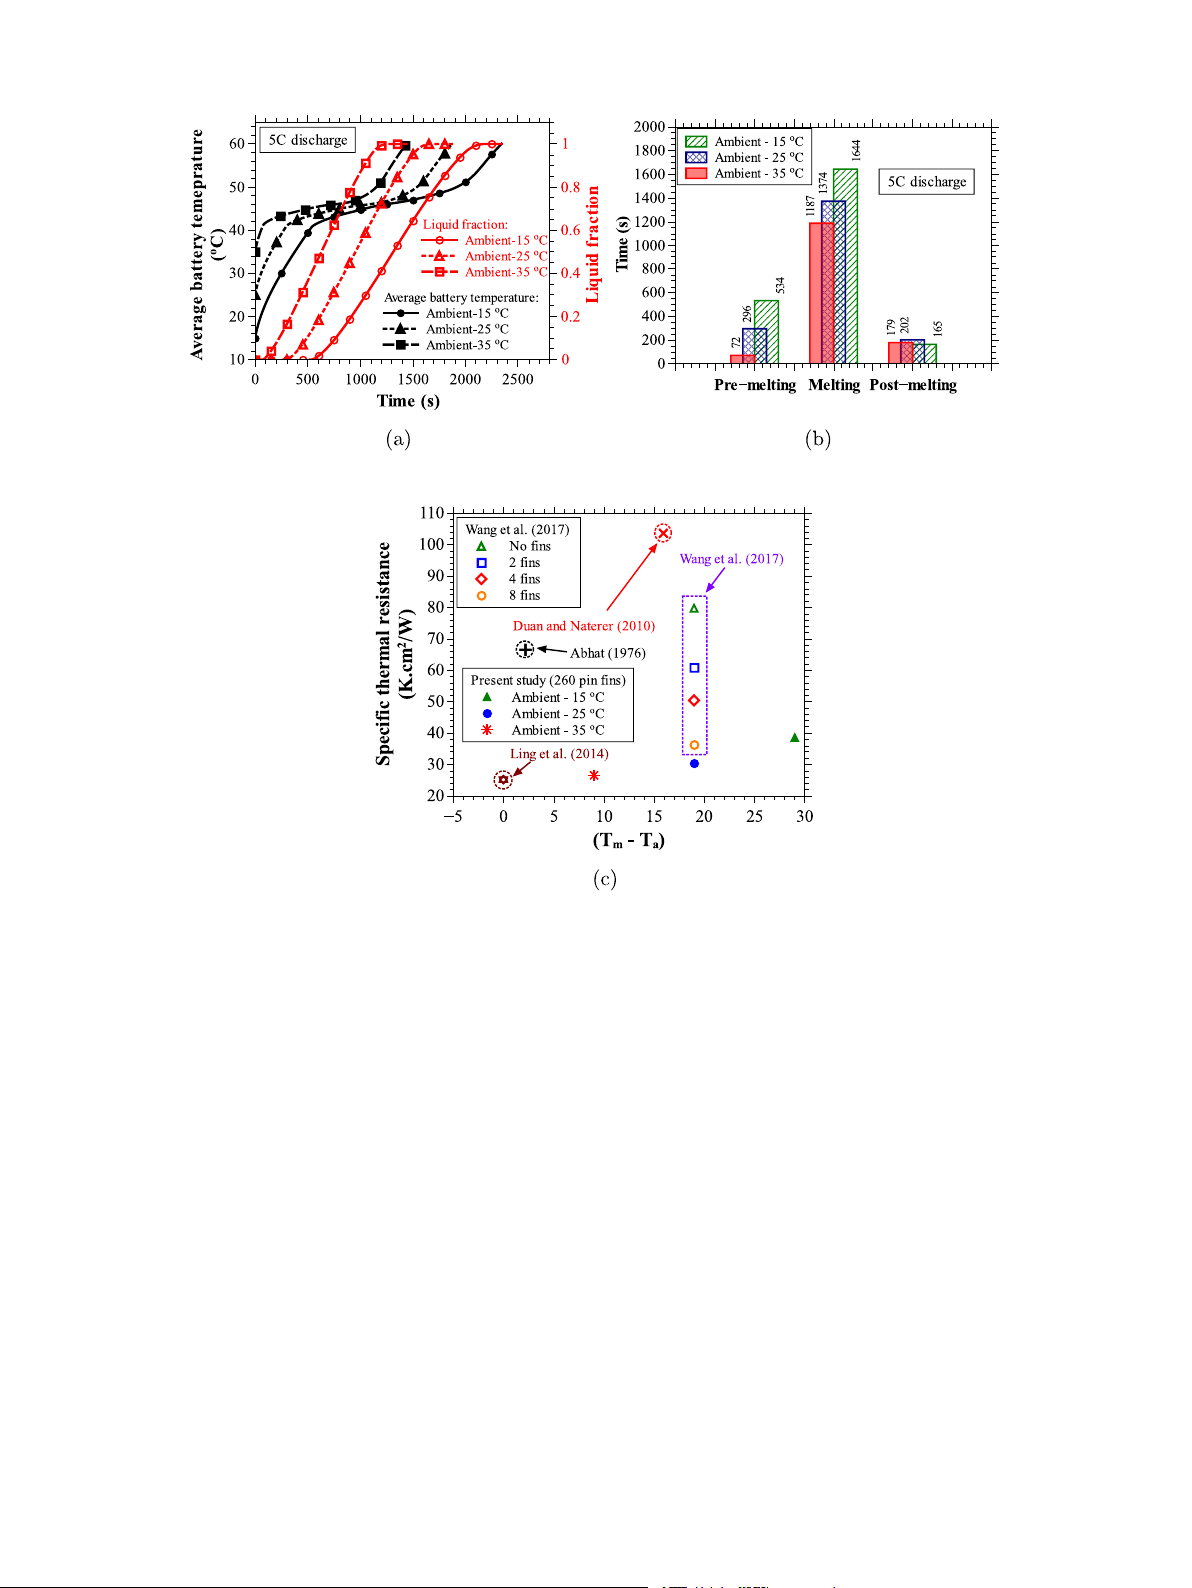
Fig. 14(b) shows the durations recorded for the pre-melting, phase and radiation heat losses.
transition, and post-melting phases when the ambient temperatures are
15, 25, and 35 ◦C. An interesting point to be noted here is that the effect
3.5. Thermal characterization of 260 pin fin heat sink
of ambient temperature is more pronounced on the operating time
during pre-melting phase followed by the melting and post-melting
From above discussion, it is understood that the heat sink with 260-
phases. The amount of time taken by the heat sink to complete the
pin fins outperforms all other heat sink configurations. This section
pre-melting phase is reduced by 86.5% when the ambient temperature
reports the results of parametric studies, conducted numerically, on
is increased from 15 ◦C to 35 ◦C. This is primarily because of equating
the 260 pin fin heat sink for ambient temperatures 15 and 35 ◦C, for
the initial and ambient temperatures. The heat sink takes longer time to
different PCMs, and for discharge rates 3C and 4C (constant heat loads
reach the melting point temperature of the PCM (41 ◦C) for lower initial 4 and 6 W).
temperature, i.e., 15 ◦C compared to the higher initial temperatures,
i.e., 25 and 35 ◦C. During the melting and post melting phases, the
3.5.1. Effect of different ambient conditions
respective starting temperatures of the heat sink for the three ambient
Electric vehicles operate in different geographic regions and differ-
temperatures is almost the same. However, the influence of ambient
ent seasons. As a result, the ambient conditions are subject to change
temperatures is more pronounced on operating time during melting
both geographically and seasonally. The battery pack should have a
phase (a reduction of 27.8% in operating time when the ambient tem-
stable performance regardless of the ambient conditions. In all the
perature is increased from 15 to 25 ◦C) than during post-melting phase.
above comparison studies, the ambient temperature is fixed at 25 ◦C.
This could be attributed to the presence of unmelted PCM near the walls
In this section, the effect of ambient temperatures (15 and 35 ◦C)
of housing at ambient temperature equal to 15 ◦C, which potentially 13 R. Akula et al.
Applied Thermal Engineering 248 (2024) 123146
delays the completion of phase change. During post melting phase,
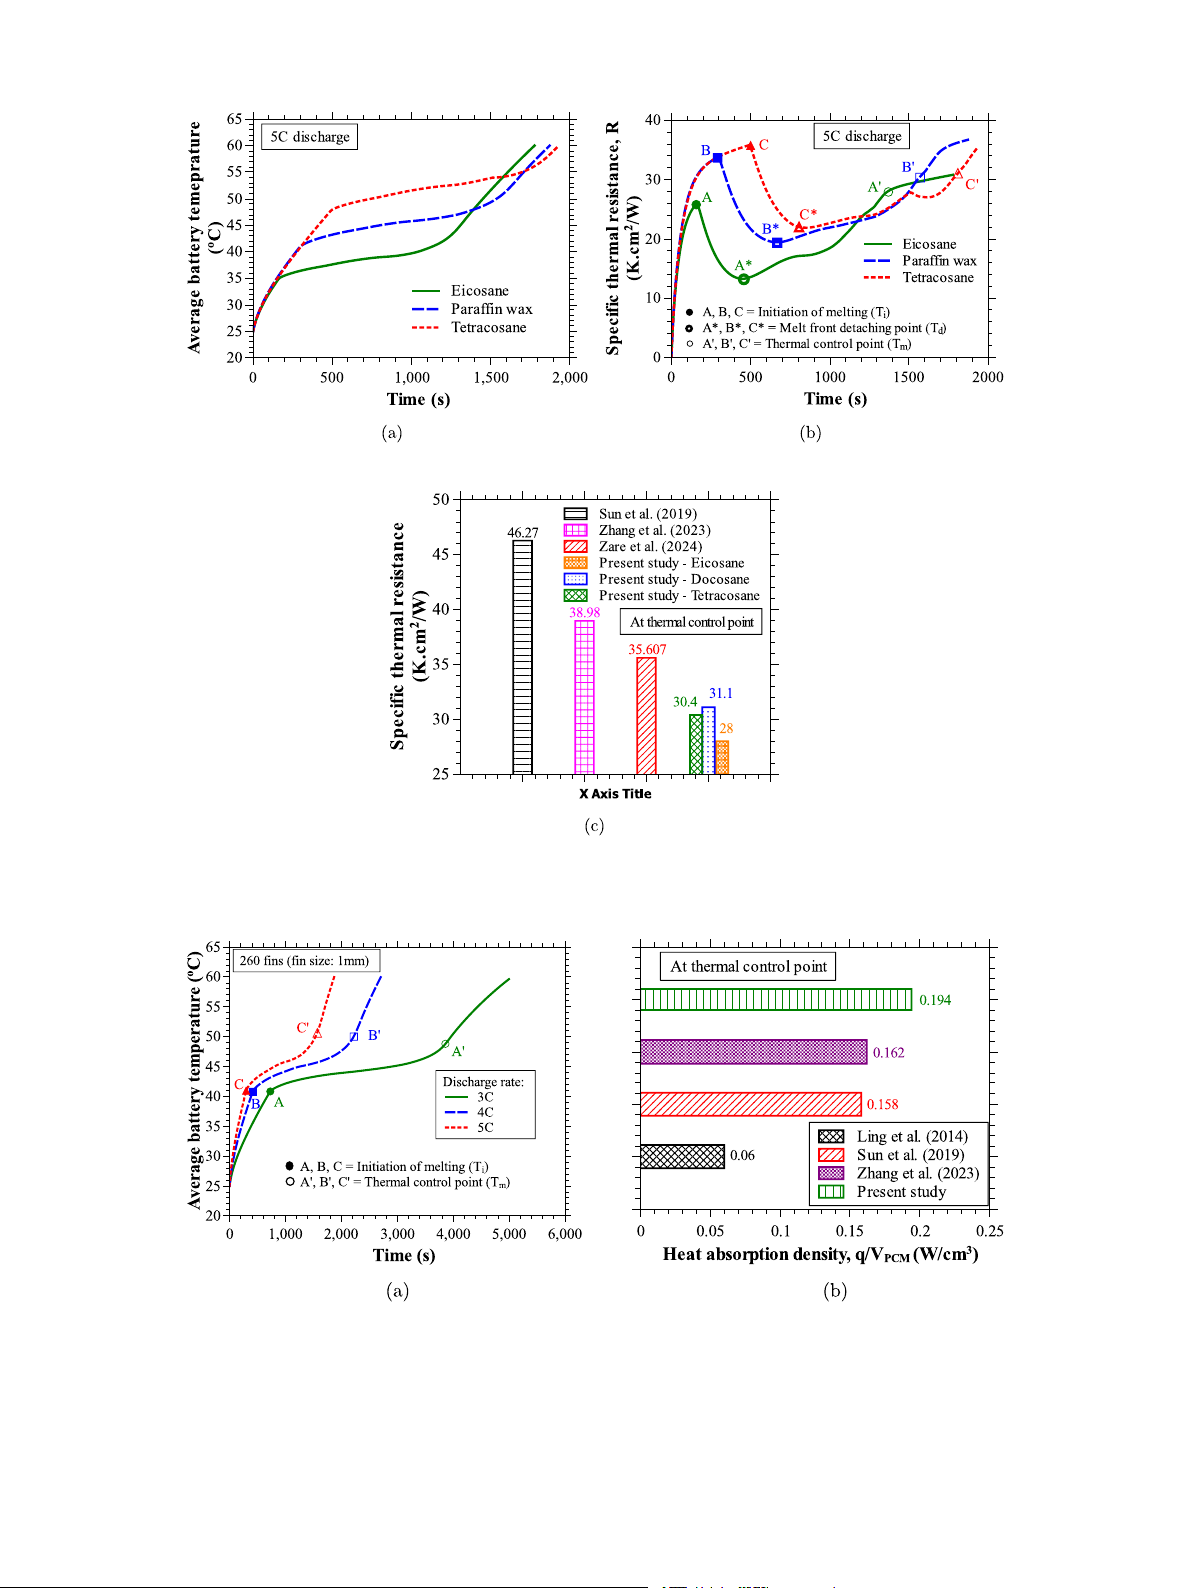
in the thermal resistance. Nevertheless, the thermal resistances at the
the heat sink acts as a insulator due to lower thermal conductivity of
thermal control point of Eicosane, Paraffin, and Tetracosane are equal
the liquid PCM and absence of unmelted PCM. As a result, the surface
to 28, 30.4, and 31.1 K cm2∕W, respectively, which are observed to be
temperatures of the battery are minimally unaffected by the change in
lower than the thermal resistance offered by the heat sinks considered ambient temperatures.
in the studies of Sun et al. [37], Zare et al. [38], and Zhang et al.
Introducing the concept of thermal resistance in a heat sink is an en-
[40]. Sun et al. [37] introduced a novel design consist of longitudinal
gineering approach to evaluate and compare the thermal performance
fins and cylindrical rings for heat transfer enhancement. Zare et al. [38]
of the present heat sink against other heat sinks in literature [35,60].
proposed an innovative combination of internal and external fins to
In the present study, the thermal resistance of the heat sink is defined
create PCM silos around the battery surface. Zhang et al. [40] tested
at the thermal control point using the following equation [35].
nine new branch fin designs to solve the problem of the lightweight ( )
design of metal fins and to strengthen the heat transfer. Fig. 15(c)
𝑇𝐶 − 𝑇𝑚 𝐴𝑏 𝑅
compares the thermal resistance of the best designs in each respective 𝐶𝑚 = (20) 𝑞
studies of Sun et al. [37], Zare et al. [38], and Zhang et al. [40] are
In the above equation, 𝑇𝐶 represents the battery temperature at the
calculated using Eq. (20) and compared against the thermal resistance
thermal control point, and 𝑇𝑚, 𝐴𝑏, and 𝑞 are the liquidus temperature
offered by the present heat sink. From the figure, it is clear that the best
of the PCM, surface area of the battery, and heat load, respectively.
heat sink obtained in the present study offers lower thermal resistance
Fig. 14(c) shows the comparison of specific thermal resistance offered
compared to other heat sinks in literature.
by the present heat sink and the other heat sinks reported by Wang
In any BTMS, the active cooling systems such as air/water cooling
et al. [35], Ling et al. [48], Duan and Naterer [61], and Abhat [62] at
must act as the primary cooling system due to incapability of passive
the thermal control point for different ambient temperatures. The figure
cooling systems including PCM based heat sinks in handling continuous
shows that the heat sink considered in the present study records lower
heat loads with high magnitudes. Nonetheless, the passive cooling
thermal resistance than other heat sinks reported in the literature.
systems can be integrated with active cooling systems to take care of
Further, it is also observed that the thermal resistance of the heat
the extra heat left out by the primary cooling system such that the
sink considered in the present study decreases with an increase in the
size and external power consumption of the primary cooling system
ambient temperature. This leads to an advantage of exhibiting good
can be reduced. The present study focuses only on the characterization
thermal response by the present heat sink even at higher ambient
of PCM based heat sinks during melting in the absence of active temperatures.
cooling system. Further thermal characterization of these heat sinks
during solidification of PCM in the absence of active cooling system is
3.5.2. Effect of different phase change materials
absolutely necessary to finalize the best PCM. From the present study,
The heat sink with 260 fins (fin size: 1 mm) obtained in the above
it is observed that the PCM with a low melting point temperature
discussion is also tested for other phase change materials, namely
is preferred during melting in the absence of active cooling system.
Eicosane and Tetracosane. The thermophysical properties of these
However, in the presence of an active cooling system, the thermal
PCMs are reported in Table 3. Fig. 15(a) compares the average surface
conditions might differ, and a PCM with low melting point temperature
temperature–time history of the battery for three PCMs, Eicosane, might not be optimal.
Paraffin wax, and Tetracosane, for a 5C discharge rate. These numerical
simulations are conducted at initial and ambient temperatures of 25 ◦C.
3.5.3. Effect of different heat loads
From Fig. 15(a), it is clear that the thermal responses of the heat
So far, in the present study, a constant heat load of 8 W was
sinks are aligned to the respective melting point temperatures of the
considered as a heat generation from a Panasonic NCR18650BD battery
PCM. Despite having different phase change temperatures, the heat sink
at a 5C discharge rate. In the present section, the thermal behavior of
records almost the same phase change durations and operating times
the best heat sink obtained above (heat sink having 260 fins with 1 mm
(time to reach set point temperature) due to similar thermophysical
fin size) is characterized by other discharge rates, namely 3C (constant
properties offered by these three PCMs. In addition to the average
heat load of 4 W) and 4C (constant heat load of 6 W), and its thermal
temperature–time histories, the maximum temperature and tempera-
performance is compared against 5C discharge (constant heat load of
ture difference-time histories on the battery surface are also observed. 8 W).
The trend of maximum and average temperatures is almost the same
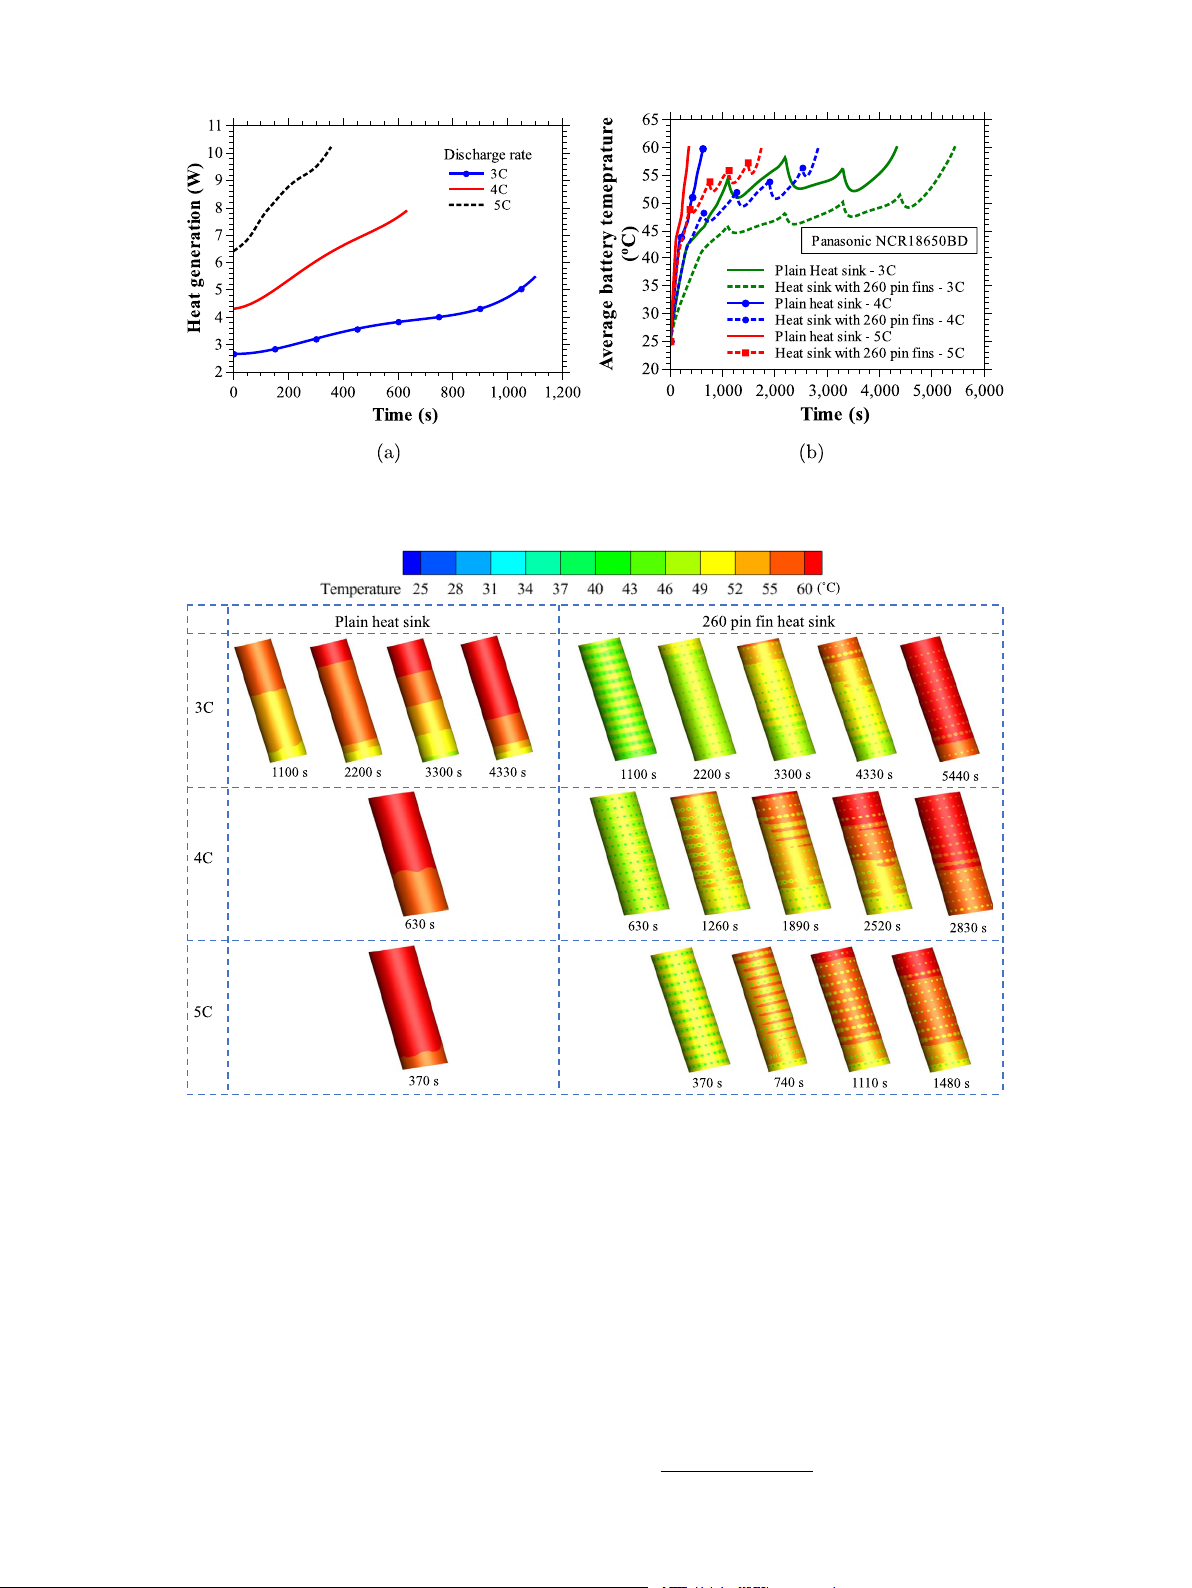
The average surface temperature–time histories obtained numeri-
and the difference between them is just 2 ◦C for all the respective PCMs.
cally from the heat sink with 260 fins of size 1 mm for discharge
Further, the maximum temperature difference is also confined below
rates 3, 4, and 5C are shown in Fig. 16(a). The heat sink registers
2 ◦C with this heat sink employing 260 pin fins.
lower operating times (time to reach set point temperature) for higher
The temperature plateaus observed at the onset of melting and the
discharge rates and vice versa. However, the heat sink attains the
thermal control point are almost equal to the solidus and liquid tem-
same battery temperatures at the initiation of melting and thermal
peratures, respectively, for all PCMs. The elimination of superheating
control points for the three discharge rates considered, which signifies
and the quick response of the heat sink can be attributed to the lower
the capability of swift response of the proposed heat sink to result
thermal resistance offered by the heat sink. The quantified thermal
in higher operating times even for higher discharge rates. The same
resistance of the heat sink can be seen from the plot, which depicts
phenomenon can be further analyzed using a parameter termed heat
the thermal resistance variation with time for the three PCMs (see
absorption density, which is defined as the ratio of heat load (𝑞) to
Fig. 15(b)). The points A, A*, A’, and B, B*, B’, and C, C*, C’ represent
the volume of PCM (𝑉𝑃 𝐶𝑀 ) considered in the heat sink. Heat sinks
onset melting, melt front detach point, and thermal control point for
with higher heat absorption density are preferred in electric vehicle
Eicosane, Paraffin, and Tetracosane, respectively. The melt front detach
applications as they yield high thermal performance even for small
point is the time instant at which the overall battery surface is no longer
amounts of PCM. The characteristic of high heat absorption density
in contact with the melt front of the PCM. The thermal resistance of
eliminates the space constraint and reduces the chances of the cooling
the heat sink for all the PCMs is the lowest at the melt front detach
system being overweighted. Fig. 16(b) compares the heat absorption
point compared to the initiation of melting and thermal control points
density of the present heat sink against the heat sinks proposed by Sun
because of lower battery temperature due to the melt front near the
et al. [37], Zhang et al. [40], and Ling et al. [48]. From the figure, it
battery surface. As the melt front moves away from the battery surface
is clear that the heat sink considered in the present study offers higher
post melt front detach point, the temperature difference between the
heat absorption density over other heat sinks in literature to reach the
battery and the remaining system rises. Consequently, there is a rise thermal control point. 14 R. Akula et al.
Applied Thermal Engineering 248 (2024) 123146
Fig. 14. Comparison of (a) average battery temperature–time histories and liquid fraction-time histories, (b) durations of pre-melting, phase transition, and post-melting, and c)
thermal resistance against heat sinks reported in literature, for 260 pin fin heat sink at ambient temperatures 15, 25, and 35 ◦C.
3.6. Effect of 260 pin fin heat sink on the real battery
numerical methodology using the Newman P2D model, please refer to
our earlier work [15]. Fig. 17(a) shows the temporal variation of the
Till now, a simulated battery made of aluminum with a constant
heat generation calculated using the Newman P2D model for 3, 4, and
heat generation assumption is considered to mimic the thermal behav-
5C discharge rates. The calculated time-varying heat generation has
ior of a real battery. In addition, various heat sinks are tested for the
been given as a volumetric source term in the composite cylindrical rod
thermal management of this simulated battery at 3, 4, and 5C discharge
with dimensions and thermophysical properties the same as that of the
rates. In this section, the best heat sink, i.e., the heat sink with 260 pin
Panasonic NCR18650BD battery. The cylindrical composite material
fins, obtained from the above thermal management studies conducted
with variable heat generation is assumed as the real battery, and its
on the simulated battery is further characterized numerically to study
thermal management is attempted with a 260-pin fin heat sink in this
its thermal regulation capability when the simulated battery is replaced section.
with a real battery. Furthermore, an economic analysis is also presented
The operating durations of the Panasonic NCR18650BD battery for
at the end of this section to discuss the practical feasibility of employing
3, 4, and 5C discharge rates are 1760, 630, and 370 s, respectively.
260 pin fin heat sink in the EVs.
If the temporal evolution of the average temperature on this battery
surface with and without 260 pin fins does not reach the SPT of 60 ◦C
3.6.1. Thermal performance evaluation
An actual Panasonic NCR18650BD battery, with thermophysical
at the end of any discharge rate, the simulation is continued with
properties reported in Table 2, is considered, and the experiments are
the same discharge rate in a loop. The thermal performance of the
conducted to identify its voltage and temperature–time histories for
heat sink is evaluated based on the number discharge cycles completed
0.5, 1, and 2C discharge rates. The electrochemical behavior of the
before reaching the SPT. In the numerical simulations, the initial and
same battery is simulated using the accurate Newman P2D model and
ambient temperatures are fixed at 25 ◦C, and the Paraffin wax is
validated the numerically obtained voltage and temperature variation
chosen as the PCM. Fig. 17(b) shows the average surface temperature–
against in-house experimental results. The validated numerical model
time history of the real battery immersed in PCM, with and without
is used to quantify the time-varying heat generation for 3, 4, and
the addition of 260 pin fins, for 3, 4, and 5C discharge rates. It is
5C discharge rates. For the complete details about the in-house ex-
clear from the figure that the average temperature of the battery stays
periments conducted on the Panasonic NCR18650BD battery and the
below the SPT for five discharge cycles using 260-pin fins for all three 15 R. Akula et al.
Applied Thermal Engineering 248 (2024) 123146
Fig. 15. Comparison of (a) average temperature - time histories, (b) specific thermal resistance-time histories of heat sink with 260 pin fins (1 mm fin size) for different phase
change materials, and (c) thermal resistance offered by the present heat sink filled with different phase change materials against various heat sinks considered in literature [37,38,40] at thermal control point.
Fig. 16. Comparison of (a) average battery temperature–time histories obtained in the present study for 260 pin fin heat sink, and (b) heat absorption densities of 260 pin fin
heat sink against Ling et al. [48], Sun et al. [37], and Zhang et al. [40] at the thermal control point.
discharge rates considered. Whereas in the case of a heat sink without
sink configurations in the case of a 3C discharge rate, the time-averaged
fins, the number of discharge cycles are observed to be 4, 1, and 1
battery temperature of the heat sink with 260 pin fins is 5 ◦C lower than
before reaching the same SPT (60 ◦C) for the same discharge rates
the heat sink configuration without fins. Moreover, the temperature
(3, 4, and 5C), respectively. Though the number of discharge cycles
contours of the battery at the end of every discharge cycle before
completed before reaching the SPT are nearly the same for both heat
reaching SPT of 60 ◦C for 3, 4, and 5C discharge rates demonstrate 16 R. Akula et al.
Applied Thermal Engineering 248 (2024) 123146
Fig. 17. Figure showing (a) heat generation-time history obtained from Panasonic NCR18650BD battery and (b) Average surface temperature–time history of the same battery
with and without addition of 260 pin fins for 3, 4, and 5C discharge rates.
Fig. 18. Temperature contours of Panasonic NCR18650BD battery immersed in Paraffin wax, with and without addition of 260 pin fins, at different time instants before reaching
the SPT of 60 ◦C for 3, 4, and 5C discharge rates.
that the average temperatures and the thermal gradients generated on
3.6.2. Economic analysis
the battery surface are greatly minimized with the addition of 260 pin
This section presents an economic analysis to identify the worth and fins (see Fig. 18).
practical feasibility of employing 260 pin fins on every cell in a battery
Further, the enhancement in the operating time with 260 pin fin
pack. The terms worthiness and the practical feasibility are quantified
heat sink, compared to plain heat sink, is observed to be 1.26, 4.52, and
by thermal performance and cost for fabrication, respectively. Both the
3.96 times higher for the actual battery with variable heat generation
variables are combined into a single variable named Energy Density per
considered in this section and is observed to be 1.23, 2.85, and 1.52
Cost (EDC), which is defined using Eq. (21), as follows [63].
times higher for the simulated battery with constant heat generation
𝐸𝐷𝐶 = Energy density (ED)∕Total cost (21)
considered in all the above sections, when the battery is discharged at
3, 4, and 5C discharge rates, respectively. From the above comparison,
The energy density (ED), i.e., the total available energy that can be
it is understood that the heat sinks designed based on the simulated bat-
extracted from the entire operation of the cell per unit volume, is
tery behavior (results reported in the above sections) works effectively
defined for different C-rates as follows.
for the thermal management of actual batteries with more enhancement
C-rate × 𝑉𝑛 × capacity in the thermal performance. 𝐸𝐷 = × Operating time (22) 𝑣𝑡 17 R. Akula et al.
Applied Thermal Engineering 248 (2024) 123146
The nominal voltage (𝑉𝑛) and capacity of the Panasonic cell considered
Based on various characterization tests, including the effect of ambient
in the present study are 3.6 V and 2.98 Ah, respectively. The total
temperature, PCM type, various magnitudes of heat loads, and the
volumes (𝑣𝑡) occupied by the heat sink without and with 260 pin fins,
applicability for actual batteries, the heat sink with 260 pin fins can
including the cell, are the same and are equal to 49.03 cm3 (Please note
be a potential solution for effective thermal management of cylindrical
that the volume of housing is not considered).
Li-ion batteries. Further, this study is expected to open new vistas
The material cost of PCM and fins, and the fabrication cost of fins
to optimize PCM-based pin fin heat sinks for the maximum thermal
are noted while designing the experimental setup shown in Fig. 13. The
regulation of cylindrical LIBs operating at higher discharge rates.
cost of PCM (Paraffin wax) is 1.3 U.S. dollar/gram ($/g), and the cost
of fin material, i.e., copper, is 8.6 × 10⁻³ $/g. For fabrication of heat
CRediT authorship contribution statement
sink with 260 fins, a total of 13 circular rings, each consisting 20 fins
in the sun rays pattern, are cut using a wire cut EDM machine. The
Rajesh Akula: Writing – review & editing, Writing – original draft,
obtained rings are fastened on the battery at equidistant positions along
Visualization, Validation, Software, Methodology, Investigation, For-
its length. By combining individual material and fabrication costs, the
mal analysis, Data curation, Conceptualization. Abhiram Minnikanti:
overall manufacturing costs (or total cost) of heat sinks without and
Methodology, Investigation, Formal analysis, Data curation, Software,
with 260 fins are 33 $ and 40.5 $, respectively.
Validation, Visualization. C. Balaji: Writing – review & editing, Con-
The values of EDC quantify the availability of energy in 1 cm3
ceptualization, Formal analysis, Methodology, Resources, Supervision.
volume of the battery pack by investing 1 $ on BTMS. The values of
EDC for heat sinks without and with 260 pin fins are calculated using
Declaration of competing interest
Eq. (21) and are equal to 86.13 and 88.39 (J∕cm3)∕$ for 3C, 16.71 and
61.31 (J∕cm3)∕$ for 4C, and 12.27 and 40.08 (J∕cm3)∕$ for 5C discharge
The authors declare that they have no known competing finan-
rates. The results show that the economic advantage with 260 pin fins
cial interests or personal relationships that could have appeared to
is marginal for the 3C discharge rate, however, it is significantly high
influence the work reported in this paper.
for the 4 and 5C discharge rates.
From the results, it is clear that the addition of 260 fins to the Data availability
heat sink is advantageous from an economic standpoint. These fins
significantly increase the surface area available for heat dissipation,
Data will be made available on request.
thereby enhancing the efficiency of the heat sink without substantial
additional cost. By maximizing the thermal performance through this References
cost-effective measure, the overall system can operate more efficiently,
potentially leading to higher energy outcomes and longer lifespan of
[1] K. Chen, J. Hou, M. Song, S. Wang, W. Wu, Y. Zhang, Design of battery thermal the cells.
management system based on phase change material and heat pipe, Appl. Therm. Eng. 188 (2021) 116665. 4. Conclusions
[2] M.-K. Tran, C. Cunanan, S. Panchal, R. Fraser, M. Fowler, Investigation of
individual cells replacement concept in lithium-ion battery packs with analysis
on economic feasibility and pack design requirements, Processes 9 (12) (2021)
In the present study, the thermal behavior of various pin fin-PCM 2263.
composite BTMS was studied numerically, using commercially avail-
[3] A. Ritchie, W. Howard, Recent developments and likely advances in lithium-ion
able Ansys Fluent, for a 5C discharge rate at an ambient temperature
batteries, J. Power Sources 162 (2) (2006) 809–812.
of 25 ◦C with paraffin PCM. The numerical results from all these heat
[4] A. Vyrynen, J. Salminen, Lithium ion battery production, J. Chem. Thermodyn. 46 (2012) 80–85.
sinks were assessed based on two performance metrics: (i) average
[5] S. Kumar, R. Akula, C. Balaji, An inverse methodology to estimate the thermal
surface temperature and (ii) maximum temperature difference on the
properties and heat generation of a Li-ion battery, Appl. Therm. Eng. 236 (2024)
battery surface. The best heat sink obtained from the above analysis 121752.
was validated against in-house experiments within a discrepancy of 5%
[6] M. Shahjalal, T. Shams, M.E. Islam, W. Alam, M. Modak, S.B. Hossain, V. Ra-
madesigan, M.R. Ahmed, H. Ahmed, A. Iqbal, A review of thermal management
and further characterized for different ambient conditions (15 ◦C and
for Li-ion batteries: Prospects, challenges, and issues, J. Energy Storage 39 (2021)
35 ◦C), PCMs (Eicosane and Tetracosane), and discharge rates (3C and 102518.
4C). Based on the above investigations, the major conclusions are as
[7] S. Hong, X. Zhang, K. Chen, S. Wang, Design of flow configuration for parallel follows.
air-cooled battery thermal management system with secondary vent, Int. J. Heat
Mass Transfer 116 (2018) 1204–1212.
(i) Despite having the same volume fraction of fins (2.4%) and heat
[8] K. Chen, Y. Chen, M. Song, S. Wang, Multi-parameter structure design of parallel
transfer area ratio (1.81), the heat sink with 130 fins pin fins
mini-channel cold plate for battery thermal management, Int. J. Energy Res. 44 (6) (2020) 4321–4334.
records 3.3 ◦C and 1 ◦C lower average temperature and thermal
[9] W. Wu, J. Liu, M. Liu, Z. Rao, H. Deng, Q. Wang, X. Qi, S. Wang, An innovative
gradient on the surface of the battery, respectively, compared to
battery thermal management with thermally induced flexible phase change
the heat sink with four plate fins.
material, Energy Convers. Manage. 221 (2020) 113145.
(ii) The pin fin size of 3 mm among various fin sizes (number of fins
[10] M. Malik, I. Dincer, M.A. Rosen, M. Mathew, M. Fowler, Thermal and electrical
= 130) and 260 fins (fin size = 1 mm) among heat sinks with
performance evaluations of series connected li-ion batteries in a pack with liquid
cooling, Appl. Therm. Eng. 129 (2018) 472–481.
different fin numbers are proved to be the best heat sinks in their
[11] Y. Deng, C. Feng, E. Jiaqiang, H. Zhu, J. Chen, M. Wen, H. Yin, Effects of respective categories.
different coolants and cooling strategies on the cooling performance of the power
(iii) From both thermal performance and weight perspectives, a heat
lithium ion battery system: A review, Appl. Therm. Eng. 142 (2018) 10–29.
sink with 260 fins (fin size: 1 mm) delivers the best performance
[12] R. Akula, A. Gopinath, S. Rangarajan, C. Balaji, Experimental and numerical
with a maximum thermal advantage of 15.7 ◦C and 5.4 ◦C over
studies on heat transfer from a PCM based heat sink with baffles, Int. J. Therm. Sci. 159 (2021) 106525.
a heat sink without fins and with 130 pin fins, respectively, for a
[13] A. Anagnostopoulos, M. Navarro, A. Ahmad, Y. Ding, G. Gaidajis, Valorization discharge rate of 5C.
of phosphogypsum as a thermal energy storage material for low temperature
(iv) The thermal resistance for different ambient temperatures is the
applications, J. Clean. Prod. 342 (2022) 130839.
lowest, and heat absorption density for different discharge rates
[14] A. Laforgue, X.-Z. Yuan, A. Platt, S. Brueckner, F. Perrin-Sarazin, M. Toupin,
J.-Y. Huot, A. Mokrini, Effects of fast charging at low temperature on a high
is the highest for the best heat sink obtained in the present study,
energy Li-ion battery, J. Electrochem. Soc. 167 (14) (2020) 140521.
i.e., 260 pin fins (fin size = 1 mm) when compared against other
[15] R. Akula, C. Balaji, Thermal management of 18650 Li-ion battery using novel heat sinks in literature.
fins–PCM–EG composite heat sinks, Appl. Energy 316 (2022) 119048. 18 R. Akula et al.
Applied Thermal Engineering 248 (2024) 123146
[16] L.B. Diaz, A. Hales, M.W. Marzook, Y. Patel, G. Offer, Measuring irreversible
[40] F. Zhang, F. Lu, B. Liang, Y. Zhu, H. Gou, K. Xiao, Y. He, Thermal performance
heat generation in lithium-ion batteries: An experimental methodology, J.
analysis of a new type of branch-fin enhanced battery thermal management PCM
Electrochem. Soc. 169 (3) (2022) 030523.
module, Renew. Energy 206 (2023) 1049–1063.
[17] P.V. Chombo, Y. Laoonual, A review of safety strategies of a Li-ion battery, J.
[41] J. Weng, Y. He, D. Ouyang, X. Yang, G. Zhang, J. Wang, Thermal perfor-
Power Sources 478 (2020) 228649.
mance of PCM and branch-structured fins for cylindrical power battery in a
[18] H. Liu, Z. Wei, W. He, J. Zhao, Thermal issues about Li-ion batteries and recent
high-temperature environment, Energy Convers. Manage. 200 (2019) 112106.
progress in battery thermal management systems: A review, Energy Convers.
[42] X. Chen, W. Yang, J. Shen, X. Xu, F. Zhou, Thermal Performance of hybrid Manag. 150 (2017) 304–330.
battery thermal management system with air cooling and phase change material
[19] A. Mitra, R. Kumar, D.K. Singh, Z. Said, Advances in the improvement of
embedding biomimetic variable section fins, Appl. Therm. Eng. (2023) 120985.
thermal-conductivity of phase change material-based lithium-ion battery thermal
[43] Z. Liu, B. Wang, Y. Tan, P. Li, Thermal management of lithium-ion battery
management systems: An updated review, J. Energy Storage 53 (2022) 105195.
pack under demanding conditions and long operating cycles using fin-enhanced
[20] J. Zhao, C. Wu, Z. Rao, Investigation on the cooling and temperature uniformity
PCMs/water hybrid cooling system, Appl. Therm. Eng. 233 (2023) 121214.
of power battery pack based on gradient phase change materials embedded thin
[44] R. Akula, C. Balaji, Effect of PCM fill ratio and heat sink orientation on the
heat sinks, Appl. Therm. Eng. 174 (2020) 115304.
thermal management of transient power spikes in electronics, J. Phys.: Conf.
[21] A. Verma, D. Rakshit, Performance analysis of PCM-fin combination for heat Ser. 2116 (1) (2021) 012077.
abatement of li-ion battery pack in electric vehicles at high ambient temperature,
[45] Z. Guo, Q. Xu, S. Zhao, S. Zhai, T. Zhao, M. Ni, A new battery thermal
Therm. Sci. Eng. Prog. 32 (2022) 101314.
management system employing the mini-channel cold plate with pin fins, Sustain.
[22] Z.-G. Shen, S. Chen, X. Liu, B. Chen, A review on thermal management
Energy Technol. Assess. 51 (2022) 101993.
performance enhancement of phase change materials for vehicle lithium-ion
[46] S.K. Mohammadian, Y. Zhang, Thermal management optimization of an air-
batteries, Renew. Sustain. Energy Rev. 148 (2021) 111301.
cooled Li-ion battery module using pin-fin heat sinks for hybrid electric vehicles,
[23] V. Mali, R. Saxena, K. Kumar, A. Kalam, B. Tripathi, Review on battery ther-
J. Power Sources 273 (2015) 431–439.
mal management systems for energy-efficient electric vehicles, Renew. Sustain.
[47] Z. Guo, S. Zhao, J. Wang, Y. Wang, S. Zhai, T. Zhao, M. Ni, Novel battery thermal Energy Rev. 151 (2021) 111611.
management system with different shapes of pin fins, Int. J. Energy Res. 46 (5)
[24] F. Samimi, A. Babapoor, M. Azizi, G. Karimi, Thermal management analysis of a (2022) 5997–6011.
Li-ion battery cell using phase change material loaded with carbon fibers, Energy
[48] Z. Ling, J. Chen, X. Fang, Z. Zhang, T. Xu, X. Gao, S. Wang, Experimental 96 (2016) 355–371.
and numerical investigation of the application of phase change materials in a
[25] J. Yan, K. Li, H. Chen, Q. Wang, J. Sun, Experimental study on the application
simulative power batteries thermal management system, Appl. Energy 121 (2014)
of phase change material in the dynamic cycling of battery pack system, Energy 104–113.
Convers. Manage. 128 (2016) 12–19.
[49] U.N. Temel, Passive thermal management of a simulated battery pack at different
[26] S.A. Khateeb, S. Amiruddin, M. Farid, J.R. Selman, S. Al-Hallaj, Thermal
climate conditions, Appl. Therm. Eng. 158 (2019) 113796.
management of li-ion battery with phase change material for electric scooters:
[50] Y. Lyu, A. Siddique, S.H. Majid, M. Biglarbegian, S. Gadsden, S. Mahmud, Electric
experimental validation, J. Power Sources 142 (1–2) (2005) 345–353.
vehicle battery thermal management system with thermoelectric cooling, Energy
[27] Z. Ling, Z. Zhang, G. Shi, X. Fang, L. Wang, X. Gao, Y. Fang, T. Xu, S. Wang, Rep. 5 (2019) 822–827.
X. Liu, Review on thermal management systems using phase change materials
[51] Y. Lyu, A.R.M. Siddique, S.A. Gadsden, S. Mahmud, Experimental investigation of
for electronic components, Li-ion batteries and photovoltaic modules, Renew.
thermoelectric cooling for a new battery pack design in a copper holder, Results
Sustain. Energy Rev. 31 (2014) 427–438. Eng. 10 (2021) 100214.
[28] R. Pakrouh, M. Hosseini, A. Ranjbar, R. Bahrampoury, A numerical method for
[52] M. Mashayekhi, E. Houshfar, M. Ashjaee, Development of hybrid cooling method
PCM-based pin fin heat sinks optimization, Energy Convers. Manage. 103 (2015)
with PCM and Al2O3 nanofluid in aluminium minichannels using heat source 542–552.
model of Li-ion batteries, Appl. Therm. Eng. 178 (2020) 115543.
[29] R. Akula, C. Balaji, Characterization of phase change material-based heat sinks
[53] A.R.M. Siddique, S. Mahmud, B. Van Heyst, A comprehensive review on a passive
for cyclic heat loads, Heat Transf. Eng. (2023) 1–21.
(phase change materials) and an active (thermoelectric cooler) battery thermal
[30] R. Akula, C. Balaji, Thermal performance of a phase change material-based heat
management system and their limitations, J. Power Sources 401 (2018) 224–237.
sink subject to constant and power surge heat loads: a numerical study, J. Therm.
[54] Y. Tomizawa, K. Sasaki, A. Kuroda, R. Takeda, Y. Kaito, Experimental and
Sci. Eng. Appl. 13 (3) (2021) 031014.
numerical study on phase change material (PCM) for thermal management of
[31] A. Castell, C. Solé, M. Medrano, J. Roca, L.F. Cabeza, D. García, Natural
mobile devices, Appl. Therm. Eng. 98 (2016) 320–329.
convection heat transfer coefficients in phase change material (PCM) modules
[55] R. Baby, C. Balaji, Thermal optimization of PCM based pin fin heat sinks: an
with external vertical fins, Appl. Therm. Eng. 28 (13) (2008) 1676–1686.
experimental study, Appl. Therm. Eng. 54 (1) (2013) 65–77.
[32] Z. Khan, Z. Khan, A. Ghafoor, A review of performance enhancement of PCM
[56] S. Madruga, N. Haruki, A. Horibe, Experimental and numerical study of melting
based latent heat storage system within the context of materials, thermal stability
of the phase change material tetracosane, Int. Commun. Heat Mass Transfer 98
and compatibility, Energy Convers. Manag. 115 (2016) 132–158. (2018) 163–170.
[33] U. Stritih, An experimental study of enhanced heat transfer in rectangular PCM
[57] R. Srikanth, P. Nemani, C. Balaji, Multi-objective geometric optimization of a
thermal storage, Int. J. Heat Mass Transfer 47 (12–13) (2004) 2841–2847.
PCM based matrix type composite heat sink, Appl. Energy 156 (2015) 703–714.
[34] S. Mat, A.A. Al-Abidi, K. Sopian, M.Y. Sulaiman, A.T. Mohammad, Enhance
[58] P. Srivatsa, R. Baby, C. Balaji, Numerical investigation of PCM based heat sinks
heat transfer for PCM melting in triplex tube with internal–external fins, Energy
with embedded metal foam/crossed plate fins, Numer. Heat Transfer, A: Appl.
Convers. Manag. 74 (2013) 223–236. 66 (10) (2014) 1131–1153.
[35] Z. Wang, H. Zhang, X. Xia, Experimental investigation on the thermal behavior
[59] V. Voller, C. Prakash, A fixed grid numerical modelling methodology for
of cylindrical battery with composite paraffin and fin structure, Int. J. Heat Mass
convection-diffusion mushy region phase-change problems, Int. J. Heat Mass
Transfer 109 (8) (2017) 958–970.
Transfer 30 (8) (1987) 1709–1719.
[36] J. Weng, D. Ouyang, X. Yang, M. Chen, G. Zhang, J. Wang, Optimization of the
[60] M. Bernagozzi, A. Georgoulas, N. Miche, M. Marengo, Heat pipes in battery
internal fin in a phase-change-material module for battery thermal management,
thermal management systems for electric vehicles: A critical review, Appl. Therm. Appl. Therm. Eng. 167 (2020). Eng. 219 (2023) 119495.
[37] Z. Sun, R. Fan, F. Yan, T. Zhou, N. Zheng, Thermal management of the lithium-
[61] X. Duan, G. Naterer, Heat transfer in phase change materials for thermal
ion battery by the composite PCM-Fin structures, Int. J. Heat Mass Transfer 145
management of electric vehicle battery modules, Int. J. Heat Mass Transfer 53 (2019). (23–24) (2010) 5176–5182.
[38] P. Zare, N. Perera, J. Lahr, R. Hasan, A novel thermal management system
[62] A. Abhat, Experimental investigation and analysis of a honeycomb-packed phase
for cylindrical lithium-ion batteries using internal-external fin-enhanced phase
change material device, in: 11th Thermophysics Conference, 1976, p. 437.
change material, Appl. Therm. Eng. 238 (2024) 121985.
[63] M. Safdari, R. Ahmadi, S. Sadeghzadeh, Numerical and experimental investi-
[39] Z. Sun, R. Fan, N. Zheng, Thermal management of a simulated battery with the
gation on electric vehicles battery thermal management under New European
compound use of phase change material and fins: Experimental and numerical
Driving Cycle, Appl. Energy 315 (2022) 119026.
investigations, Int. J. Therm. Sci. 165 (2021) 106945. 19
Document Outline
- Pin fin-PCM composite heat sink solution for thermal management of cylindrical Li-ion battery
- Introduction
- Numerical methodology
- Physical model
- Heat sink configurations with plate fins
- Heat sink configuration with 130 pin fins
- Heat sink configurations with various pin fins
- Heat generation
- Mathematical formulation
- Initial and boundary conditions
- Grid independence study
- Validation of current numerical methodology
- Physical model
- Results and discussion
- Effect of PCM on the thermal performance of the plain heat sink
- Advantage of pin fins over plate fins
- Effect of volume fraction of pin fins
- Effect of fin size
- Effect of fin number
- Experimental validation of the best performing heat sink
- Thermal characterization of 260 pin fin heat sink
- Effect of different ambient conditions
- Effect of different phase change materials
- Effect of different heat loads
- Effect of 260 pin fin heat sink on the real battery
- Thermal performance evaluation
- Economic analysis
- Conclusions
- CRediT authorship contribution statement
- Declaration of competing interest
- Data availability
- References
Tài liệu liên quan:
-

Ung dung game hoa trong cac chien dich MKT
18 9 -

Bao cao Chi so TMDT Viet Nam 2025
15 8 -

Thông tư quy định về việc phân quyền, phân cấp và phân định thẩm quyền quản lý nhà nước về giáo dục cho chính quyền địa phương
22 11 -
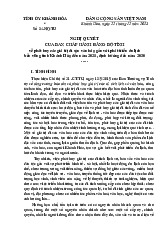
Nghị quyết về phát huy các giá trị di sản văn hóa gắn với phát triên du lịch bền vững tỉnh Khánh Hòa đến năm 2025, định hướng đến năm 2030
12 6 -

Quyết định phê duyệt Chiến lược phát triển du lịch Việt Nam đến năm 2030
12 6