Principles of economics chapter 1,2,3,4
Principles of economics chapter 1,2,3,4
Môn: Kinh tế vi mô (ECO111) 7 tài liệu
Trường: Trường Đại học FPT Hà Nội 62 tài liệu
Tác giả:


Preview text:
lOMoARcPSD|36041561
PowerPoint Lecture Notes for Chapter 1:
Ten Principles of Economics
Principles of Economics 5th edition, by N. Gregory Mankiw
Premium PowerPoint Slides by Ron Cronovich Dear Colleague, C H A P T E R 1
Ten Prin cip les of Econ om ics
Thank you for using the Premium PowerPoints for Mankiw’s
Principles of Economics. I update these approximately once EcP Po R R I n N N C C I o P P L L Em E S S O O Fi F cs
per year, to update the data, fix any typos, and incorporate the N. N Gr G egory Ma M nkiw
best suggestions from users like yourself. If you have any Premium PowerPoint Slides
suggestions, corrections, or feedback, please email me at by Ron Cronovich
rcronovich@carthage.edu. Check the textbook’s website to
© 2009 South-Western, a part of Cengage Learning, all rights reserved
make sure you’re always using the most recent version.
In this area (the “notes” section), I occasionally include notes
that are visible only to you and will not display during your
presentation in class. In slides with data tables or charts, the
notes area provides the source information (often a URL or
web address to the original data). In other slides, the notes
area provides information that might be helpful when teaching
this material, particularly for new instructors and grad assistant teachers.
For chapter 1, most instructors try to cover this chapter in a
single class session (especially those that are teaching the
second of a two-semester sequence). If you are teaching a
“principles of microeconomics” course, you might consider
skipping Principles 8-10, which deal with macroeconomics.
Near the end of the chapter are four slides titled “FYI: How to
Read Your Textbook.” In the notes section of these slides, I
describe an in-class activity that teaches effective reading skills to students. In th is ch ap ter,
look for th e an sw ers to th ese q u estion s:
§ What kinds of questions does economics address?
§ What are the principles of how people make decisions?
§ What are the principles of how people interact?
§ What are the principles of how the economy as a whole works? 5
Downloaded by Nga T??ng (ngahuong55@gmail.com) lOMoARcPSD|36041561
You might want to elaborate a bit on some of the points made
Wh at Econ om ics Is All Ab ou t
§ Scarcity: the limited nature of society’s here. Some examples: resources
§ Economics: the study of how society manages
its scarce resources, e.g. §
“How do people decide how much to work?” Time is scarce
how people decide what to buy,
how much to work, save, and spend
resource – there’s just not enough time to do everything we’d
§ how firms decide how much to produce, how many workers to hire
like to do. How do we decide how much of our time to spend
§ how society decides how to divide its resources
between national defense, consumer goods,
working? There’s a tradeoff: the more time we spend
protecting the environment, and other needs
working, the higher our income, and therefore the more stuff
TEN PRINCIPLES OF ECONOMICS 6
we can buy. But, the more time we spend working, the less
time we have for leisure – hanging out with friends, going
hiking, watching movies, etc. (You might want to ask your
students how THEY decide how much time to spend working.
Some will say it depends on how many classes they are taking,
or the time requirements of the available jobs. But probably at
least a few will say the wage – the higher the wage, the more worthwhile to work.)
“How do firms decide what kind of labor to hire?” Firms can
hire unskilled or skilled workers. The skilled workers are
more productive, but cost more than the unskilled workers.
“How do firms decide how much to produce?” Ask your
students, and see if any of them say “it depends on the price of
the product they sell.” (Probably some will say “it depends on
whether there’s a lot of demand for the product”. To which
you might respond “and if there’s a lot of demand for the
product, what does that mean for the price that firms can get for the product?”)
Decision-making is at the heart of economics. The individual
The principles of H O W P EO PLE
must decide how much to save for retirement, how much to M AKE D D ECIS IO N S
spend on different goods and services, how many hours a week
to work. The firm must decide how much to produce, what
kind of labor to hire. Society as a whole must decide how
much to spend on national defense (“guns”) versus how much
to spend on consumer goods (“butter”).
Downloaded by Nga T??ng (ngahuong55@gmail.com) lOMoARcPSD|36041561
H O W PEO PLE M AKE D ECISIO N S
Principle #1: People Face Tradeoffs
Al decisions involve tradeoffs. Examples:
§ Going to a party the night before your midterm leaves less time for studying.
§ Having more money to buy stuff requires working
longer hours, which leaves less time for leisure.
§ Protecting the environment requires resources
that could otherwise be used to produce consumer goods.
TEN PRINCIPLES OF ECONOMICS 8
H O W PEO PLE M AKE D ECISIO N S
HEADS UP. The 5th edition uses “equality.” The fourth and
Principle #1: People Face Tradeoffs
earlier editions used “equity” here.
§ Society faces an important tradeoff:
efficiency vs. equality
§ Efficiency: when society gets the most from its
You may want to elaborate verbally on the last bullet to insure scarce resources
§ Equality: when prosperity is distributed uniformly that the point is clear. among society’s members
§ Tradeoff: To achieve greater equality,
could redistribute income from wealthy to poor.
But this reduces incentive to work and produce,
“Redistribute income from wealthy to poor” is accomplished
shrinks the size of the economic “pie.”
through the progressive tax system, as well as social programs
TEN PRINCIPLES OF ECONOMICS 9
like food stamps and unemployment insurance that try to
provide a safety net for people at the low end of the income distribution.
“But this reduces the incentive to work” – the reward for
working hard is a high income. Taxes reduce this reward, and
therefore reduce the incentive to work hard.
H O W PEO PLE M AKE D ECISIO N S
Principle #2: The Cost of f Someth thing Is
What You Give Up to Get It
§ Making decisions requires comparing the costs
and benefits of alternative choices.
§ The opportunity cost of any item is
whatever must be given up to obtain it.
§ It is the relevant cost for decision making.
TEN PRINCIPLES OF ECONOMICS 10
Downloaded by Nga T??ng (ngahuong55@gmail.com) lOMoARcPSD|36041561
H O W PEO PLE M AKE D ECISIO N S
Here’s a fun tangent if you have the class time and are so
Principle #2: The Cost of f Someth thing Is inclined:
What You Give Up to Get It Examples: The opportunity cost of…
Ask your students about the saying “The best things in life are
…going to college for a year is not just the tuition,
books, and fees, but also the foregone wages.
free.” Ask them to name some of these things that supposedly
…seeing a movie is not just the price of the ticket,
are free. Ask them what “free” means in this context. The
but the value of the time you spend in the theater.
idea here is to get them to see that even things without an
explicit monetary cost are not truly “free” because they have
TEN PRINCIPLES OF ECONOMICS 11 an opportunity cost.
For example, when you ask them to name the “best things”
that are “free,” they will respond with answers like love, sitting
at the top of a mountain you just climbed and enjoying an
awesome view, or maybe witnessing the joy of a child who has
just been given a new toy. In each case, there is no explicit
monetary cost, but there’s an opportunity cost.
For example, a day spent climbing a mountain represents a day
of foregone wages. And the fact that the mountain offers the
incredible view probably means that land has been set aside for
a national park that might otherwise have been used to produce
industrial chemicals, or for a subdivision of million-dollar homes.
With love, it’s less obvious, but if prodded enough, your
students will be able to think of non-monetary costs associated
with love. For example, you might not want to see the latest
Ashton Kutcher film, you might think he’s the world’s worst
actor. But your boyfriend/girlfriend/teenage daughter or other
loved one is DYING to see it, they are BEGGING you to take
them. So you take them. That’s true love, don’t you think?
And it’s certainly not free.
H O W PEO PLE M AKE D ECISIO N S
Principle #3: Rational People Think at th the Margin Rational people
§ systematically and purposefully do the best they
can to achieve their objectives.
§ make decisions by evaluating costs and benefits
of marginal changes – incremental adjustments to an existing plan.
TEN PRINCIPLES OF ECONOMICS 12
Downloaded by Nga T??ng (ngahuong55@gmail.com) lOMoARcPSD|36041561
H O W PEO PLE M AKE D ECISIO N S
See the textbook for two classic examples:
Principle #3: Rational People Think at th the Margin
1. The diamond-water paradox: water is essential for life but Examples:
§ When a student considers whether to go to
virtually free; diamonds are inessential but expensive.
college for an additional year, he compares the
fees & foregone wages to the extra income
2. The near-zero marginal cost of an airline taking an extra
he could earn with the extra year of education.
passenger when the flight isn’t full.
§ When a manager considers whether to increase
output, she compares the cost of the needed
labor and materials to the extra revenue.
TEN PRINCIPLES OF ECONOMICS 13
H O W PEO PLE M AKE D ECISIO N S
Principle #4: People Respond to to Incenti ti ves
§ Incentive: something that induces a person to
act, i.e. the prospect of a reward or punishment.
§ Rational people respond to incentives. Examples:
§ When gas prices rise, consumers buy more
hybrid cars and fewer gas guzzling SUVs.
§ When cigarette taxes increase, teen smoking falls.
TEN PRINCIPLES OF ECONOMICS 14
Downloaded by Nga T??ng (ngahuong55@gmail.com) lOMoARcPSD|36041561
Most of these PowerPoint chapters have two or three Active A A C C T I V V E E L L E E A A R R N I N G G 1 Ap p lyin g t t h e p p rin cip les
Learning activities. They break up the lecture with a short in-
You are sel ing your 1996 Mustang. You have
already spent $1000 on repairs.
class activity for immediate reinforcement, application, or
At the last minute, the transmission dies. You can
assessment of the material in the preceding slides.
pay $600 to have it repaired, or sell the car “as is.”
In each of the following scenarios, should you
A good idea is to give students time to formulate their answers
have the transmission repaired? Explain.
before asking for volunteers to share their answers with the
A. Blue book value is $6500 if transmission works, $5700 if it doesn’t
class. When the questions or exercises are more complex,
B. Blue book value is $6000 if transmission works, $5500 if it doesn’t
consider having them work in pairs. 15
Digression on class participation:
In general, it’s not a good idea to try to solicit participation by
saying “Now who can tell me the answer to….”. The
invariable result is regular participation by very few students –
the quick thinkers who have the confidence to answer
spontaneously in front of the class – while most students remain silent.
When students have a bit of time to think through their
answers, they are more likely to be comfortable sharing their
answers with you and the class.
Even better: try a simple, time-tested activity called “THINK-
PAIR-SHARE.” Pair students up. Pose a question or
problem. Have students work on the problem individually for
a couple minutes. Then, allow a couple minutes to work in
pairs: each student tries to explain to the other why his or her
answer is correct, and the other offers feedback. In many
cases, they come up with better answers by working together.
Finally, ask for volunteers. Students are much more likely to
participate since they have had the opportunity to “test” their
answers on a classmate. And those who do not participate will
at least have had the chance to share their answer with, and get
feedback from, one other student.
Activities like these are useful to break up a lecture every 20
minutes or so. They help maintain students’ attention spans,
and increase their comprehension of the material you cover.
These activities are also useful for quick, informal assessment
– often, they will alert you to problems (such as students not
getting what you think they’re getting) which you can then
correct before moving on to cover additional material. End of digression.
Downloaded by Nga T??ng (ngahuong55@gmail.com) lOMoARcPSD|36041561 A A C C T I V V E E L L E E A A R R N I N G G 1 An sw ers
Cost of fixing transmission = $600
A. Blue book value is $6500 if transmission works, $5700 if it doesn’t
Benefit of fixing the transmission = $800 ($6500 – 5700).
It’s worthwhile to have the transmission fixed.
B. Blue book value is $6000 if transmission works, $5500 if it doesn’t
Benefit of fixing the transmission is only $500.
Paying $600 to fix transmission is not worthwhile. 16
If you wish, you can omit this slide and just give this A A C C T I V V E E L L E E A A R R N I N G G 1 An sw ers
information to the class verbally. Observations:
§ The $1000 you previously spent on repairs is
irrelevant. What matters is the cost and benefit
of the marginal repair (the transmission).
§ The change in incentives from scenario A
to scenario B caused your decision to change. 17
Whether we’re talking about the U.S. economy, or the local
The principles of
economy, the term “economy” simply means a group of people H O W PEO PLE IN TERACT interacting with each other.
These interactions play a critical role in the allocation of
society’s scarce resources. For example, the interaction of
buyers and sellers determines the prices of goods and the
amounts produced and sold. These interactions are an
important part of what economists study.
Downloaded by Nga T??ng (ngahuong55@gmail.com) lOMoARcPSD|36041561 H O W PEO PLE IN TERACT
If each person had to grow his own food, make his own
Principle #5: Trade Can Make Everyone
clothes, cut his own hair, we would have a world full of Bett tter Off ff
skinny, unfashionable poor people having bad hair days every
§ Rather than being self-sufficient,
people can specialize in producing one good or day of the week.
service and exchange it for other goods.
§ Countries also benefit from trade & specialization:
§ Get a better price abroad for goods they produce
It’s far more efficient for each person to specialize in
§ Buy other goods more cheaply from abroad than could be produced at home
producing a good or service, and then exchanging it with other
people for the things they produce.
TEN PRINCIPLES OF ECONOMICS 19
The statement “trade can make everyone better off” should not
be hard to understand, if you think about it for a moment:
Each of two parties would not voluntarily enter into an
exchange if it made either of them worse off, now would they?
The same principles apply at the national and international
level: International trade allows countries to sell their exports
abroad and get a higher price, and to buy things from abroad
more cheaply than they could produce at home.
In addition, trade gives a country’s consumers access to a
greater variety of goods – including goods they might not be
able to get at all. For example, U.S. consumers enjoy a variety
of fresh produce year-round. This would not be possible without international trade. H O W PEO PLE IN TERACT
A market economy is “decentralized,” meaning that there is no
Principle #6: Markets Are Usually A Good
government committee that makes the decisions about what Way to Organize ze Economic Activity
goods to produce and so forth. Instead, many households and
§ Market: a group of buyers and sellers
(need not be in a single location)
firms make their own decisions:
§ “Organize economic activity” means determining § what goods to produce § how to produce them
* Each of many households decides who to work for and what § how much of each to produce § who gets them goods to buy.
TEN PRINCIPLES OF ECONOMICS 20
* Each of many firms decides whom to hire and what goods to produce.
Downloaded by Nga T??ng (ngahuong55@gmail.com) lOMoARcPSD|36041561 H O W PEO PLE IN TERACT
In all versions of this textbook except Brief Principles of
Principle #6: Markets Are Usually A Good
Macroeconomics, market efficiency and the invisible hand are Way to Organize ze Economic Activity
covered more thoroughly in Chapter 7.
§ A market economy allocates resources through
the decentralized decisions of many households
and firms as they interact in markets.
§ Famous insight by Adam Smith in
The Wealth of Nations (1776):
Each of these households and firms
acts as if “led by an invisible hand”
to promote general economic well-being.
TEN PRINCIPLES OF ECONOMICS 21 H O W PEO PLE IN TERACT
Principle #6: Markets Are Usually A Good Way to Organize ze Economic Activity
§ The invisible hand works through the price system:
§ The interaction of buyers and sellers determines prices.
§ Each price reflects the good’s value to buyers
and the cost of producing the good.
§ Prices guide self-interested households and
firms to make decisions that, in many cases,
maximize society’s economic well-being.
TEN PRINCIPLES OF ECONOMICS 22 H O W PEO PLE IN TERACT
[“Govt” is an abbreviation for government. Throughout all of
Principle #7: Governments ts Can Someti times
the Premium PowerPoint chapters, I try to use abbreviations Improve Market t Outcomes
the way a thoughtful instructor would use them if writing on a
§ Important role for govt: enforce property rights (with police, courts)
chalkboard. If you prefer to spell the word out, just use your
§ People are less inclined to work, produce, invest,
or purchase if large risk of their property being
mouse to highlight “govt” and then type out the full word.] stolen.
Two examples of the idea in the second bullet point:
A restaurant won’t serve meals if customers do not pay before
TEN PRINCIPLES OF ECONOMICS 23 they leave.
A music company won’t produce CDs if too many people
avoid paying by making illegal copies.
Many fledging market economies are struggling through the
transition from central planning because they have not
developed institutions that protect and enforce property rights.
The British news magazine The Economist has lots of current
examples of this. An older but still interesting example comes
from a column that Mankiw wrote in the June 12, 2000 issue
of Fortune magazine entitled “Ukraine: How Not To Run An Economy.”
Downloaded by Nga T??ng (ngahuong55@gmail.com) lOMoARcPSD|36041561 H O W PEO PLE IN TERACT
Principle #7: Governments ts Can Someti times Improve Market t Outcomes
§ Market failure: when the market fails to allocate
society’s resources efficiently § Causes:
§ Externalities, when the production or consumption
of a good affects bystanders (e.g. pollution)
§ Market power, a single buyer or seller has
substantial influence on market price (e.g. monopoly)
§ In such cases, public policy may promote efficiency.
TEN PRINCIPLES OF ECONOMICS 24 H O W PEO PLE IN TERACT
Principle #7: Governments ts Can Someti times Improve Market t Outcomes
§ Govt may alter market outcome to promote equity
§ If the market’s distribution of economic well-being
is not desirable, tax or welfare policies can change
how the economic “pie” is divided.
TEN PRINCIPLES OF ECONOMICS 25
The items in this list are meant to get students thinking about A A C C T I V V E E L L E E A A R R N I N G G 2 D iscu ssion Q Q u estion s
Principles 6 and 7 in the context of specific examples, and to
In each of the following situations, what is the
government’s role? Does the government’s
generate discussion rather than arrive at definitive answers.
intervention improve the outcome?
NOTE: Discussing the entire list would consume a lot of
a. Public schools for K-12
b. Workplace safety regulations
class time (20-25 minutes). Two would suffice. Pick your
c. Public highways
favorite two and delete the others. Of course, you can skip
d. Patent laws, which allow drug companies to
charge high prices for life-saving drugs
this slide entirely if you wish to get through the chapter as quickly as possible. 26
Here are some notes which might help guide the discussion:
a. Public schools. The alternative would be private schools.
The cost of education would be concentrated among those with
school-aged children, rather than spread over all taxpayers, so
the price per child would likely be high. Some families would
not be able to afford to enroll their children in schools, and
would either home-school the children or raise them without
education. Is the benefit to society of having an educated
population large enough to justify making people without
children share in the cost? Could the private sector provide
education more efficiently (either at lower cost or higher
quality) than the public sector?
b. Workplace safety regulations. Without such regulations,
would firms provide a safe environment for their workers?
Some students will say “no – look at how bad working
Downloaded by Nga T??ng (ngahuong55@gmail.com) lOMoARcPSD|36041561
conditions are in poor countries which have no safety
regulations.” Another view is dropping such regulations
would make workers better off. Workers may view the safety
of their work environment as part of their wage: the less safe
the environment at a specific firm, the higher the wage the firm
will have to offer to make workers willing to work there. If
workers vary with respect to their tolerance for unsafe
conditions, then workers with a high risk tolerance would be
better off if given the option to work for higher wages in
factories that aren’t as safe. Such workers would be worse off
if the government required all firms to provide equally safe conditions.
c. Public highways. The alternative would be toll highways
operated by the private sector. People who use highways more
would pay more, and people that use them less would pay less,
which seems fairer than having everyone pay equally for
highways. (Actually, everyone does not pay equally - people
who use public roads more buy more gas, and therefore pay
more gas tax.) If there are external benefits to society of
having a national highway system, then the private sector
would under-provide this good.
d. Patent laws. I’ve kind of loaded the question with the
wording on the slide. If you wish, change it to just “Patent
laws.” Is it fair that drug companies charge such high prices
for drugs that some people need to stay alive? If drug prices
are regulated, how might pharmaceutical firms respond?
The principles of H OW TH E ECO N OM Y Y AS A WH O LE WO RKS
Downloaded by Nga T??ng (ngahuong55@gmail.com) lOMoARcPSD|36041561
H O W TH E ECO N O M Y AS A WH O LE WO RKS
“Rich countries” refers to countries like the U.S., Japan, and Principle #8: A countr tr y’s standard of f living Germany. depends on its ability ty to to produce goods & services.
§ Huge variation in living standards across
“Poor countries” refers to countries like India, Indonesia, and countries and over time:
§ Average income in rich countries is more than Nigeria.
ten times average income in poor countries.
§ The U.S. standard of living today is about
eight times larger than 100 years ago.
TEN PRINCIPLES OF ECONOMICS 28
H O W TH E ECO N O M Y AS A WH O LE WO RKS Principle #8: A countr tr y’s standard of f living depends on its ability ty to to produce goods & services.
§ The most important determinant of living standards:
productivity, the amount of goods and services produced per unit of labor.
§ Productivity depends on the equipment, skills, and
technology available to workers.
§ Other factors (e.g., labor unions, competition from
abroad) have far less impact on living standards.
TEN PRINCIPLES OF ECONOMICS 29
H O W TH E ECO N O M Y AS A WH O LE WO RKS
Principle #9: Prices rise when th the government t prints to to o much money.
§ Inflation: increases in the general level of prices.
§ In the long run, inflation is almost always caused by
excessive growth in the quantity of money, which
causes the value of money to fall.
§ The faster the govt creates money,
the greater the inflation rate.
TEN PRINCIPLES OF ECONOMICS 30
Downloaded by Nga T??ng (ngahuong55@gmail.com) lOMoARcPSD|36041561
H O W TH E ECO N O M Y AS A WH O LE WO RKS
While the long-run effect of increasing the quantity of money Principle #10: : Society ty faces a short- t-run
is inflation, the short-run effects are more complicated - and tr tr adeoff
ff between inflation and unemployment
controversial. However, most mainstream economists believe
§ In the short-run (1 – 2 years),
many economic policies push inflation and
the following: An increase in the quantity of money causes
unemployment in opposite directions.
§ Other factors can make this tradeoff more or less
spending to rise, which causes prices to rise, which induces
favorable, but the tradeoff is always present.
firms to produce more goods and services, which requires that
they hire more workers. Hence, in the short-run, increasing
the quantity of money causes inflation to rise, but
TEN PRINCIPLES OF ECONOMICS 31 unemployment to fall.
Of course, REDUCING the quantity of money would have the
opposite effects (inflation would fall, while unemployment would rise) in the short run.
Keep in mind, though, the lesson from Principle #9: In the
long run, changing the quantity of money only affects
inflation. We will learn in a later chapter what determines the
rate of unemployment in the long run, and we will see that it
has nothing to do with the quantity of money.
The second bullet addresses the following point: In some
decades, due to factors outside of the control of policymakers,
inflation and unemployment are both high (e.g. 1970s) – or
low (e.g. 1990s). Yet, given these other factors, policymakers
can always reduce unemployment temporarily by creating
more inflation, or vice versa.
FYI: H ow to Read You r Textb ook
Most new college students have not been taught good study 1. Read before class.
skills, yet we professors often assume they have such skills.
You’ll get more out of class.
This is the first of four slides that summarize an FYI box
2. Summarize, don’t highlight.
Highlighting is a passive activity that won’t improve
which describes proven strategies for learning and retention.
your comprehension or retention.
Instead, summarize each section in your own
words. Then, compare your summary to the one at the end of the chapter.
If you’re pressed for time, you can of course skip these slides,
but please urge your students to read this FYI box.
TEN PRINCIPLES OF ECONOMICS 32
But if you can spare 30 minutes of class time, there’s a very
effective activity you can do in class which lets students see
for themselves the power of active reading and teaching a
partner. I describe this activity in the notes section of the
fourth “FYI: How to Read Your Textbook” slide. This
activity could replace showing these four slides in class,
though your students should still read the corresponding FYI box in the book.
Downloaded by Nga T??ng (ngahuong55@gmail.com) lOMoARcPSD|36041561
FYI: H ow to Read You r Textb ook
If you do not like “They are often good practice for the 3. Test yourself.
exams,” please feel free to delete it. I’ve found, though, that
Try the “Quick Quiz” that follows each section before
moving on to the next section.
students are more motivated to work practice problems when
Write your answers down, compare them to the
answers in the back of the book. If your answers
they think that doing so will help them earn a higher score on
are incorrect, review the section before moving on. the exam.
4. Practice, practice, practice.
Work through the end-of-chapter review questions
and problems. They are often good practice for the
exams. And the more you use your new knowledge, the more solid it will become.
TEN PRINCIPLES OF ECONOMICS 33
FYI: H ow to Read You r Textb ook
If your classroom computer has a live internet connection, you 5. Go online.
should be able to click on the link and visit the textbook’s
The book comes with excellent web resources,
including practice quizzes, tools to strengthen your
website. It’s worth taking 2-3 minutes of class time to show
graphing skills, helpful video clips, and other
resources to help you learn the textbook material students the resources there.
more easily and effectively. Visit:
http://academic.cengage.com/economics/mankiw 6. Study in groups.
Get together with a few classmates to review each
chapter, quiz each other, and help each other understand the material.
TEN PRINCIPLES OF ECONOMICS 34
FYI: H ow to Read You r Textb ook
Here’s the activity I mentioned a few slides back. I have used 7. Teach someone.
it many times with terrific results.
The best way to learn something is to teach it to
someone else, such as a study partner or friend.
8. Don’t skip the real world examples.
Read the Case Studies and “In The News” boxes in
Find two newspaper articles on topical economic issues. The
each chapter. They will help you see how the new
terms, concepts, models, and graphs apply to the
articles must be (1) short enough that a beginning college
real world. As you read the newspaper or watch the
student can read either of them in 10 minutes or less, (2)
evening news, see if you can find the connections
with what you’re learning in the textbook.
appropriate for the lay reader, and (3) very interesting. Make
enough copies for all students in your class. Use different
TEN PRINCIPLES OF ECONOMICS 35
colored paper for each article, e.g. yellow for Article 1 and
blue for Article 2. In class, instruct students to pair up. In
each student pair, one student is assigned Article 1, the other
assigned Article 2. Tell students they will have 15 minutes to
read their assigned article. Then, each student will have 5
minutes to teach the contents of his or her article to his or her
partner. Tell students it is not acceptable to merely give a
paragraph-by-paragraph summary when teaching their articles to their partner.
Use your timer or a watch to announce when the 15 minutes
are up and it’s time to start teaching. Five minutes later,
announce when it’s time for the other student to teach his/her
article. Five minutes later, stop the activity and re-group as a
class. Ask your students the following four questions.
Downloaded by Nga T??ng (ngahuong55@gmail.com) lOMoARcPSD|36041561
PowerPoint Lecture Notes for Chapter 2:
Thinking Like An Economist
Principles of Economics 5th edition, by N. Gregory Mankiw
Premium PowerPoint Slides by Ron Cronovich
Besides introducing students to the economic way of thinking, C H A P T E R 2
this chapter introduces the Production Possibilities Frontier,
Th in k in g Lik e An Econ om ist
the first of many graphs covered in the textbook. The PPF
will be used extensively in Chapter 3 (Interdependence and EcP Po R R I Nn N C C I o P P L L Em S S O O i F cs the Gains from Trade). N. N Gr G eg e ory Ma M nkiw Premium PowerPoint Slides
It would be helpful to ask your students to bring calculators to by Ron Cronovich
© 2009 South-Western, a part of Cengage Learning, all rights reserved
class on the day you cover this chapter (as well as Chapter 3). In th is ch ap ter,
look for th e an swers to th ese q u estion s:
§ What are economists’ two roles? How do they differ?
§ What are models? How do economists use them?
§ What are the elements of the Circular-Flow Diagram?
What concepts does the diagram illustrate?
§ How is the Production Possibilities Frontier related
to opportunity cost? What other concepts does it illustrate?
§ What is the difference between microeconomics and
macroeconomics? Between positive and normative? 5
T h e Econ om ist as Scien tist § Economists play two roles:
1. Scientists: try to explain the world
2. Policy advisors: try to improve it
§ In the first, economists employ the scientific method,
the dispassionate development and testing of
theories about how the world works.
THINKING LIKE AN ECONOMIST 6
Assu m p tion s & M od els
§ Assumptions simplify the complex world, make it easier to understand.
§ Example: To study international trade,
assume two countries and two goods.
Unrealistic, but simple to learn and
gives useful insights about the real world.
§ Model: a highly simplified representation of a more complicated reality.
Economists use models to study economic issues.
THINKING LIKE AN ECONOMIST 7
Downloaded by Nga T??ng (ngahuong55@gmail.com) lOMoARcPSD|36041561
Som e Fam iliar M od els A road map
THINKING LIKE AN ECONOMIST 8
Som e Fam iliar M od els A model of human anatomy from high school biology class
THINKING LIKE AN ECONOMIST 9
Som e Fam iliar M od els A model airplane
THINKING LIKE AN ECONOMIST 10
Som e Fam iliar M od els The model teeth at the Don’t f or get dentist’s office t o f loss!
THINKING LIKE AN ECONOMIST 11
Downloaded by Nga T??ng (ngahuong55@gmail.com) lOMoARcPSD|36041561 O u r Fir st M od el:
Th e Ci rcu lar-Flow D iagram
§ The Circular-Flow Diagram: a visual model of
the economy, shows how dollars flow through
markets among households and firms § Two types of “actors”: § households § firms § Two markets:
§ the market for goods and services
§ the market for “factors of production”
THINKING LIKE AN ECONOMIST 12
The “definition” of capital shown on this slide (“buildings Factors of Prod u ction
§ Factors of production: the resources the
and machines”) is the same that appears in the corresponding
economy uses to produce goods & services, including
section of the chapter. A more formal definition will be § labor § land
provided in subsequent chapters.
§ capital (buildings & machines used in production)
THINKING LIKE AN ECONOMIST 13
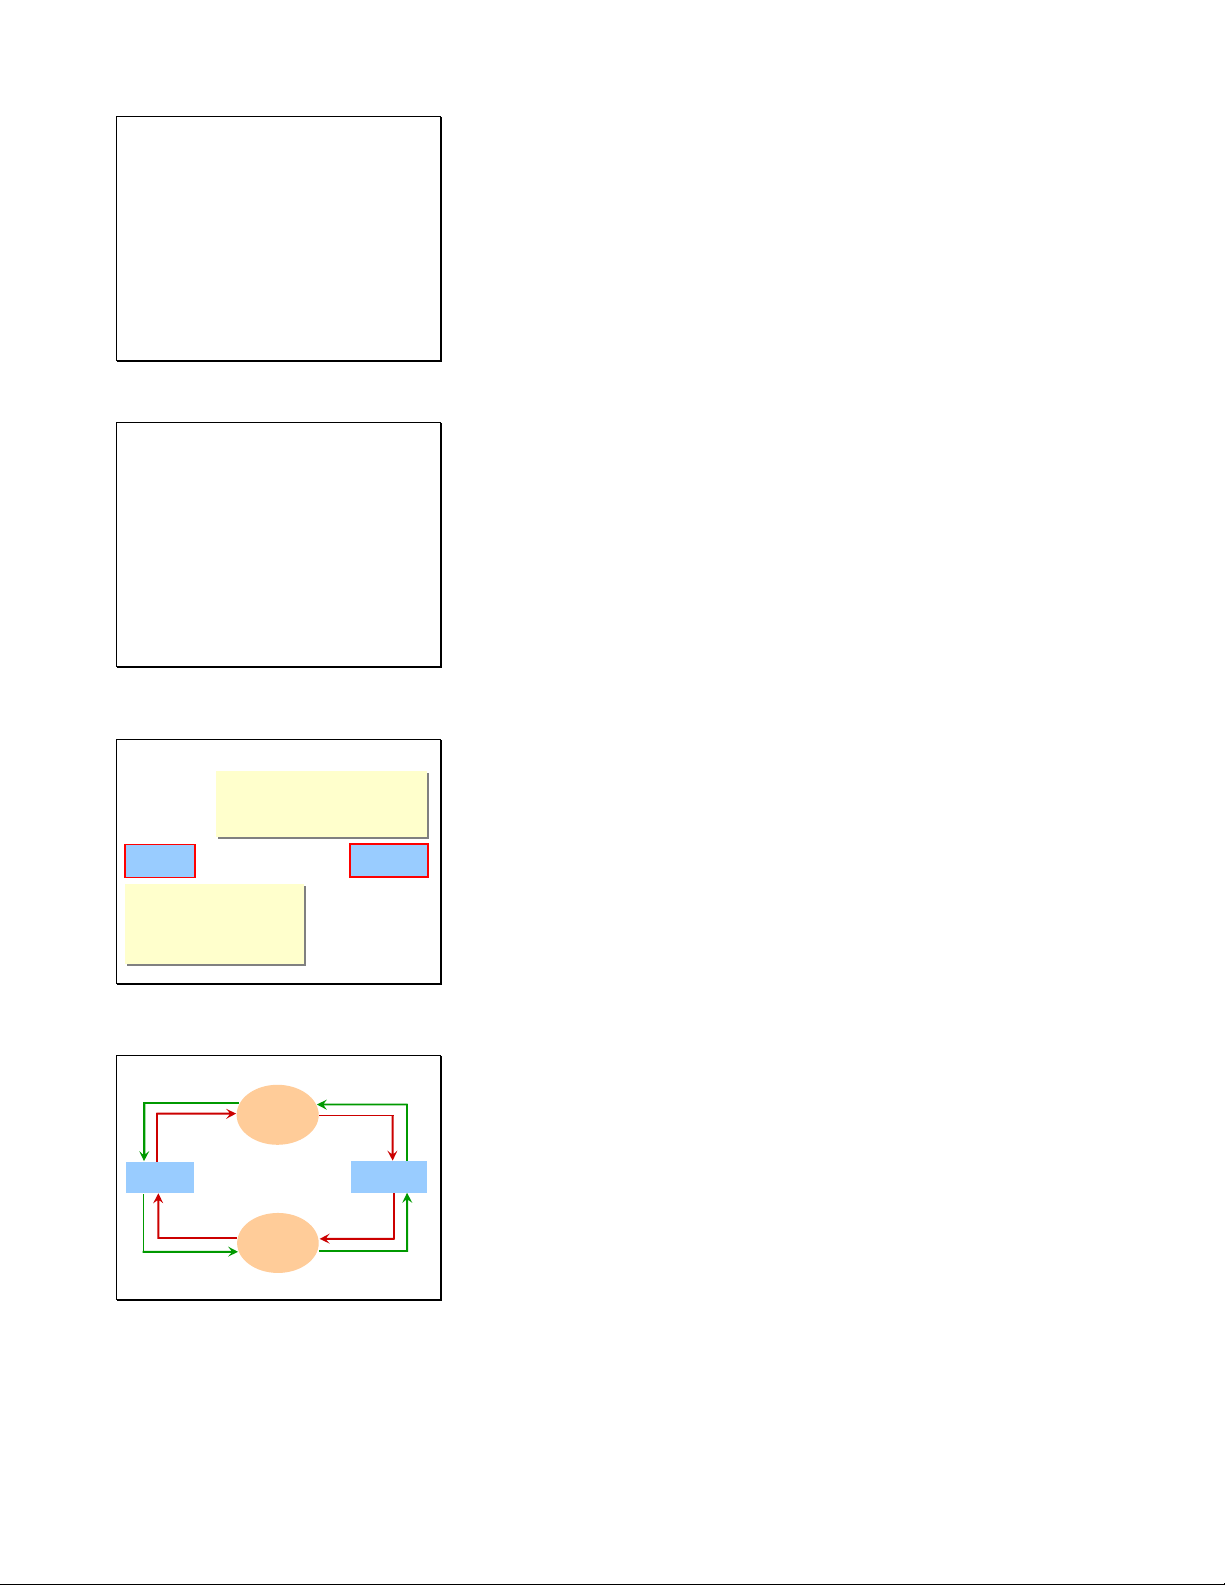
FIG URE 1: The Circular-Flow Diagram
This and the following slide build the Circular-Flow Diagram Households: piece by piece. § Own th th e fa fa ctors of p f p roduction, sell/r /r ent th t th em to to fi fi rms fo fo r income § Buy and c c onsume g g oods & services Firms Households Firms: § Buy/h /h ire facto to rs of production, , use them to to produce goods and services § Sell g g oods & & services
THINKING LIKE AN ECONOMIST 14
FIG URE 1: The Circular-Flow Diagram
In this diagram, the green arrows represent flows of Revenue Spending Markets for
income/payments. The red arrows represent flows of goods G & S Goods & G & S sold Services bought
& services (including services of the factors of production in
the lower half of the diagram). Firms Households Factors of Labor, land, production Markets for capital
To keep the graph simple, we have omitted the government, Factors of Wages, rent, Production Income
financial system, and foreign sector, as discussed on the next profit
THINKING LIKE AN ECONOMIST 15 slide.
You may wish to change the order in which the elements
appear. To do so, look for “Custom Animation” in your version of PowerPoint.
Downloaded by Nga T??ng (ngahuong55@gmail.com) lOMoARcPSD|36041561 O u r Secon d M od el:
Th e P rod u ct ion Possib ili ties Fron tier
§ The Production Possibilities Frontier (PPF):
a graph that shows the combinations of
two goods the economy can possibly produce
given the available resources and the available technology § Example:
§ Two goods: computers and wheat
§ One resource: labor (measured in hours)
§ Economy has 50,000 labor hours per month available for production.
THINKING LIKE AN ECONOMIST 16 PPF Exam p le Suggestion:
§ Producing one computer requires 100 hours labor.
Show first row. Explain how we get the production numbers
§ Producing one ton of wheat requires 10 hours labor. Employment of
from the employment numbers. Then, show the rest of the Production labor hours
employment numbers, and give students 3 minutes to Computers Wheat Computers Wheat A 50,000 0 500 0
compute the production numbers for each employment B 40,000 10,000 400 1,000 allocation. C 25,000 25,000 250 2,500 D 10,000 40,000 100 4,000 E 0 50,000 0 5,000 PPF Exam p le Wheat Point Production (tons) on Com- 6,000 graph Wheat puters E 5,000 A 500 0 D 4,000 B 400 1,000 3,000 C C 250 2,500 2,000 D 100 4,000 B 1,000 E 0 5,000 A 0 0 100 200 300 400 500 600 Computers
THINKING LIKE AN ECONOMIST 18
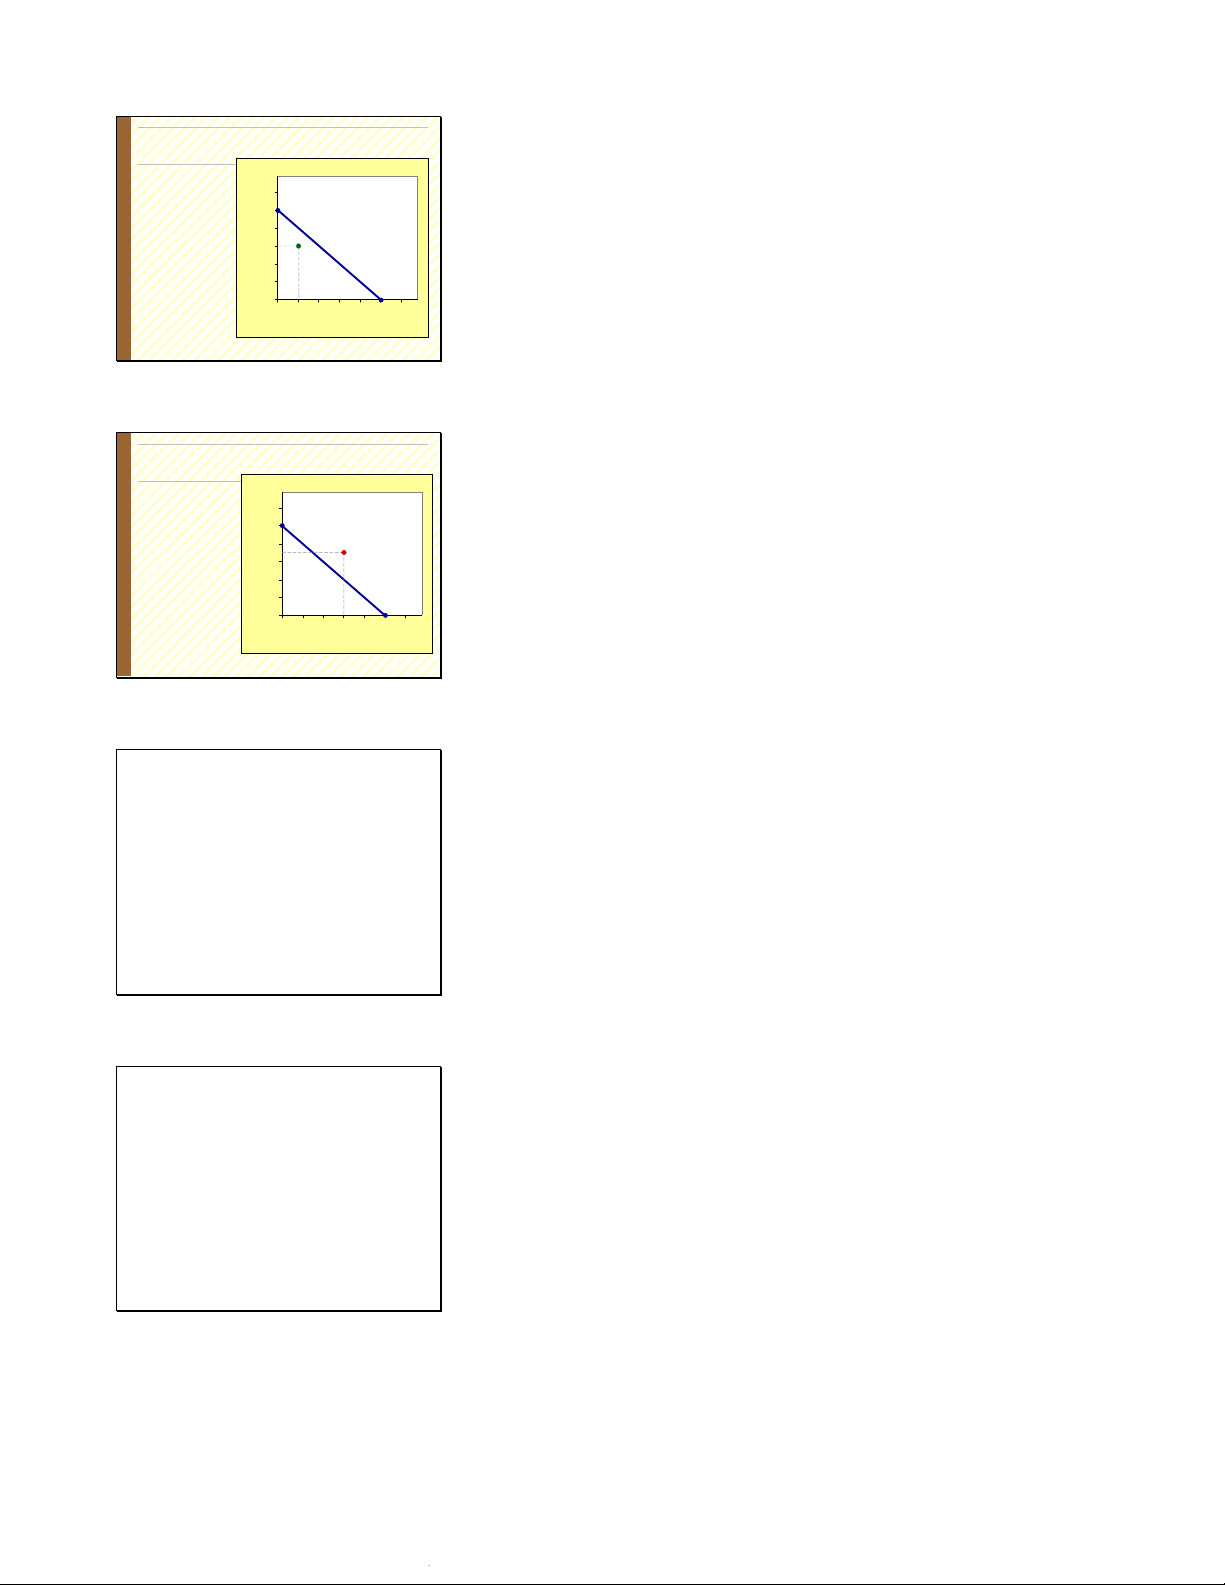
This exercise leads students to discover for themselves that A A C C T I V E E L L E E A A R R N N I N G G 1 P oin t s off t t h e P P PF
points under the PPF are possible but inefficient, while points
A. On the graph, find the point that represents
(100 computers, 3000 tons of wheat), label it F. above it are not possible.
Would it be possible for the economy to produce
this combination of the two goods? Why or why not?
B. Next, find the point that represents
(300 computers, 3500 tons of wheat), label it G.
Would it be possible for the economy to produce
this combination of the two goods? 19
Downloaded by Nga T??ng (ngahuong55@gmail.com) lOMoARcPSD|36041561 A A C C T I V E E L L E E A A R R N N I N G G 1 An sw ers Wheat § Point F: (tons) 100 computers, 6,000 3000 tons wheat 5,000 § Point F requires 4,000 40,000 hours 3,000 of labor. F Possible but 2,000 not efficient: 1,000 could get more 0 of either good 0 100 200 300 400 500 600 w/o sacrificing Computers any of the other. 20 A A C C T I V E E L L E E A A R R N N I N G G 1 An sw ers Wheat § Point G: (tons) 300 computers, 6,000 3500 tons wheat 5,000 § Point G requires 4,000 G 65,000 hours 3,000 of labor. 2,000 Not possible 1,000 because economy 0 only has 0 100 200 300 400 500 600 50,000 hours. Computers 21
Th e P PF: W h at We Kn ow S o Far
Points on the PPF (like A – E) § possible
§ efficient: all resources are fully utilized
Points under the PPF (like F) § possible
§ not efficient: some resources underutilized
(e.g., workers unemployed, factories idle)
Points above the PPF (like G) § not possible
THINKING LIKE AN ECONOMIST 22
Th e P PF an d O p p ort u n ity Cost
§ Recall: The opportunity cost of an item
is what must be given up to obtain that item.
§ Moving along a PPF involves shifting resources
(e.g., labor) from the production of one good to the other.
§ Society faces a tradeoff: Getting more of one
good requires sacrificing some of the other.
§ The slope of the PPF tells you the opportunity
cost of one good in terms of the other.
THINKING LIKE AN ECONOMIST 23
Downloaded by Nga T??ng (ngahuong55@gmail.com) lOMoARcPSD|36041561
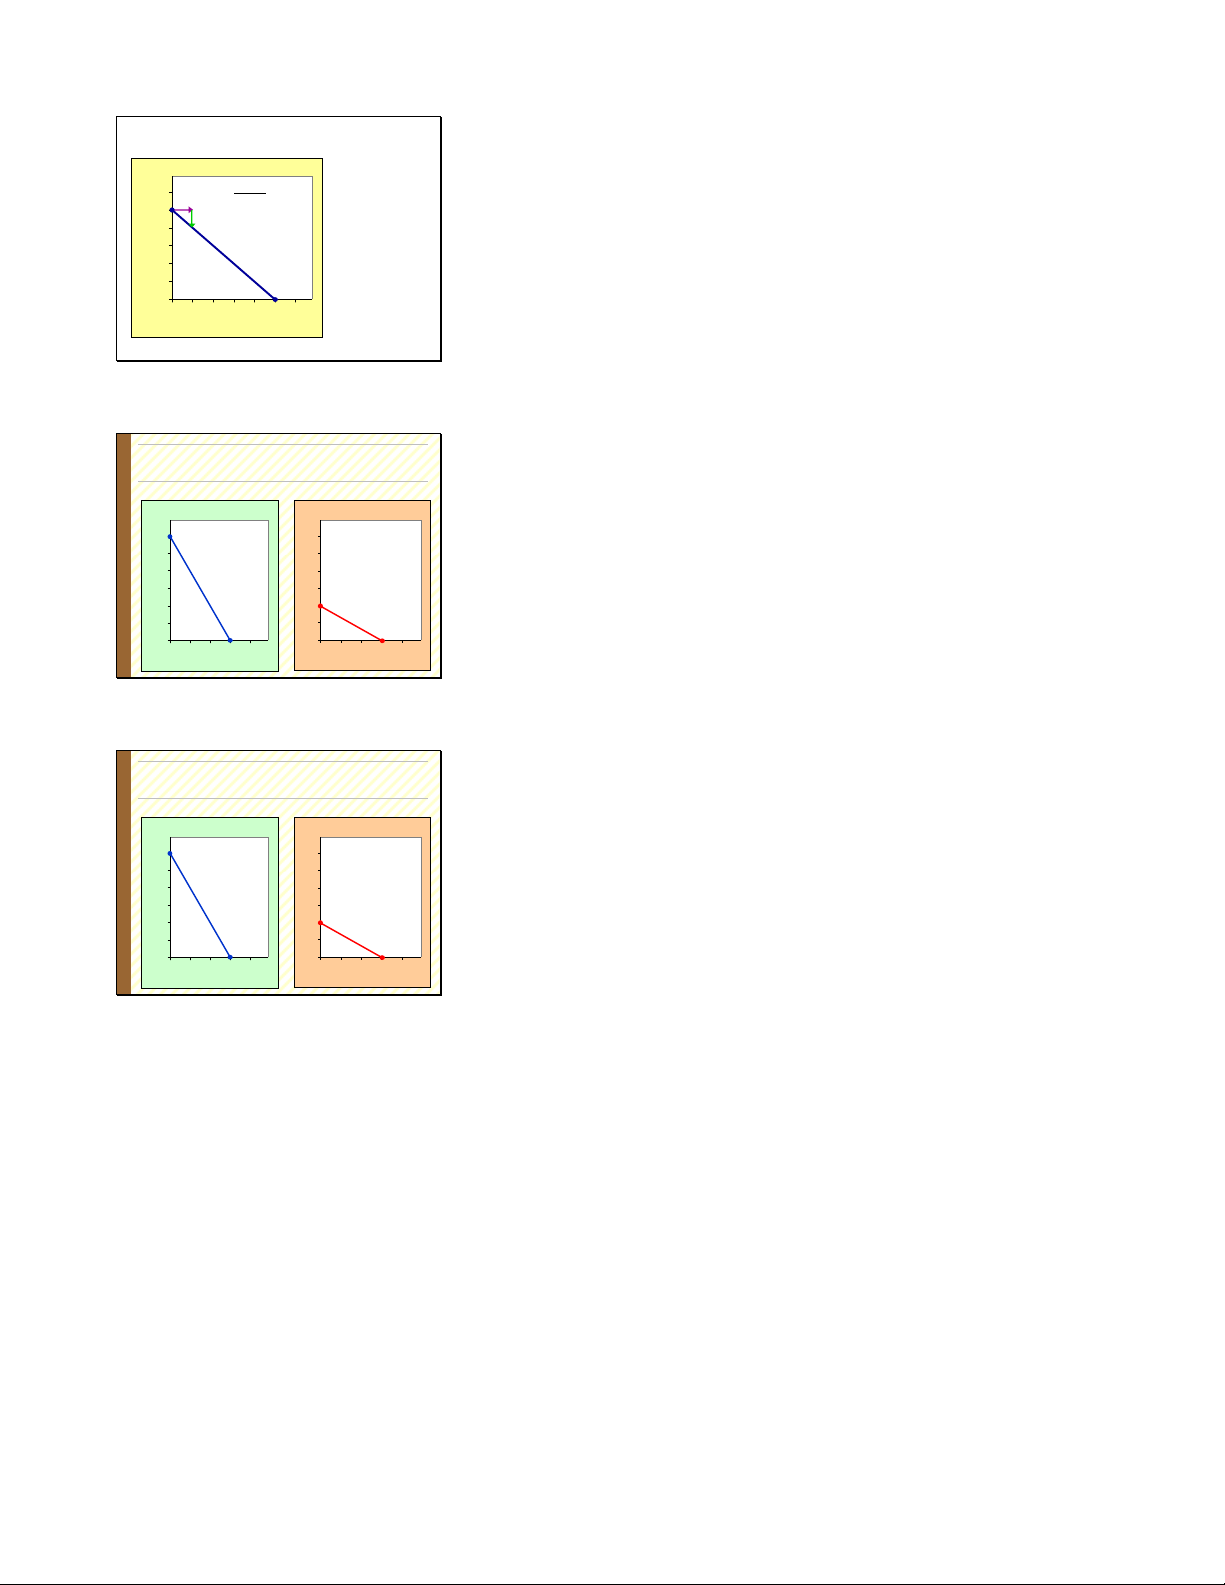
Th e PPF an d O p p ortu n ity C ost
Here, the “rise” is a negative number, because, as you move The slope of a line
to the right, the line falls (meaning wheat output is reduced). Wheat (tons) equals the –1000 6,000 slope = = –10 “rise over the run,” 100 the amount the line 5,000 rises when you 4,000
Moving to the right involves shifting resources from the move to the right 3,000 by one unit.
production of wheat (which causes wheat output to fall) to the 2,000 Here, the 1,000 opportunity cost of
production of computers (which causes computer production 0 a computer is 0 100 200 300 400 500 600 10 tons of wheat.
to rise). Producing an additional computer requires the Computers
THINKING LIKE AN ECONOMIST 24
resources that would otherwise produce 10 tons of wheat.
This exercise reinforces the material on the preceding slide. It A A C C T I V E E L L E E A A R R N N I N G G 2 P PF a
a n d O p p ortu n ity C ost
is especially useful if you plan to cover Chapter 3
In which country is the opportunity cost of cloth lower? FRANCE ENGLAND
(Interdependence and the Gains from Trade) after completing Wine Wine 60 0 600 Chapter 2. 50 0 500 40 0 400 30 0 300 20 0 200 10 0 100 0 0 0 10 0 2 00 3 0 0 40 0 0 100 200 300 400 Cloth Cloth25
There are two ways to get the answer. A A C C T I V E E L L E E A A R R N N I N G G 2 An sw ers
The hard way is to compute the slope of both PPFs. The
England, because its PPF is not as steep as France’s. FRANCE ENGLAND
slope of France’s PPF equals -600/300 = -2, meaning that Wine Wine 60 0 600
France must give up two units of wine to get an additional 50 0 500 40 0 400
unit of cloth. The slope of England’s PPF = -200/300 = -2/3, 30 0 300 20 0 200
meaning that England only must sacrifice 2/3 of a unit of 10 0 100 0 0
wine to get an additional unit of cloth. Thus, the opportunity 0 10 0 2 00 3 0 0 40 0 0 100 200 300 400 Cloth Cloth26
cost of cloth is lower in England than France.
The question, however, does not ask for the numerical values
of the opportunity cost of cloth in the two countries. It only
asks which country has a lower opportunity cost of cloth.
There is an easy way to determine the answer. Students must
remember that the slope of the PPF equals the opportunity
cost of the good measured on the horizontal axis. Then,
students can simply “eyeball” the two PPFs to determine
which is steepest. From the graphs show, it’s pretty easy to
see that England’s PPF isn’t as steep, and therefore the
opportunity cost of cloth is lower in England than in France.
Downloaded by Nga T??ng (ngahuong55@gmail.com) lOMoARcPSD|36041561
The PPF shows the tradeoff between the outputs of different
Econ om ic G row th an d th e PPF With additional
goods at a given time, but the tradeoff can change over time. Wheat Economic (tons) resources or an Economic growth shifts 6,000 improvement in growth shifts t t h h e e P P P P F F technology, 5,000 o o u u ttw w a a rrd d .. the economy can 4,000
For example, over time, the economy might get more workers produce more 3,000 computers,
(or more factories or more land). Or, a more efficient 2,000 more wheat, 1,000 or any combination
technology might be invented. Both events – an increase in in between. 0 0 100 200 300 400 500 600
the economy’s resources or an improvement in technology – Computers
THINKING LIKE AN ECONOMIST 27
cause an expansion in the set of opportunities. That is, both
allow the economy to produce more of one or both goods.
This is a simple example of economic growth, an important
subject that gets its own chapter in the macroeconomics portion of the textbook.
In the example shown on this slide, economic growth causes a
parallel outward shift of the PPF. Since the new PPF is
parallel to the old one, the tradeoff between the two goods is
the same. However, this need not always be the case. For
example, if a new technology had more impact on the
computer industry than on the wheat industry, then the
horizontal (computer) intercept would increase more than the
vertical (wheat) intercept, and the PPF would become flatter:
the opportunity cost of computers would fall, because the
technology has made them relatively cheaper (relative to
wheat). Going into more detail here is probably beyond the scope of this chapter.
T h e Sh ap e of th e PPF
§ The PPF could be a straight line, or bow-shaped
§ Depends on what happens to opportunity cost
as economy shifts resources from one industry to the other.
§ If opp. cost remains constant, PPF is a straight line.
(In the previous example, opp. cost of a
computer was always 10 tons of wheat.)
§ If opp. cost of a good rises as the economy
produces more of the good, PPF is bow-shaped.
THINKING LIKE AN ECONOMIST 28
Downloaded by Nga T??ng (ngahuong55@gmail.com) lOMoARcPSD|36041561
Wh y th e PPF M igh t Be Bow -Sh ap ed r As the economy e e shifts resources B from beer to mountain bikes: § PPF becomes steeper § opp. cost of mountain bikes increases Mountain Bikes
THINKING LIKE AN ECONOMIST 29
Wh y th e PPF M igh t Be Bow -Sh ap ed
Here, we are using “workers” for the more general
“resources,” to keep things simple and consistent with the At point A, r A A tt A A ,, o o p p p p .. c c o o s s tt o o ff e A mtn bikes is low. most workers are e mtn bikes is low. B previous examples. producing beer, even those that are better suited to building bikes. So, do not have to give up much beer to get more bikes. Mountain Bikes
THINKING LIKE AN ECONOMIST 30
Wh y th e PPF M igh t Be Bow -Sh ap ed At B, most workers r e A A tt B B ,, o o p p p p .. c c o o s s tt are producing bikes. e B of mt t n biikes The few left in beer is h h ig g h h .. are the best brewers. Producing more B bikes would require shifting some of the best brewers away from beer production, would cause a big Mountain drop in beer output. Bikes
THINKING LIKE AN ECONOMIST 31
Downloaded by Nga T??ng (ngahuong55@gmail.com) lOMoARcPSD|36041561
Wh y th e PPF M igh t Be Bow -Sh ap ed
The bow-shaped PPF is more realistic. However, the linear
§ So, PPF is bow-shaped when different workers
PPF is simpler to work with, and we can learn a lot about how
have different skills, different opportunity costs
of producing one good in terms of the other.
the economy works using the linear PPF. In Chapter 3, we
§ The PPF would also be bow-shaped when
there is some other resource, or mix of
will use a linear PPF to show how trade can make two
resources with varying opportunity costs
(E.g., different types of land suited for
countries (or two individuals) better off. different uses).
Note: In the “Problems and Applications” at the end of the
THINKING LIKE AN ECONOMIST 32
chapter, problem 4 asks students to construct a PPF for an
economy with three different workers (Larry, Moe, and
Curly), each with a different opportunity cost. The PPF ends
up having three line segments (one for each worker), which--
very roughly--approximates a bow-shape. After students
work through and understand this problem, it should not be
hard for them to understand the following: the more different
kinds of workers (or, more generally, resources) there are, the
closer the PPF will resemble a smooth bow shape. In an
actual economy like the U.S., there are millions of different
workers with different opportunity costs, so a smooth bow-
shaped PPF is a nearly perfect approximation to the actual PPF. T h e PPF: A Su m m ary
§ The PPF shows all combinations of two goods
that an economy can possibly produce,
given its resources and technology.
§ The PPF illustrates the concepts of
tradeoff and opportunity cost, efficiency and inefficiency,
unemployment, and economic growth.
§ A bow-shaped PPF illustrates the concept of increasing opportunity cost.
THINKING LIKE AN ECONOMIST 33
M icroecon om ics an d Macroecon om ics
§ Microeconomics is the study of how households
and firms make decisions and how they interact in markets.
§ Macroeconomics is the study of economy-wide
phenomena, including inflation, unemployment, and economic growth.
§ These two branches of economics are closely
intertwined, yet distinct – they address different questions.
THINKING LIKE AN ECONOMIST 34
Downloaded by Nga T??ng (ngahuong55@gmail.com) lOMoARcPSD|36041561
T h e Econ om ist as Policy Ad visor
§ As scientists, economists make positive statements,
which attempt to describe the world as it is.
§ As policy advisors, economists make normative statements,
which attempt to prescribe how the world should be.
§ Positive statements can be confirmed or refuted, normative statements cannot.
§ Govt employs many economists for policy advice.
E.g., the U.S. President has a Council of Economic
Advisors, which the author of this textbook chaired from 2003 to 2005. 35 A A C C T I V E E L L E E A A R R N N I N G G 3 Id en t ifyin g p p ositive vs. n . n orm ative
Which of these statements are “positive” and which
are “normative”? How can you tell the difference?
a. Prices rise when the government increases the quantity of money.
b. The government should print less money.
c. A tax cut is needed to stimulate the economy.
d. An increase in the price of burritos will cause an
increase in consumer demand for video rentals. 36 A A C C T I V E E L L E E A A R R N N I N G G 3 A A C C T I V E E L L E E A A R R N I N G G 3 An sw ers An sw ers
a. Prices rise when the government increases the
c. A tax cut is needed to stimulate the economy. quantity of money.
Normative – another value judgment.
Positive – describes a relationship, could use
d. An increase in the price of burritos will cause an
data to confirm or refute.
increase in consumer demand for video rentals.
b. The government should print less money.
Positive – describes a relationship.
Normative – this is a value judgment, cannot be
Note that a statement need not be true to be confirmed or refuted. positive. 37 38
Wh y Econ om ists D isagree
§ Economists often give conflicting policy advice.
§ They sometimes disagree about the validity of
alternative positive theories about the world.
§ They may have different values and, therefore,
different normative views about what policy should try to accomplish.
§ Yet, there are many propositions about which most economists agree.
THINKING LIKE AN ECONOMIST 39
Downloaded by Nga T??ng (ngahuong55@gmail.com) lOMoARcPSD|36041561
Proposition s ab ou t Wh ich M ost
This slide and the next show several of the 14 propositions
Econ om ists Agree (and % w h o agree)
appearing in Table 1 of the chapter. For the full list, see
§ A ceiling on rents reduces the quantity and
quality of housing available. (93%) Table 1 in the chapter.
§ Tariffs and import quotas usually reduce general economic welfare. (93%)
§ The United States should not restrict employers
Note: Some of the terms appearing in these statements have
from outsourcing work to foreign countries. (90%)
§ The United States should eliminate agriculture
not yet been defined, so you may wish to define them to subsidies. (85%)
students as they appear on the screen. continued…
THINKING LIKE AN ECONOMIST 40
If you’re pressed for time, delete the following slide and refer
your students to Table 1 in the chapter.
Proposition s ab ou t Wh ich M ost
Econom ists Agree (an d % agreein g)
§ The gap between Social Security funds and
…Continued from previous slide.
expenditures will become unsustainably large
within the next fifty years if current policies remain unchanged. (85%)
§ A large federal budget deficit has an adverse effect on the economy. (83%)
§ A minimum wage increases unemployment among
young and unskilled workers. (79%)
§ Effluent taxes and marketable pollution permits
represent a better approach to pollution control
than imposition of pollution ceilings. (78%)
THINKING LIKE AN ECONOMIST 41
FYI: Wh o Stu d ies Econ om ics?
This FYI lists people who studied economics in college. It is a
§ Ronald Reagan, President of the United States
§ Barbara Boxer, U.S. Senator
fun way to lighten up the lecture. On the other hand, if you’re
§ Sandra Day-O’Connor, Former Supreme Court Justice
§ Anthony Zinni, Former General, U.S. Marine Corps
running short on time, this is a good candidate to skip –
§ Kofi Annan, Former Secretary General, United Nations
§ Meg Witman, Chief Executive Officer, eBay
students will readily find it when they read the chapter.
§ Steve Ballmer, Chief Executive Officer, Microsoft
§ Arnold Schwarzenegger, Governor of California, Actor
§ Ben Stein, Political Speechwriter, Actor, Game Show Host
§ Mick Jagger, Singer for the Rolling Stones
(Due to space limitations, this slide omits a few of the names § John Elway, NFL Quarterback § Tiger Woods, Golfer
in the corresponding FYI box in the text.)
§ Diane von Furstenburg, Fashion Designer 42 CH APTER SUM MARY
§ As scientists, economists try to explain the world
using models with appropriate assumptions.
§ Two simple models are the Circular-Flow Diagram
and the Production Possibilities Frontier.
§ Microeconomics studies the behavior of
consumers and firms, and their interactions in
markets. Macroeconomics studies the economy as a whole.
§ As policy advisers, economists offer advice on how to improve the world. 43
Downloaded by Nga T??ng (ngahuong55@gmail.com) lOMoARcPSD|36041561
PowerPoint Lecture Notes for Chapter 3:
Interdependence and the Gains from Trade
Principles of Economics 5th edition, by N. Gregory Mankiw
Premium PowerPoint Slides by Ron Cronovich C H A P T E R 3
Please ask your students in advance to bring calculators
to class. This PowerPoint chapter includes simple in-class
In terd ep en d en ce an d th e
exercises which lead students to see for themselves the gains G ain s from Trad e
from trade arising from comparative advantage. EcP Po R R I n N N C C I o P P L L Em S S O O i F cs N. N Gr G eg e ory Ma M nkiw
This PowerPoint chapter covers the same topics as Chapter 3 Premium PowerPoint Slides
in the textbook (comparative & absolute advantage, the gains by Ron Cronovich
© 2009 South-Western, a part of Cengage Learning, all rights reserved
from trade), but using a different example and a different
approach that is likely to benefit your students. The textbook
presents these topics using an example involving two
individual producers (the farmer & rancher). After the
example, the textbook states that its lessons apply to
countries as well as individual producers. This PowerPoint
presentation takes the opposite approach, illustrating the
concepts with an example involving two countries, and then
states that that the lessons apply to individuals as well as
countries. Seeing the analysis both ways, and seeing a
different example in class than in the textbook, will help
students better learn these concepts.
The example in this PowerPoint chapter builds on the PPF
example introduced in the Chapter 2 PowerPoint. (It is not
essential to cover the Chapter 2 PowerPoint before this one, though.)
This PowerPoint omits “Should Tiger Woods Mow His Own
Lawn?” It’s a great example of comparative advantage, but
it does not introduce any new concepts, and students can
easily understand it on their own.
Downloaded by Nga T??ng (ngahuong55@gmail.com) lOMoARcPSD|36041561 In th is ch ap ter,
look for th e an sw ers to th ese q u estion s:
§ Why do people – and nations – choose to be economically interdependent?
§ How can trade make everyone better off?
§ What is absolute advantage?
What is comparative advantage?
How are these concepts similar? How are they different? 5 In terd ep en d en ce Every day hair gel from you rely on Cleveland, OH many people from around cell phone the world, from Taiwan most of whom you’ve never met, dress shirt from China to provide you with the goods and services coffee from Kenya you enjoy. In terd ep en d en ce
§ One of the Ten Principles from Chapter 1:
Trade can make everyone better off.
§ We now learn why people – and nations – choose to be interdependent,
and how they can gain from trade.
INTERDEPENDENCE AND THE GAINS FROM TRADE 7
Downloaded by Nga T??ng (ngahuong55@gmail.com) lOMoARcPSD|36041561
The lessons illustrated by this international trade example O u r Exam p le
§ Two countries: the U.S. and Japan
also apply to trade between two individual producers. Note
§ Two goods: computers and wheat
that this chapter in the textbook does the reverse: It develops
§ One resource: labor, measured in hours
the lessons in the context of an example involving two
§ We will look at how much of both goods
each country produces and consumes
individual producers, and then states that the lessons also
§if the country chooses to be self-sufficient
§if it trades with the other country
apply to international trade. So, between this PowerPoint
and the textbook chapter, students will see the same concepts
INTERDEPENDENCE AND THE GAINS FROM TRADE 8
and lessons developed in two different but entirely consistent approaches and examples.
The example here is highly contrived and unrealistic in order
to illustrate complex concepts as simply as possible. The
example has some qualities that make it especially valuable:
* The two goods are fundamentally different (one is
agricultural, the other manufactured), which makes gains
from trade based on comparative advantage very likely. An
example using more similar goods, say laptop computers and
MP3 players, would not be appropriate for this chapter
because it would more likely give rise to inter-industry trade,
and the gains would likely arise from a source other than
comparative advantage (probably increasing returns to scale).
* In the example here, it turns out that the U.S. has an
absolute advantage in both goods, yet both countries gain
from trade. Students see, therefore, that comparative
advantage, not absolute advantage, is what’s necessary for
trade to be mutually beneficial.
* In the real world, one often sees gains from trade based on
comparative advantage occurring between countries that are
very different – such as between rich industrialized countries
and poor developing countries. This example shows that
trade based on comparative advantage can also occur
between countries that are at similar levels of
industrialization and income. (Of course, the U.S. and Japan
are very different; but they are far more similar than are, say, the U.S. and Botswana.)
Downloaded by Nga T??ng (ngahuong55@gmail.com) lOMoARcPSD|36041561
If you just covered Chapter 2, point out to your students that
Prod u ction Possib ilities in t h e U.S.
§ The U.S. has 50,000 hours of labor
the U.S. PPF here is the same as in the Chapter 2
available for production, per month. PowerPoint. § Producing one computer requires 100 hours of labor. § Producing one ton of wheat requires 10 hours of labor.
Warn students that, in a few moments, they will be asked to
derive Japan’s PPF. They will need to follow the same steps
that you are about to show for deriving the U.S. PPF.
INTERDEPENDENCE AND THE GAINS FROM TRADE 9
Deriving the intercepts, or endpoints of the PPF: Th e U.S. PPF Wheat (tons) The U.S. has enough labor 5,000 to produce 500 computers,
The U.S. has 50,000 labor hours. or 5000 tons of wheat, 4,000 or any combination along 3,000 the PPF. 2,000
It takes 100 hours to produce a computer. If the U.S. uses all 1,000
its labor to produce computers, then it will produce Computers 0 100 200 300 400 500
50,000/100 = 500 computers. Hence, the horizontal intercept
INTERDEPENDENCE AND THE GAINS FROM TRADE 10 is (500 computers, 0 wheat).
It takes 10 hours to produce a ton of wheat. If the U.S. uses
all its labor to produce wheat, then it will produce 50,000/10
= 5000 tons of wheat. Hence, the vertical intercept is
(0 computers, 5000 tons of wheat).
The PPF is the straight line that connects the two endpoints.
Of course, the U.S. could choose a different point. The
Th e U.S. With ou t Trad e Wheat (tons)
actual choice will depend on the preferences of society. (In
Suppose the U.S. uses half its labor 5,000
to produce each of the two goods.
the following chapter – on supply and demand – we will 4,000
Then it will produce and consume 250 computers and
learn what determines how much of each good society 3,000 2500 tons of wheat. 2,000 produces.) 1,000 Computers 0 100 200 300 400 500
Important note for students:
INTERDEPENDENCE AND THE GAINS FROM TRADE 11
Without trade, a country consumes what it produces.
Downloaded by Nga T??ng (ngahuong55@gmail.com) lOMoARcPSD|36041561
Using this information to draw Japan’s PPF requires a A A C C T I V V E E L L E E A A R R N I N G G 1 D erive Jap an’s PPF
calculator (or the ability to do long division).
Use the following information to draw Japan’s PPF.
§ Japan has 30,000 hours of labor available for production, per month.
If your students have the “gutted handout” of these slides,
§ Producing one computer requires 125 hours of labor.
they can draw their PPF on the axes provided on the
§ Producing one ton of wheat requires 25 hours of labor. following slide.
Your graph should measure computers on the horizontal axis. 12
This activity should take only 3 minutes of class time. It’s
good practice & review for students, and helps break up the lecture.
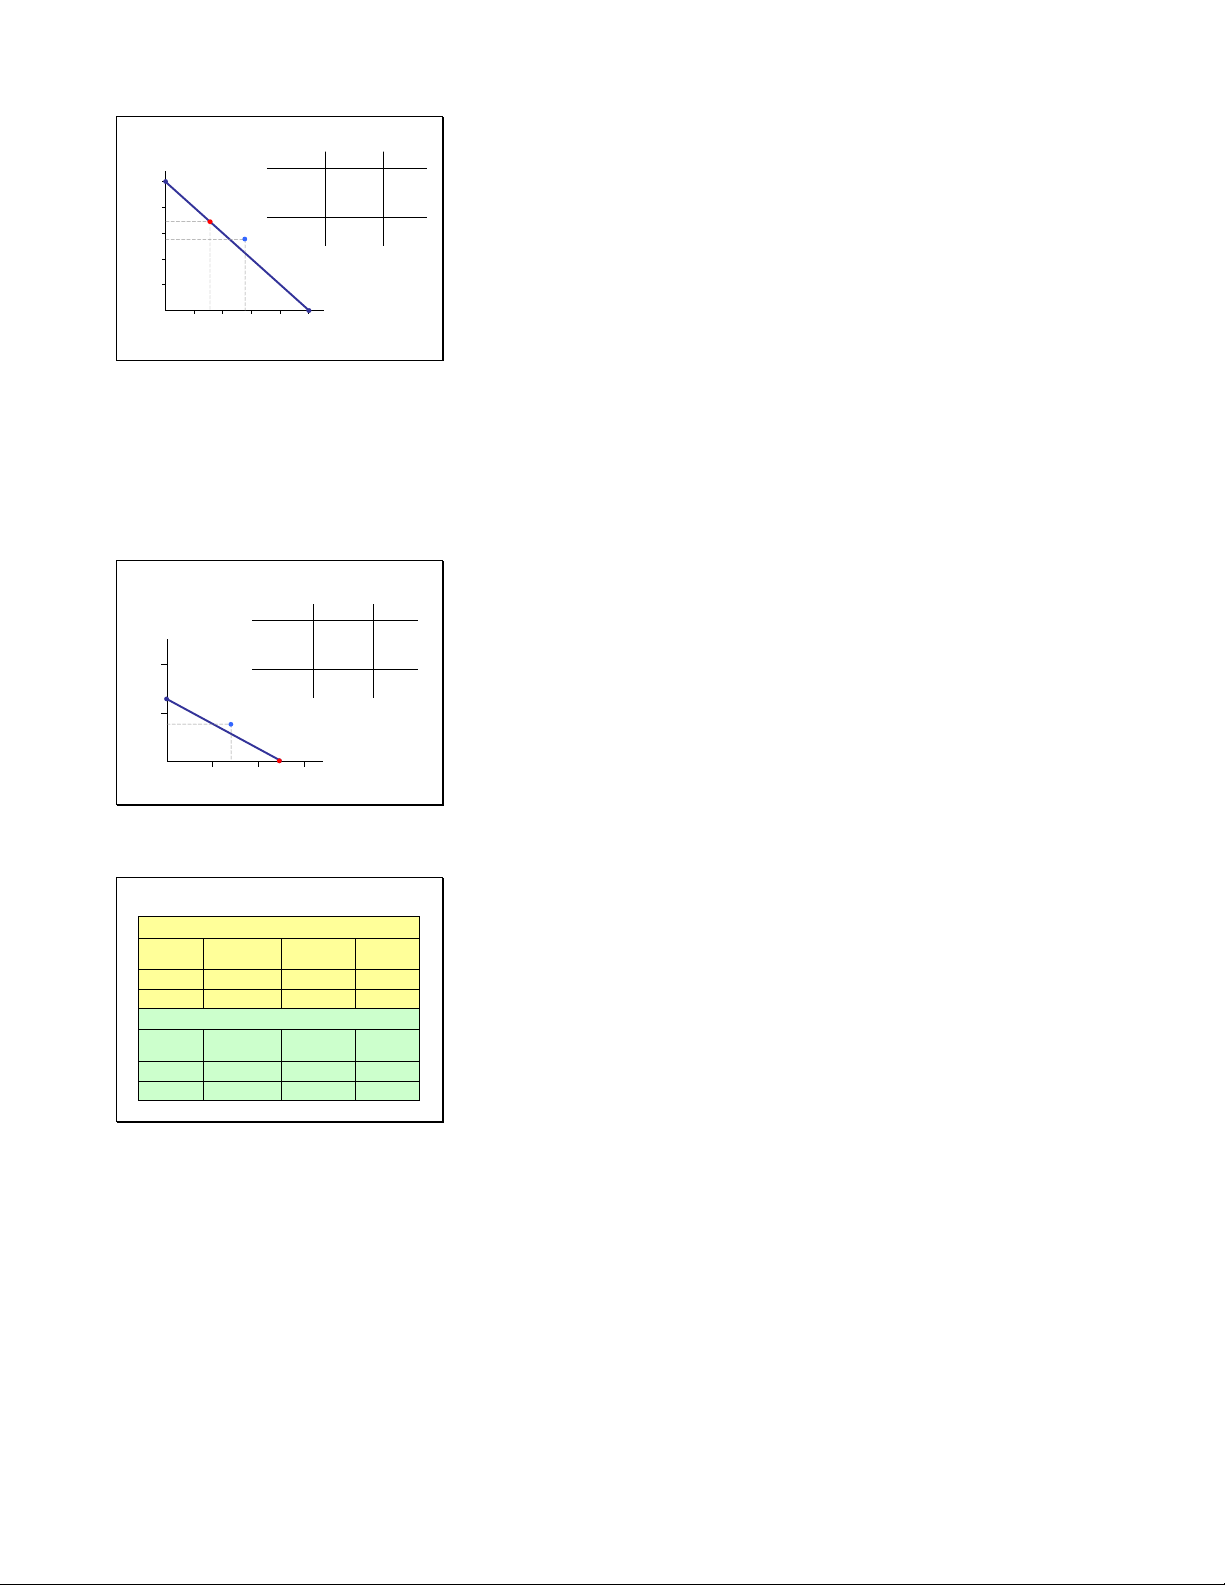
Horizontal intercept: (30,000 labor-hours)/(125 hours per Jap an ’s PPF computer) = 240 computers. Wheat Japan has enough labor to (tons) produce 240 computers, 2,000 or 1200 tons of wheat,
Vertical intercept: (30,000 labor-hours)/(25 hours per ton of or any combination along the PPF. wheat) = 1200 tons of wheat. 1,000 Computers 0 100 200 300
INTERDEPENDENCE AND THE GAINS FROM TRADE 13 Jap an With ou t Trad e Wheat (tons)
Suppose Japan uses half its labor to produce each good. 2,000
Then it will produce and consume 120 computers and 600 tons of wheat. 1,000 Computers 0 100 200 300
INTERDEPENDENCE AND THE GAINS FROM TRADE 14
Con sum ption With and Withou t Trade § Without trade,
§ U.S. consumers get 250 computers and 2500 tons wheat.
§ Japanese consumers get 120 computers and 600 tons wheat.
§ We will compare consumption without trade to consumption with trade.
§ First, we need to see how much of each good is
produced and traded by the two countries.
INTERDEPENDENCE AND THE GAINS FROM TRADE 15
Downloaded by Nga T??ng (ngahuong55@gmail.com) lOMoARcPSD|36041561
Give your students a few minutes to solve these problems A A C C T I V V E E L L E E A A R R N I N G G 2
Prod uction u nd er trad e
before showing the answers on the next slides. This will
1. Suppose the U.S. produces 3400 tons of wheat.
How many computers would the U.S. be able to
break up the lecture, get the students involved, and give them
produce with its remaining labor? Draw the
point representing this combination of
practice with “word problems.”
computers and wheat on the U.S. PPF.
2. Suppose Japan produces 240 computers.
How many tons of wheat would Japan be able
It is not necessary that all students finish both problems
to produce with its remaining labor? Draw this point on Japan’s PPF.
before moving on. It’s fine if most finish the first, and a few 16
finish the second. However, the second problem is easy for most students.
Note that most students will need a calculator to solve the first problem.
Point out to students that the red dot represents the
U.S. Prod u ctio n With Trad e Wheat (tons)
combination (160 computers, 3400 tons of wheat). We will 5,000 Producing 3400 tons of wheat requires 34,000 labor hours.
assume that this is the combination the U.S. produces in the 4,000 The remaining 16,000
scenario in which the U.S. trades. 3,000 labor hours are used to produce 160 computers. 2,000 1,000 Computers 0 100 200 300 400 500
INTERDEPENDENCE AND THE GAINS FROM TRADE 17
The red dot represents the combination (240 computers, 0
Jap an ’s Prod u ction With Trad e
tons wheat). We will assume this is the combination that Wheat Producing 240 computers (tons)
requires all of Japan’s 30,000 Japan produces. labor hours. 2,000 So, Japan would produce 0 tons of wheat.
Point out that, just because Japan is not producing any wheat 1,000
does not mean that Japan’s consumers must all go on the Computers 0
Atkins diet (which shuns bread and other foods made from 100 200 300
INTERDEPENDENCE AND THE GAINS FROM TRADE 18
wheat). When trade is allowed, Japan can trade some of its
computers for wheat produced in another country.
Downloaded by Nga T??ng (ngahuong55@gmail.com) lOMoARcPSD|36041561
These terms are so basic that many instructors skip this slide.
Basic In tern ation al Trad e Term s § Exports:
goods produced domestically and sold abroad
To export means to sell domestically produced
There’s a subtle point that you might want to mention (if goods abroad.
you’re anal like me), or that your students might ask about § Imports:
goods produced abroad and sold domestically
(especially if tourism is an important part of your local
To import means to purchase goods produced in other countries. economy).
INTERDEPENDENCE AND THE GAINS FROM TRADE 19
Someone from Germany or South Korea visits Las Vegas
and spends $200 on a pair of tickets to a show. How should
we classify this and other expenditures by foreign tourists on
lodging and entertainment while they are vacationing here?
Answer: we count it in U.S. exports. It doesn’t matter that
the service was consumed here. What matters is that it was
produced here but sold to a foreign buyer.
Hence, a more precise definition of exports would be goods
and serviced produced here and purchased by foreign buyers.
This stricter definition of exports doesn’t care whether the
good or service was consumed in the buyer’s home country or in the exporting country.
Similarly, a stricter and more precise definition of imports
would include purchases by domestic residents of goods and
services produced abroad – including entertainment and
lodging services that tourists from the U.S. consume in the foreign countries they visit.
Some students need help figuring out that consumption of a A A C C T I V V E E L L E E A A R R N I N G G 3
Consu m p tion u nd er trade
good is the difference between the amount produced and the
Suppose the U.S. exports 700 tons of wheat to
Japan, and imports 110 computers from Japan. amount exported.
(So, Japan imports 700 tons wheat and exports 110 computers.)
§ How much of each good is consumed in the
U.S.? Plot this combination on the U.S. PPF.
§ How much of each good is consumed in Japan?
Plot this combination on Japan’s PPF. 20
Downloaded by Nga T??ng (ngahuong55@gmail.com) lOMoARcPSD|36041561
U.S. Con su m p tion With Trad e
The red point again represents production. Wheat (tons) computers wheat 5,000 produced 160 3400 + imported 110 0
Trade un-tethers consumption from production. The light 4,000 – exported 0 700 = amount
blue point represents consumption. Notice that the 3,000 270 2700 consumed 2,000
consumption point is above the PPF. Without trade, it would 1,000
not be possible to consume this combination of the two Computers 0 100 200 300 400 500 goods!
INTERDEPENDENCE AND THE GAINS FROM TRADE 21
In a sense, international trade is like technological progress:
it allows society to produce quantities of goods that would otherwise not be possible.
Jap an ’s Con su m p tion With Trad e
Again, the light blue point representing consumption is
above the PPF. Without trade, it would not be possible to computers wheat Wheat produced 240 0 (tons)
consume this combination of the goods. + imported 0 700 2,000 – exported 110 0 = amount 130 700 consumed 1,000 Computers 0 100 200 300
INTERDEPENDENCE AND THE GAINS FROM TRADE 22
These tables summarize the gains from trade for both
Trad e Makes Both Cou ntries Better O ff U.S. countries.
consumption consumption gains from without trade with trade trade computers 250 270 20 wheat 2,500 2,700 200 Japan
consumption consumption gains from without trade with trade trade computers 120 130 10 wheat 600 700 100
INTERDEPENDENCE AND THE GAINS FROM TRADE 23
Downloaded by Nga T??ng (ngahuong55@gmail.com) lOMoARcPSD|36041561
The last bullet point states that gains from trade will arise if
Wh ere D o Th ese G ain s Com e From ?
§ Absolute advantage: the ability to produce a
each country has an absolute advantage in something. We
good using fewer inputs than another producer
will see next, though, that absolute advantage is not required
§ The U.S. has an absolute advantage in wheat:
producing a ton of wheat uses 10 labor hours
for both countries to gain from trade. in the U.S. vs. 25 in Japan.
§ If each country has an absolute advantage
in one good and specializes in that good,
then both countries can gain from trade.
INTERDEPENDENCE AND THE GAINS FROM TRADE 24
Wh ere D o Th ese G ain s Com e From ?
§ Which country has an absolute advantage in computers?
§ Producing one computer requires 125 labor hours in Japan, but only 100 in the U.S.
§ The U.S. has an absolute advantage in both goods!
So why does Japan specialize in computers?
Why do both countries gain from trade?
INTERDEPENDENCE AND THE GAINS FROM TRADE 25
Tw o M easu res of th e Cost of a G ood
§ Two countries can gain from trade when each
specializes in the good it produces at lowest cost.
§ Absolute advantage measures the cost of a good
in terms of the inputs required to produce it. § Recall:
Another measure of cost is opportunity cost.
§ In our example, the opportunity cost of a
computer is the amount of wheat that could be
produced using the labor needed to produce one computer.
INTERDEPENDENCE AND THE GAINS FROM TRADE 26
O p p ortu n ity Cost an d
Com p arative Ad van tage
§ Comparative advantage: the ability to produce
a good at a lower opportunity cost than another producer
§ Which country has the comparative advantage in computers?
§ To answer this, must determine the opp. cost of a computer in each country.
INTERDEPENDENCE AND THE GAINS FROM TRADE 27
Downloaded by Nga T??ng (ngahuong55@gmail.com) lOMoARcPSD|36041561
O p p ortu n ity Cost an d
Com p arative Ad van tage
§ The opp. cost of a computer is
§ 10 tons of wheat in the U.S., because producing
one computer requires 100 labor hours,
which instead could produce 10 tons of wheat.
§ 5 tons of wheat in Japan, because producing
one computer requires 125 labor hours,
which instead could produce 5 tons of wheat.
§ So, Japan has a comparative advantage in
computers. Lesson: Absolute advantage is not
necessary for comparative advantage!
INTERDEPENDENCE AND THE GAINS FROM TRADE 28
Com p arative Ad van tage an d Trad e
§ Gains from trade arise from comparative
advantage (differences in opportunity costs).
§ When each country specializes in the good(s)
in which it has a comparative advantage,
total production in all countries is higher,
the world’s “economic pie” is bigger,
and all countries can gain from trade.
§ The same applies to individual producers
(like the farmer and the rancher) specializing
in different goods and trading with each other.
INTERDEPENDENCE AND THE GAINS FROM TRADE 29
Allow a few minutes for students to work on this problem. A A C C T I V V E E L L E E A A R R N I N G G 4
Ab solu te & com parative ad van tage
Ask for volunteers to share their answers.
Argentina and Brazil each have 10,000 hours of labor per month. In Argentina,
§ producing one pound coffee requires 2 hours
Variation: Before asking for volunteers, instruct students to
§ producing one bottle wine requires 4 hours In Brazil,
compare their answers with their neighbors. Not everyone
§ producing one pound coffee requires 1 hour
§ producing one bottle wine requires 5 hours
will volunteer to explain their answer to the class, but
Which country has an absolute advantage in the
production of coffee? W hich country has a
everyone will at least get to explain his or her answer to a
comparative advantage in the production of wine? 30 classmate. A A C C T I V V E E L L E E A A R R N I N G G 4 An sw ers
Brazil has an absolute advantage in coffee:
§ Producing a pound of coffee requires only one
labor-hour in Brazil, but two in Argentina.
Argentina has a comparative advantage in wine:
§ Argentina’s opp. cost of wine is two pounds of
coffee, because the four labor-hours required
to produce a bottle of wine could instead produce two pounds of coffee.
§ Brazil’s opp. cost of wine is five pounds of coffee. 31
Downloaded by Nga T??ng (ngahuong55@gmail.com) lOMoARcPSD|36041561
Unan sw ered Q u estion s….
The 5th edition adds a brief explanation of the range of prices
§ We made a lot of assumptions about the quantities
that will permit gains from trade, in the context of the
of each good that each country produces, trades,
and consumes, and the price at which the farmer-rancher example.
countries trade wheat for computers.
§ In the real world, these quantities and prices would
be determined by the preferences of consumers
and the technology and resources in both
The second bullet point mentions technology and resources. countries.
§ We will begin to study this in the next chapter.
In our example, the technology is how many labor-hours are
§ For now, though, our goal was merely to
required to produce each good. The resources are simply the
see how trade can make everyone better off.
INTERDEPENDENCE AND THE GAINS FROM TRADE 32
quantity of labor-hours available in each country.
In the following chapter (on supply & demand), students will
begin their study of how prices and quantities are determined. CHAPTER SUMM ARY
§ Interdependence and trade allow everyone to enjoy
a greater quantity and variety of goods & services.
§ Comparative advantage means being able to
produce a good at a lower opportunity cost.
Absolute advantage means being able to produce a good with fewer inputs.
§ When people – or countries – specialize in the
goods in which they have a comparative advantage,
the economic “pie” grows and trade can make everyone better off. 33
Downloaded by Nga T??ng (ngahuong55@gmail.com) lOMoARcPSD|36041561
PowerPoint Lecture Notes for Chapter 4:
The Market Forces of Supply and Demand
Principles of Economics 5th edition, by N. Gregory Mankiw
Premium PowerPoint Slides by Ron Cronovich
This is perhaps the most important chapter in the textbook. C H A P T E R 4
It’s worth mentioning to your students that investing extra
Th e M ark et Forces of
time to master this chapter will make it easier for them to
Su p p ly an d D em an d
learn much of the subsequent material in the book. EcP Po R R I Nn N C C I o P P L Em S S O O Fi F cs N. N Gr G egory Ma M nkiw
This is also one of the longest chapters in the textbook, and Premium PowerPoint Slides
this PowerPoint file is one of the most graph-intensive. Many by Ron Cronovich
© 2009 South-Western, a part of Cengage Learning, all rights reserved
students taking economics for the first time have difficulty
grasping the graphs, which are critically important in this and
all subsequent chapters in the book. So an extra degree of
hand-holding might be appropriate.
Accordingly, this PowerPoint has carefully detailed
animations that build many of the graphs with great care. For
example, we show a demand or supply schedule next to the
axes, and highlight each coordinate pair in the table as the
corresponding point appears on the graph.
Please be assured that the presentation of graphs is more
streamlined in subsequent chapters. In this early chapter,
though, we do not want to leave any students behind.
If your students are already very comfortable with scatter-
type graphs, you may wish to simplify or turn off the
animation on these slides, in order to get through them faster. In th is ch ap ter,
look for th e an sw ers to th ese q u estion s:
§ What factors affect buyers’ demand for goods?
§ What factors affect sellers’ supply of goods?
§ How do supply and demand determine the price of a good and the quantity sold?
§ How do changes in the factors that affect demand
or supply affect the market price and quantity of a good?
§ How do markets allocate resources? 5
Downloaded by Nga T??ng (ngahuong55@gmail.com) lOMoARcPSD|36041561
In the real world, there are relatively few perfectly
M ark ets an d C om p etition
§ A market is a group of buyers and sellers of a
competitive markets. Most goods come in lots of different particular product.
varieties – including ice cream, the example in the textbook.
§ A competitive market is one with many buyers
and sellers, each has a negligible effect on price.
And there are many markets in which the number of firms is
§ In a perfectly competitive market: § All goods exactly the same
small enough that some of them have the ability to affect the
§ Buyers & sel ers so numerous that no one can
affect market price – each is a “price taker” market price.
§ In this chapter, we assume markets are perfectly competitive.
THE MARKET FORCES OF SUPPLY AND DEMAND 6
For now, though, we look at supply and demand in perfectly
competitive markets, for two reasons: First, it’s easier to
learn. Understanding perfectly competitive markets makes it
a lot easier to learn the more realistic but complicated analysis
of imperfectly competitive markets. Second, despite the lack
of realism, the perfectly competitive model can teach us a
LOT about how the world works, as we will see many times in the chapters that follow.
Demand comes from the behavior of buyers. D em an d
§ The quantity demanded of any good is the
amount of the good that buyers are willing and able to purchase.
§ Law of demand: the claim that the quantity
demanded of a good falls when the price of the
good rises, other things equal
THE MARKET FORCES OF SUPPLY AND DEMAND 7
Th e D em an d Sch ed u le § Price Quantity Demand schedule: of of lattes a table that shows the lattes demanded relationship between the $0.00 16 price of a good and the 1.00 14 quantity demanded 2.00 12 § Example: 3.00 10 Helen’s demand for lattes. 4.00 8 5.00 6 § Notice that Helen’s 6.00 4 preferences obey the Law of Demand.
THE MARKET FORCES OF SUPPLY AND DEMAND 8
Downloaded by Nga T??ng (ngahuong55@gmail.com) lOMoARcPSD|36041561
H elen ’s D em an d Sch ed u le & Cu rve Price of Price Quantity Lattes of of lattes $6.00 lattes demanded $0.00 16 $5.00 1.00 14 $4.00 2.00 12 $3.00 3.00 10 $2.00 4.00 8 5.00 6 $1.00 6.00 4 $0.00 Quantity 0 5 10 15 of Lattes
THE MARKET FORCES OF SUPPLY AND DEMAND 9
M ark et D em an d versu s In d ivid u al D em an d
This example violates the “many buyers” condition of perfect
§ The quantity demanded in the market is the sum of the
competition. Yet, we are merely trying to show here that, at
quantities demanded by all buyers at each price.
§ Suppose Helen and Ken are the only two buyers in
each price, the quantity demanded in the market is the sum of
the Latte market. (Qd = quantity demanded) Price Helen’s Qd Ken’s Qd Market Qd
the quantity demanded by each buyer in the market. This $0.00 16 + 8 = 24 1.00 14 + 7 = 21
holds whether there are two buyers or two million buyers. 2.00 12 + 6 = 18 3.00 10 + 5 = 15
But it would be harder to fit data for two million buyers on 4.00 8 + 4 = 12
this slide, so we settle for two. 5.00 6 + 3 = 9 6.00 4 + 2 = 6 10
Th e M ark et D eman d Cu rve for Lattes Qd P P (Market) $6.00 $0.00 24 $5.00 1.00 21 $4.00 2.00 18 $3.00 3.00 15 4.00 12 $2.00 5.00 9 $1.00 6.00 6 $0.00 Q 0 5 10 15 20 25
THE MARKET FORCES OF SUPPLY AND DEMAND 11
D em an d C u rve Sh ifters
§ The demand curve shows how price affects
quantity demanded, other things being equal.
§ These “other things” are non-price determinants
of demand (i.e., things that determine buyers’
demand for a good, other than the good’s price).
§ Changes in them shift the D curve…
THE MARKET FORCES OF SUPPLY AND DEMAND 12
Downloaded by Nga T??ng (ngahuong55@gmail.com) lOMoARcPSD|36041561
Income is the first demand shifter discussed in this chapter of
Dem an d Cu rve Sh ifters: # of Bu yers § Increase in # of buyers
the textbook. I chose to start with a different one (number of
increases quantity demanded at each price,
shifts D curve to the right.
buyers), for the following reason:
In discussing the impact of changes in income on the demand
curve, the textbook also introduces the concept of normal
goods and inferior goods. Students may find it easier to learn
about curve shifts if the presentation focuses solely on a curve
THE MARKET FORCES OF SUPPLY AND DEMAND 13
shift (at least initially) without simultaneously introducing other concepts.
If you wish to present the demand shifters in the same order
as they appear in the book, simply reorder the slides in this presentation.
Beginning economics students often have trouble
D em an d Cu rve Sh ifters: # of Bu yers
understanding the difference between a movement along the P Suppose the number $6.00 of buyers increases.
curve and a shift in the curve. Here, the animation has been
Then, at each P, $5.00
Qd will increase $4.00 (by 5 in this example).
carefully designed to help students see that a shift in the curve $3.00
results from an increase in quantity at each price. $2.00 $1.00 $0.00 Q
(A more realistic scenario would involve a non-parallel shift, 0 5 10 15 20 25 30
THE MARKET FORCES OF SUPPLY AND DEMAND 14
where the horizontal distance of the shift would be greater for
lower prices than higher ones. However, to remain consistent
with the textbook, and to keep things simple, this slide shows a parallel shift.)
D em an d Cu rve Sh ifters: In com e
§ Demand for a normal good is positively related to income. § Increase in income causes
increase in quantity demanded at each price,
shifts D curve to the right.
(Demand for an inferior good is negatively
related to income. An increase in income shifts
D curves for inferior goods to the left.)
THE MARKET FORCES OF SUPPLY AND DEMAND 15
Downloaded by Nga T??ng (ngahuong55@gmail.com) lOMoARcPSD|36041561
If you are willing to spend a couple extra minutes on
D em an d Cu rve Sh ifters: Prices of Related G ood s
substitutes and complements, and have a blackboard or
§ Two goods are substitutes if
an increase in the price of one
whiteboard to draw on, here’s an idea:
causes an increase in demand for the other.
§ Example: pizza and hamburgers.
An increase in the price of pizza
increases demand for hamburgers,
Before (or instead of) showing this slide, draw the demand
shifting hamburger demand curve to the right.
curve for hamburgers. Pick a price, say $5, and draw a
§ Other examples: Coke and Pepsi,
laptops and desktop computers,
horizontal line at that price, extending from the vertical axis CDs and music downloads
THE MARKET FORCES OF SUPPLY AND DEMAND 16
through the D curve and continuing to the right. Suppose Q =
1000 when P = $5. Label this on the horizontal axis.
Now ask your students: If pizza becomes more expensive,
but price of hamburgers does not change, what would happen
to the quantity of hamburgers demanded? Would it remain at
1000, would it increase, or would it decrease? Explain.
Some and perhaps most students will see right away that
people will want more hamburgers when the price of pizza
rises. After establishing this, note that the increase in the
price of pizza caused an increase in the quantity demanded of
hamburgers. Then state the term “substitutes” and give the definition.
Before giving the other examples (listed in the 3rd bullet of
this slide), do a similar exercise to develop the concept of
complements. Finally, give the examples of substitutes and
complements from the 3rd bullet point of this and the
following slides, but mix up the order and ask students to
identify whether each example is complements or substitutes.
D em an d Cu rve Sh ifters: Prices of Related G ood s
§ Two goods are complements if
an increase in the price of one
causes a fall in demand for the other.
§ Example: computers and software.
If price of computers rises, people buy fewer
computers, and therefore less software.
Software demand curve shifts left.
§ Other examples: college tuition and textbooks,
bagels and cream cheese, eggs and bacon
THE MARKET FORCES OF SUPPLY AND DEMAND 17
Downloaded by Nga T??ng (ngahuong55@gmail.com) lOMoARcPSD|36041561
D em an d Cu rve Sh ifters: Tastes
§ Anything that causes a shift in tastes toward a
good will increase demand for that good
and shift its D curve to the right. § Example:
The Atkins diet became popular in the ’90s,
caused an increase in demand for eggs,
shifted the egg demand curve to the right.
THE MARKET FORCES OF SUPPLY AND DEMAND 18
D em an d Cu rve Sh ifters: Exp ectation s
§ Expectations affect consumers’ buying decisions. § Examples:
§ If people expect their incomes to rise,
their demand for meals at expensive restaurants may increase now.
§ If the economy sours and people worry about
their future job security, demand for new autos may fall now.
THE MARKET FORCES OF SUPPLY AND DEMAND 19
Students should notice that the only determinant of quantity
Su m m ary: Variables Th at In flu en ce Bu yers Variable
A change in this variable…
demanded that causes a movement along the curve is price. Price …causes a movement
Also notice: price is one of the variables measured along the
along the D curve # of buyers
…shifts the D curve axes of the graph. Income
…shifts the D curve Price of related goods
…shifts the D curve
Here’s a handy “rule of thumb” to help students remember Tastes
…shifts the D curve Expectations
…shifts the D curve
whether the curve shifts: If the variable causing demand to
THE MARKET FORCES OF SUPPLY AND DEMAND 20
change is measured on one of the axes, you move along the
curve. If the variable that’s causing demand to change is
NOT measured on either axis, then the curve shifts.
This rule of thumb works with all curves in economics that
involve an X-Y relationship. (I.e., it works for the supply
curve, the marginal cost curve, the IS and LM curves, among
many others, but it does not apply to curves drawn on time series graphs.)
Downloaded by Nga T??ng (ngahuong55@gmail.com) lOMoARcPSD|36041561
In each case, there are only three possible answers: A A C C T I V V E E L L E E A A R R N I N G G 1 D em an d Cu rve
- The curve shifts to the right
Draw a demand curve for music downloads. What happens to it in each of
- The curve shifts to the left the following scenarios? Why?
- The curve does not shift (though there may be a movement A. The price of iPods falls along the curve) B. The price of music downloads falls
C. The price of CDs falls 21
Point out to your students that there are no numbers or units A A C C T I V V E E L L E E A A R R N I N G G 1 A. Price of iPods falls
on either axis, and we are using “P Mu Mu sic downloads s
1” and “Q1” to represent the Price of and iPods are music and iPods are
initial price and quantity, rather than specific numerical down- co co mplements. loads A A fall in pri ri ce of
values. Tell them that this is common, because in much iPods shifts the P1 dema ma nd cu cu rve rve for
economic analysis, the goal is only to see the direction of mu mu sic downloads s to the right.
changes, not specific amounts. (Besides, if we put numbers D D 1 2 Q Q Quantity of 1 2
on this graph, they’d just have been made up, so why bother?) music downloads 22 Also point out the following:
The price of music downloads is the same, but the quantity
demanded is now higher. In fact, this is the nature of a shift
in a curve: at any given price, the quantity is different than before. A A C C T I V V E E L L E E A A R R N I N G G 1
B. Price of m u sic d ow nload s falls Price of music The D cu cu rve down- does not shift. loads Mo Mo ve down along P curv r e ve to a point with 1
lower P, higher Q. P2 D1 Q Q Quantity of 1 2 music downloads 23
Downloaded by Nga T??ng (ngahuong55@gmail.com) lOMoARcPSD|36041561 A A C C T I V V E E L L E E A A R R N I N G G 1 C. Price of CD s falls Price of CDs and music music downloads down- are re su su bst st itutes. s. loads A fall in price of CDs P shifts demand for 1 shifts demand fo music downloads to the left. D D 1 2 Q Q Quantity of 2 1 music downloads 24
Supply comes from the behavior of sellers. Su p p ly
§ The quantity supplied of any good is the
amount that sellers are wil ing and able to sel .
§ Law of supply: the claim that the quantity
supplied of a good rises when the price of the
good rises, other things equal
THE MARKET FORCES OF SUPPLY AND DEMAND 25
Th e Su p p ly Sch ed u le § Supply schedule: Price Quantity of of lattes A table that shows the lattes supplied relationship between the $0.00 0 price of a good and the 1.00 3 quantity supplied. 2.00 6 § Example: 3.00 9 Starbucks’ supply of lattes. 4.00 12 § 5.00 15 Notice that Starbucks’ 6.00 18 supply schedule obeys the Law of Supply.
THE MARKET FORCES OF SUPPLY AND DEMAND 26
Starbu ck s’ Su p p ly Sch ed u le & Cu rve Price Quantity P of of lattes $6.00 lattes supplied $0.00 0 $5.00 1.00 3 $4.00 2.00 6 $3.00 3.00 9 $2.00 4.00 12 5.00 15 $1.00 6.00 18 $0.00 Q 0 5 10 15
THE MARKET FORCES OF SUPPLY AND DEMAND 27
Downloaded by Nga T??ng (ngahuong55@gmail.com) lOMoARcPSD|36041561
M ark et Su p p ly versu s In d ivid u al Su p p ly
Again, the assumption of only two sellers is a clear violation
§ The quantity supplied in the market is the sum of
of perfect competition. However, it’s much easier for
the quantities supplied by all sellers at each price.
§ Suppose Starbucks and Jitters are the only two
students to learn how the market supply curve relates to
sellers in this market. (Qs = quantity supplied) Price Starbucks Jitters Market Qs
individual supplies in the two-seller case. $0.00 0 + 0 = 0 1.00 3 + 2 = 5 2.00 6 + 4 = 10 3.00 9 + 6 = 15 4.00 12 + 8 = 20 5.00 15 + 10 = 25 6.00 18 + 12 = 30 28
Th e M ark et Su p p ly Cu rve QS P (Market) P $6.00 $0.00 0 1.00 5 $5.00 2.00 10 $4.00 3.00 15 $3.00 4.00 20 $2.00 5.00 25 6.00 30 $1.00 $0.00 Q 0 5 10 15 20 25 30 35
THE MARKET FORCES OF SUPPLY AND DEMAND 29
“Non-price determinants of supply” simply means the things
Su p p ly C u rve Sh ifters
§ The supply curve shows how price affects
– other than the price of a good – that determine sellers’
quantity supplied, other things being equal. § supply of the good.
These “other things” are non-price determinants of supply.
§ Changes in them shift the S curve…
THE MARKET FORCES OF SUPPLY AND DEMAND 30
In the second bullet point, “output price” just means the price
Su p p ly Cu rve Sh ifters: In p u t Prices § Examples of input prices:
of the good that firms are producing and selling. I have used
wages, prices of raw materials.
“output price” here to distinguish it from “input prices.”
§ A fall in input prices makes production
more profitable at each output price,
so firms supply a larger quantity at each price,
and the S curve shifts to the right.
THE MARKET FORCES OF SUPPLY AND DEMAND 31
Downloaded by Nga T??ng (ngahuong55@gmail.com) lOMoARcPSD|36041561
Again, the animation here is carefully designed to help make
Su p p ly Cu rve Sh ifters: In p u t Prices
clear that a shift in the supply curve means that there is a P Suppose the $6.00 price of milk falls.
change in the quantity supplied at each possible price. If it At each price, $5.00 the quantity of
seems tedious, you can turn it off. $4.00 Lattes supplied will increase $3.00 (by 5 in this $2.00 example). $1.00
In any case, be assured that, by the end of this chapter, the $0.00 Q
animation of curve shifts will be streamlined and simplified. 0 5 10 15 20 25 30 35
THE MARKET FORCES OF SUPPLY AND DEMAND 32
Su p p ly Cu rve Sh ifters: Tech n ology
§ Technology determines how much inputs are
required to produce a unit of output.
§ A cost-saving technological improvement has
the same effect as a fall in input prices,
shifts S curve to the right.
THE MARKET FORCES OF SUPPLY AND DEMAND 33
Su p p ly Cu rve Sh ifters: # of Sellers
§ An increase in the number of sellers increases
the quantity supplied at each price,
shifts S curve to the right.
THE MARKET FORCES OF SUPPLY AND DEMAND 34
Su p p ly Cu rve Sh ifters: Exp ectation s Example:
§ Events in the Middle East lead to expectations of higher oil prices.
§ In response, owners of Texas oilfields reduce
supply now, save some inventory to sell later at the higher price.
§ S curve shifts left.
In general, sellers may adjust supply* when their
expectations of future prices change.
(*If good not perishable)
THE MARKET FORCES OF SUPPLY AND DEMAND 35
Downloaded by Nga T??ng (ngahuong55@gmail.com) lOMoARcPSD|36041561
Su m m ary: Variab les th at Influence Sellers Variable
A change in this variable… Price …causes a movement
along the S curve Input Prices
…shifts the S curve Technology
…shifts the S curve # of Sellers
…shifts the S curve Expectations
…shifts the S curve
THE MARKET FORCES OF SUPPLY AND DEMAND 36
“Tax return preparation software” means programs like A A C C T I V V E E L L E E A A R R N I N G G 2 Sup p ly Curve
TurboTax by Quicken and TaxCut by H&R Block. Draw a supply curve for tax return preparation software. What happens to it in each of the following scenarios?
A. Retailers cut the price of the software.
B. A technological advance allows the software to be produced at lower cost.
C. Professional tax return preparers raise the
price of the services they provide. 37 A A C C T I V V E E L L E E A A R R N I N G G 2 A. F . Fall i in p
p rice of tax retu rn software Price of tax return S S cu cu rve rve does software 1 not sh sh ift. P Mo Mo ve down 1 along the cu cu rve P to a lower P 2 and lower Q. Q Q Quantity of tax 2 1 return software 38 A A C C T I V V E E L L E E A A R R N I N G G 2
B. Fall in cost of p rod u cin g th e softw are Price of tax return S cu cu rve sh sh ifts S software 1 S2 to the right: at each ch pri ri ce, P1 Q increases. Q Q Quantity of tax 1 2 return software 39
Downloaded by Nga T??ng (ngahuong55@gmail.com) lOMoARcPSD|36041561 A A C C T I V V E E L L E E A A R R N I N G G 3
C. Professional p rep arers raise th eir p rice Price of tax return S1 This s sh sh ifts the software demand curve rve for tax preparation software, not the supply cu cu rve. Quantity of tax return software 40
Sup p ly an d D em and Together
We now return to the latte example to illustrate the concepts
of equilibrium, shortage and surplus. P $6.00 D S Equilibrium: P has reached $5.00 the level where $4.00 quantity supplied equals $3.00 quantity demanded $2.00 $1.00 $0.00 Q 0 5 10 15 20 25 30 35
THE MARKET FORCES OF SUPPLY AND DEMAND 41 Equ ilib riu m p rice:
the price that equates quantity supplied with quantity demanded P $6.00 D S P QD QS $5.00 $0 24 0 $4.00 1 21 5 $3.00 2 18 10 3 15 15 $2.00 4 12 20 $1.00 5 9 25 $0.00 Q 6 6 30 0 5 10 15 20 25 30 35
THE MARKET FORCES OF SUPPLY AND DEMAND 42
Equ ilib riu m q u an tity:
the quantity supplied and quantity demanded at the equilibrium price P $6.00 D S P QD QS $5.00 $0 24 0 $4.00 1 21 5 $3.00 2 18 10 3 15 15 $2.00 4 12 20 $1.00 5 9 25 $0.00 Q 6 6 30 0 5 10 15 20 25 30 35
THE MARKET FORCES OF SUPPLY AND DEMAND 43
Downloaded by Nga T??ng (ngahuong55@gmail.com) lOMoARcPSD|36041561
Su rp lu s (a.k .a. excess su p ply):
when quantity supplied is greater than quantity demanded P Example: $6.00 D Surplus S If P = $5, $5.00 then $4.00 QD = 9 lattes $3.00 and QS = 25 lattes $2.00 resulting in a $1.00 surplus of 16 lattes $0.00 Q 0 5 10 15 20 25 30 35
THE MARKET FORCES OF SUPPLY AND DEMAND 44
Su rp lu s (a.k .a. excess su p ply):
when quantity supplied is greater than quantity demanded P Facing a surplus, $6.00 D Surplus S sellers try to increase $5.00 sales by cutting price. $4.00 This causes $3.00
QD to rise and QS to fall… $2.00 …which reduces the surplus. $1.00 $0.00 Q 0 5 10 15 20 25 30 35
THE MARKET FORCES OF SUPPLY AND DEMAND 45
Su rp lu s (a.k .a. excess su p ply):
when quantity supplied is greater than quantity demanded P Facing a surplus, $6.00 D Surplus S sellers try to increase $5.00 sales by cutting price. $4.00 This causes $3.00
QD to rise and QS to fall. $2.00 Prices continue to fall until market reaches $1.00 equilibrium. $0.00 Q 0 5 10 15 20 25 30 35
THE MARKET FORCES OF SUPPLY AND DEMAND 46
Sh ortage (a.k .a. excess dem and ):
when quantity demanded is greater than quantity supplied P $6.00 D S Example: If P = $1, $5.00 then $4.00 QD = 21 lattes $3.00 and QS = 5 lattes $2.00 resulting in a $1.00 shortage of 16 lattes $0.00 Shortage Q 0 5 10 15 20 25 30 35
THE MARKET FORCES OF SUPPLY AND DEMAND 47
Downloaded by Nga T??ng (ngahuong55@gmail.com) lOMoARcPSD|36041561
Sh ortage (a.k .a. excess dem and ):
when quantity demanded is greater than quantity supplied P Facing a shortage, $6.00 D S sellers raise the price, $5.00
causing QD to fall $4.00 and QS to rise, $3.00 …which reduces the shortage. $2.00 $1.00 Shortage $0.00 Q 0 5 10 15 20 25 30 35
THE MARKET FORCES OF SUPPLY AND DEMAND 48
Sh ortage (a.k .a. excess dem and ):
when quantity demanded is greater than quantity supplied P Facing a shortage, $6.00 D S sellers raise the price, $5.00
causing QD to fall $4.00 and QS to rise. $3.00 Prices continue to rise $2.00 until market reaches equilibrium. $1.00 Shortage $0.00 Q 0 5 10 15 20 25 30 35
THE MARKET FORCES OF SUPPLY AND DEMAND 49
Step one requires knowing all of the things that can shift D
Th ree Step s to An alyzin g Ch an ges in Eq ’m
and S – the non-price determinants of demand and of supply. T T o o d d e e tte e r r m m iin n e e tth h e e e e ffffe e c c tts s o o ff a a n n y y e e v v e e n n tt,, 1 1 .. D D e e c c iid d e e w w h h e e tth h e e rr e e v v e e n n tt s s h h iifftts s S S c c u u r r v v e e ,, D D c c u u r r v v e e ,, o o r r b b o o tth h .. 2 2 .. D D e e c c iid d e e iin n w w h hiic c h h d d iir r e e c c ttiio o n n c c u u r r v v e e s s h h iifftts s .. 3 3 .. U U s s e e s s u u p p p plly y --d d e e m m a a n n d d d diia a g g r r a a m m tto o s s e e e e h h o o w w tth h e e s s h hiifftt c c h h a a n n g g e e s s e e q q’’m m P P a a n n d d Q Q ..
THE MARKET FORCES OF SUPPLY AND DEMAND 50
EXAM PLE: Th e M ark et for H yb rid Cars P price of S1 hybrid cars P1 D1 Q Q1 quantity of hybrid cars
THE MARKET FORCES OF SUPPLY AND DEMAND 51
Downloaded by Nga T??ng (ngahuong55@gmail.com) lOMoARcPSD|36041561
EXAM PLE 1: A Sh ift in D em an d EVENT TO BE AN ALYZED: P Increase in price of gas. S1 STEP 1: P2 D curve shifts because price of gas STEP 2: P1 affects demand for D shifts right hybrids. because high gas S S c T u E rv P e3 :d oes not price makes hybrids D D 1 2 sh T ihft e, b s e hi c ft a u c s a e u s p e rsic e a n more attractive Q o i f n g craes a d s o e eis n n p o ri t c e Q Q relative to other cars. 1 2 af a fnedc t q c uo a s nt io t f y of pr h o y d bruic d i n c g a rh s.ybrids.
THE MARKET FORCES OF SUPPLY AND DEMAND 52
EXAM PLE 1: A Sh ift in D em an d Notice: P When P rises, S1 producers supply a larger quantity P2 of hybrids, even
though the S curve P1 has not shifted.
Always be careful D D
to distinguish b/w 1 2
a shift in a curve Q
a shift in a curve
Q1 Q2 and nd a movement
along the curve.
THE MARKET FORCES OF SUPPLY AND DEMAND 53
Term s for Sh ift vs. M ovem en t Alon g Cu rve
“Supply” refers to the position of the supply curve, while
§ Change in supply: a shift in the S curve
“quantity supplied” refers to the specific amount that
occurs when a non-price determinant of supply
changes (like technology or costs)
producers are willing and able to sell.
§ Change in the quantity supplied:
a movement along a fixed S curve
occurs when P changes
§ Change in demand: a shift in the D curve
Similarly, “demand” refers to the position of the demand
occurs when a non-price determinant of demand
changes (like income or # of buyers)
curve, while “quantity demanded” refers to the specific
§ Change in the quantity demanded:
a movement along a fixed D curve
amount that consumers are willing and able to buy.
occurs when P changes 54
If you’d like to be a rebel, delete this slide and all references
to the jargon it contains, and just use the terms “movement
along a curve” and “shift in a curve.” Note, however, that this
is not the official recommendation of Cengage/South-Western or Dr. Mankiw.
If you’d like to cover this slide but make it move more
quickly, delete the text next to each second-level bullet
(starting with “occurs when”). Instead, give the information
to your students verbally or rely on them to read it in the textbook.
Downloaded by Nga T??ng (ngahuong55@gmail.com) lOMoARcPSD|36041561
EXAM PLE 2: A Sh ift in Su p p ly EVENT: New technology P reduces cost of producing hybrid cars. S1 S2 STEP 1: S curve shifts because event affects STEP 2: P1 cost of production. S shifts right P2
D curve does not because event sh
S iTftE, b P e 3:c a use reduces cost, D1 pr T o h d e u c s t h iio ft n c taeucsh en so logy makes production Q is p rn i o c t e o t n o e f a o ll f the Q Q more profitable at 1 2 fa a c n to d rs q u th a a nt ti ta y ftfe o crti se. any given price. demand.
THE MARKET FORCES OF SUPPLY AND DEMAND 55
EXAM PLE 3: A Sh ift in Both Su p p ly an d D em an d EVENTS: P price of gas rises AND new technology reduces S1 S2 production costs STEP 1: P2 Both curves shift. P1 STEP 2: Both shift to the right. STEP 3: D D 1 2
Q rises, but effect Q
on P is ambiguous: Q1 Q2 If demand increases more
than supply, P rises.
THE MARKET FORCES OF SUPPLY AND DEMAND 56
EXAM PLE 3: A Sh ift in Both Su p p ly an d D em an d EVENTS: P price of gas rises AND new technology reduces S1 S2 production costs STEP 3, cont. P1 But if supply P2 increases more than demand, D D P falls. 1 2 Q Q1 Q2
THE MARKET FORCES OF SUPPLY AND DEMAND 57 Important note about Event B: A A C C T I V V E E L L E E A A R R N I N G G 3
Shifts in su p ply an d deman d
Use the three-step method to analyze the effects of
each event on the equilibrium price and quantity of
The royalties that sellers must pay the artists are part of music downloads.
sellers’ “costs of production.” Typically, this royalty is a
Event A: A fall in the price of CDs
Event B: Sellers of music downloads negotiate a
fixed amount each time one of the artist’s songs is
reduction in the royalties they must pay for each song they sell.
downloaded. Event B, therefore, describes a reduction in
Event C: Events A and B both occur.
sellers’ “costs of production.” 58
Downloaded by Nga T??ng (ngahuong55@gmail.com) lOMoARcPSD|36041561
This is an extension of Active Learning exercise 1C, where A A C C T I V V E E L L E E A A R R N I N G G 3
A. Fall in price of CD s
we saw that a fall in the price of compact discs would cause a The market for STEPS music downloads
fall in demand for music downloads, because the two goods P
1. D curve shifts S1 are substitutes. 2. D shifts left P1
3. P and Q both P2 fall. D D1 2 Q Q Q 2 1 59
NOTE: Don’t worry that the text on this slide looks garbled A A C C T I V V E E L L E E A A R R N I N G G 3
B. Fall in cost of royalties
in “Normal view” (i.e., edit mode). It works fine in “Slide The market for STEPS music downloads
Show” (i.e., presentation mode). P
1. S curve shifts S1 S2 (Royalties are part
2. S shifts right of sellers’ costs) P1 3. P falls,
Event B: Sellers of music downloads negotiate a reduction in P Q rises. 2
the royalties they must pay for each song they sell. This event D1
causes a fall in “costs of production” for sellers of music Q
Q1 Q2 60
downloads. Hence, the S curve shifts to the right.
It’s not necessary to draw a graph here. The answers to steps A A C C T I V V E E L L E E A A R R N I N N G G 3
C. Fall in p rice of CD s an d
1 and 2 should be clear from parts A and B. The answer to
fall in cost of royalties
step 3 is a combination of the results from A and B. S S T TE E P P S S 1 1 .. Bo Bo tth h cu cu rve rve s s sh sh iifftt (se (se e e p p a a rt rt s s A A & & B). B). 2 2 . D D sh sh ifftts s lefft, S S shifftts s righ h tt. 3 3 .. P P u u n n a a mb mb iig g u u o o u u sl sl y y ffa a lllls. s. Ef Ef ffe e ct ct o o n n Q Q iis s a a mb mb iig g u u o o u u s: s: T T he e fa a ll in demand re re duces s Q, tthe e in n crea a se se in n su su pplly y increa a ses Q Q .. 61 CO N CLUSIO N :
In the textbook, the conclusion of this chapter offers some
H ow Prices Allocate Resou rces
very nice elaboration on the second bullet point. There is also
§ One of the Ten Principles from Chapter 1:
Markets are usually a good way
an “In the News” box with a very nice article titled “In Praise
to organize economic activity.
§ In market economies, prices adjust to balance of Price Gouging.”
supply and demand. These equilibrium prices
are the signals that guide economic decisions
and thereby al ocate scarce resources.
THE MARKET FORCES OF SUPPLY AND DEMAND 62
Downloaded by Nga T??ng (ngahuong55@gmail.com) lOMoARcPSD|36041561 CH APTER SUMM ARY
§ A competitive market has many buyers and sellers,
each of whom has little or no influence on the market price.
§ Economists use the supply and demand model to analyze competitive markets.
§ The downward-sloping demand curve reflects the
Law of Demand, which states that the quantity
buyers demand of a good depends negatively on the good’s price. 63 CH APTER SUMM ARY
§ Besides price, demand depends on buyers’ incomes,
tastes, expectations, the prices of substitutes and
complements, and number of buyers.
If one of these factors changes, the D curve shifts.
§ The upward-sloping supply curve reflects the Law of
Supply, which states that the quantity sellers supply
depends positively on the good’s price.
§ Other determinants of supply include input prices,
technology, expectations, and the # of sellers.
Changes in these factors shift the S curve. 64 CHAPTER SUM MARY
§ The intersection of S and D curves determines the
market equilibrium. At the equilibrium price,
quantity supplied equals quantity demanded.
§ If the market price is above equilibrium,
a surplus results, which causes the price to fall.
If the market price is below equilibrium,
a shortage results, causing the price to rise. 65 CHAPTER SUM MARY
§ We can use the supply-demand diagram to
analyze the effects of any event on a market:
First, determine whether the event shifts one or
both curves. Second, determine the direction of
the shifts. Third, compare the new equilibrium to the initial one.
§ In market economies, prices are the signals that
guide economic decisions and allocate scarce resources. 66
Downloaded by Nga T??ng (ngahuong55@gmail.com)