Projections of Heat Stress in Vietnam Using Physically-Based Wet-Bulb Globe Temperature - Tạp chí Khoa học
Projections of Heat Stress in Vietnam Using Physically-Based Wet-Bulb Globe Temperature - Tạp chí Khoa học. Tài liệu được sưu tầm giúp bạn tham khảo, ôn tập và đạt kết quả cao. Mời bạn đọc đón xem.
Môn: Tài liệu Tổng hợp 3.6 K tài liệu
Trường: Tài liệu khác 3.9 K tài liệu
Tác giả:


Preview text:
No. 346 MAY 2025
Authors Dzung Nguyen-Le Long Trinh-Tuan Thanh Nguyen-Xuan Tung Nguyen-Duy Thanh Ngo-Duc Coordination Marie-Noëlle Woillez (AFD) Projections of Heat Stress in Vietnam Using Physically- Based Wet- Bulb Globe Temperature Research papers Introduction 6
Studied regions, Data and Methods 8 1.1. Studied regions 8
1.2. Heat stress index: WBGT estimated from Liljegren's Model 9
1.3. Impact-Relevant Thresholds 9 1.4. Data 10 1.5. Bias correction 13
2. Results and Discussions 14
2.1. Projected future changes in WBGT across Vietnam 14
2.2. Detailed WBGT projections for seven subregions of Vietnam 19 2.3. Comparison with sWBGT 23 2.4. Discussion 25 3. Conclusions 29 Bibliography 30 Appendix 33
A.1. Descriptions and equations of Liljegren's model 33
A.2. Simplified approximation of WBGT (sWBGT) 34
A.3. Recommended maximum WBGT exposure levels 35 A.4. Suporting Figures 36 2
Agence française de développement Papiers de recherche Research Papers
Les Papiers de Recherche de l’AFD ont pour but de
AFD Research Papers are intended to rapidly
diffuser rapidement les résultats de travaux en cours.
disseminate findings of ongoing work and mainly
Ils s’adressent principalement aux chercheurs, aux
target researchers, students and the wider academic
étudiants et au monde académique. Ils couvrent
community. They cover the ful range of AFD work,
l’ensemble des sujets de travail de l’AFD : analyse
including: economic analysis, economic theory, policy
économique, théorie économique, analyse des
analysis, engineering sciences, sociology, geography
politiques publiques, sciences de l’ingénieur,
and anthropology. AFD Research Papers and other
sociologie, géographie et anthropologie. Une
publications are not mutually exclusive.
publication dans les Papiers de Recherche de l’AFD n’en exclut aucune autre.
The opinions expressed in this paper are those of the
author(s) and do not necessarily reflect the position of
Les opinions exprimées dans ce papier sont cel es de
AFD. It is therefore published under the sole
son (ses) auteur(s) et ne reflètent pas
responsibility of its author(s) or its partner institutions.
nécessairement celles de l’AFD. Ce document est
publié sous l’entière responsabilité de son (ses)
auteur(s) ou des institutions partenaires. 3 Projections of Abstract also discussed, suggesting Heat Stress in Vietnam
The wet-bulb globe temperature
significant overestimations of Using Physically-Based
(WBGT) is a widely used index for exceedance days in most of
Wet-Bulb Globe Temperature
assessing heat stress. However,
Vietnam. Such biases could lead many studies on heat stress to misleading assessments, under climate change rely on unnecessary alarms, and simplified WBGT calculations, potentially flawed adaptation
which may introduce biases. In strategies, highlighting the AUTHORS this study, high-resolution
critical need for accurate WBGT
climate data and the physically- modeling in climate impact Dzung Nguyen-Le* based WBGT model are research. Department of Space employed to provide a more and Applications, reliable assessment of future Keywords University of Science and heat stress impacts across Climate Change, heat stress, Technology of Hanoi (USTH), Vietnam and its seven sub- WBGT, Global Warming Level, Vietnam Academy of Science climatic regions. Projected Vietnam and Technology (VAST),
changes are analyzed for three Hanoi, Vietnam
future periods — the near future Acknowledgements
(2021–2040), mid-future (2041–
This study is supported by the Long Trinh-Tuan
2060), and far future (2081–2100)
2nd phase of the GEMMES Vietnam Vietnam Academy Water
— relative to the baseline period project, funded by the French and Resources,
(1995–2014) under three Shared Development Agency (AFD) Hanoi, Vietnam
Socioeconomic Pathways (SSPs):
through Facility 2050, and by the Thanh Nguyen-Xuan
SSP1-2.6, SSP2-4.5, and SSP5-8.5. Vietnam Academy of Science Department of Space
Additionally, changes are and Technology (VAST) under and Applications,
assessed across different global
Grant THTETN.01/25-26. The down- University of Science and warming levels (GWL), ranging scaled CMIP6 data were Technology of Hanoi (USTH),
from 1.5°C to 4°C above the pre- obtained from the SEACLID/ Vietnam Academy of Science
industrial level. Long-term trends CORDEX-SEA project funded by and Technology (VAST), throughout the studied period the Asia Pacific Network for Hanoi, Vietnam
are also examined. The findings Global Change Research
reveal significant increases in (CRRP2023-658 08MY-Cruz) and Tung Nguyen-Duy
heat stress across Vietnam in the by the Vietnam National Oxford University Clinical
future. A major concern is the Foundation for Science and Research Unit, substantial increases in the Technology Development Ho Chi Minh city, Vietnam number of days exceeding (NAFOSTED) under Grant 105.06- Thanh Ngo-Duc impact-relevant heat stress
2021.14. We would like to express Department of Space
thresholds, most notably in the
our special thanks to Dr. Marie- and Applications,
Red River Delta and Mekong River
Noëlle Woillez from AFD for her University of Science and Delta, two most densely careful review and valuable Technology of Hanoi (USTH), populated and agriculturally suggestions to improve this Vietnam Academy of Science
critical sub-regions of Vietnam. manuscript. and Technology (VAST), Heat stress emergence and Hanoi, Vietnam
intensity are closely linked to the Original version
radiative forcing of SSP scenarios English
and the GWLs, with higher forcing scenarios and warmer GWL Accepted COORDINATION
producing more severe April 2025 conditions and a greater
Marie-Noëlle Woillez (AFD) frequency of exceedance days. The most severe impacts are
projected under SSP5-8.5 as well as GWLs of 3°C and 4°C, * Corresponding author indicating the urgent need to nguyen-le.dung@usth.edu.vn
limit future warming to mitigate
the risk of heat stress. Biases in
simplified WBGT calculations are 4 Résumé
des conditions plus sévères et attentive et ses précieuses
La température au globe humide
une fréquence accrue de jours
suggestions visant à améliorer
(WBGT) est un indice largement de dépassement des seuils ce manuscrit.
utilisé pour évaluer le stress
critiques. Les impacts les plus thermique. Cependant, de
sévères sont projetés pour le Version originale
nombreuses études sur le stress
scénario SSP5-8.5 ainsi qu’aux Anglais thermique dans le contexte du niveaux de réchauffement de changement climatique
3°C et 4°C, soulignant l’urgence Acceptée s'appuient sur des calculs
de limiter le réchauffement futur Avril 2025
simplifiés du WBGT, ce qui peut
pour atténuer les risques liés au
introduire des biais. Dans cette
stress thermique. Les biais des
étude, des données climatiques
calculs simplifiés du WBGT sont
à haute résolution et un modèle
également discutés, suggérant
WBGT basé sur la physique sont
une surestimation significative utilisés afin de fournir une du nombre de jours de évaluation plus fiable des dépassement dans la majeure impacts futurs du stress
partie du Vietnam. De tels biais thermique au Vietnam et dans pourraient conduire à des ses sept sous-régions clima- évaluations trompeuses, des
tiques. Les changements projetés
alarmes inutiles et des stratégies
sont analysés pour trois périodes
d’adaptation potentiel ement
futures — le futur proche (2021–
erronées, mettant en évidence la
2040), le milieu du siècle (2041– nécessité cruciale d’une
2060) et le futur lointain (2081–
modélisation précise du WBGT
2100) — par rapport à la période dans la recherche sur les
de référence (1995–2014) sous impacts climatiques.
trois scénarios de trajectoires socio-économiques partagées Mots-clés
(SSP) : SSP1-2.6, SSP2-4.5 et SSP5- Changement climatique, stress
8.5. De plus, les évolutions sont thermique, WBGT, niveau de
évaluées pour différents niveaux
réchauffement global, Vietnam
de réchauf-fement global (GWL),
allant de 1,5°C à 4°C au-dessus Remerciements du niveau préindustriel. Les
Cette étude est soutenue par la tendances à long terme sur deuxième phase du projet
l’ensemble de la période étudiée GEMMES Vietnam, financé par
sont également examinées. Les l'Agence Française de
résultats révèlent une augmen- Développement (AFD) via la
tation significative du stress
Facilité 2050, et par l'Académie thermique au Vietnam dans le
des Sciences et de la Technologie
futur. L’augmentation substan-
du Vietnam (VAST) dans le cadre tielle du nombre de jours
de la subvention THTETN.01/25-26.
dépassant des seuils critiques de
Les données réduites du CMIP6 stress thermique est particu-
ont été obtenues dans le cadre
lièrement préoccupante, notam- du projet SEACLID/CORDEX-SEA, ment dans le delta du fleuve financé par le Réseau Asie-
Rouge et le delta du Mékong, les
Pacifique pour la recherche sur le deux sous-régions les plus changement global (CRRP2023-
densément peuplées et cruciales 658 08MY-Cruz) et par la pour l’agriculture du pays. Fondation nationale pour le
L’émergence et l’intensité du
développement de la science et stress thermique sont étroi- de la technologie du Vietnam
tement liées au forçage radiatif (NAFOSTED) sous la subvention
des scénarios SSP et aux niveaux
105.06-2021.14. Nous souhaitons de réchauffement global, les exprimer nos remerciements
scénarios à fort forçage et les
spéciaux au Dr. Marie-Noëlle
GWL les plus élevés produisant
Woillez de l'AFD pour sa relecture 5 Introduction
Heat stress has been identified as a
instruments and skil ed operators. To
leading cause of weather-related deaths
address these limitations, various
(Barriopedro et al., 201 ; Buzan et al., 2015)
simplified methods have been proposed
and has broad social and economic
to approximate WBGT using standard
impacts, including reduced agricultural
meteorological data. However, recent
productivity, increased healthcare costs,
studies have criticized such simplifi-
and decreased labor productivity (e.g.
cations for their inaccuracies (e.g. Jacobs
Barriopedro et al., 201 ; Dunne et al 2013;
et al. 2019; Kong and Huber 2022; Qiu et al.
Kjel strom et al. 2016; Schleussner et al.,
2024). Kong and Huber (2022) show that
2016; Maia-Silva et al. 2020; Orlov et al.
simplified WBGT significantly over-
2020; Shen et al. 2020; Ebi et al. 2021). It is
estimates heat stress in hot-humid
projected to become an even more
regions and underestimates it in arid
significant threat in the future under
regions. Qiu et al. (2024) further suggest
global warming (e.g. Sherwood and Huber
that simplified WBGT overestimates the
2010; Diffenbaugh and Giorgi 2012; Wil ett
increase in heat stress levels under future
and Sherwood 2012; Im et al. 2017; Buzan
warming scenarios, with the degree of
and Hubner 2020; Li et al. 2020;
overestimation strongly correlated with
Schwingshackl et al. 2021).
local climatological temperature. They
emphasize the need for using physically-
To quantify heat stress, various heat stress
based WBGT calculations with high-
indices have been proposed. resolution climate data for more reliable
Nevertheless, only a limited subset of
heat stress assessments in climate
these indices is suitable for evaluating the change research.
impacts of climate change (de Freitas and
Grigorieva 2017). Among them, the wet-
Located in tropical Southeast Asia,
bulb globe temperature (WBGT) is widely
Vietnam is among the countries most
used due to its straightforward physical
severely impacted by climate change
interpretation, incorporation of al four key
(UNFCCC 2007). Its wide longitudinal range
ambient factors contributing to heat
and complex terrain require high-
stress (temperature, humidity, wind, and
resolution climate projections for effective
radiation), and established safety
adaptation and mitigation strategies.
thresholds for activity adjustments (e.g.
Based on Global Climate Models (GCMs)
ISO 2017). Despite its advantages, the
from Phase 6 of the Coupled Model WBGT measurement is resource-
Intercomparison Project (CMIP6; Eyring
intensive, requiring specialized et al., 2016), Schwingshackl et al. (2021) 6
project significant increases in heat stress
Importantly, none of these results
over Southeast Asia throughout this
incorporate critical heat stress thresholds
century. However, the coarse spatial
that directly impact human health and
resolution of CMIP6 GCMs, typically 100–
well-being. Tropical regions are
200 km, restricts their ability to accurately
particularly vulnerable to heat stress,
represent regional climate variability in
which is a growing health hazard in areas
Vietnam (Desmet and Ngo-Duc, 2022). To
lacking adequate health surveil ance and
address this limitation, the Coordinated
intervention systems (Gao et al. 2019).
Regional Downscaling Experiment-
Given the high prevalence of outdoor
Southeast Asia (CORDEX-SEA) project
activities in Vietnam, accurate
(Tangang et al., 2020; Ngo-Duc et al., 2024)
assessments of heat stress impacts
dynamically downscales a suite of CMIP6
require physically-based models. The
GCMs to a high-resolution grid of 25 km.
WBGT model developed by Liljegren et al.
This dataset, which extends through the
(2008) is highly sophisticated, based on
end of the 21st century under the latest
standard meteorological data, wel -
Shared Socio-economic Pathways (SSPs)
calibrated and validated (Liljegren et al.
(O'Neill et al., 2017), provides a valuable
2008; Lemke and Kjel strom 2012). This
opportunity for comprehensive study projects future changes in heat
assessments of heat stress impacts in
stress across Vietnam and its seven sub-
Vietnam using multi-model, and multi-
climatic regions using Liljegren’s model scenario frameworks.
with high-resolution climate data for
explicit calculation of WBGT. The
Recent studies in Vietnam have examined
calculated WBGT values will be linked to
heat stress in major cities like Hanoi
critical heat stress thresholds directly
(Hoang et al. 2022), Ho Chi Minh City (Dang
relevant to human health. To the best of
et al. 2019), other urban areas (Phung et al.
our knowledge, this is the first application
2017), and the entire country (Vu and Ngo-
of such an approach in Vietnam and
Duc 2024). These studies consistently
Southeast Asia. The results provide
report increasing heat stress over recent
valuable insights into the socio-economic
decades with notable socio-economic
and health implications of heat stress,
implications. However, their focus is on
offering essential guidance for policy-
historical variations without providing
makers to develop effective climate
projections under global warming. Further,
change adaptation and mitigation
they rely on simplified heat stress indices strategies.
based only on daily air temperature and
humidity, which are less effective for
This paper is organized as fol ows.
assessing outdoor heat stress, particularly
Section 2 provides a brief description of
under high solar radiation conditions.
the study regions, the calculation of WBGT, 7
its impact-relevant thresholds, and data
sources. Section 3 presents the main
results and related discussions. Finally, Section 4 draws conclusions. 8
1. Studied regions, Data and Methods 1.1. Studied regions
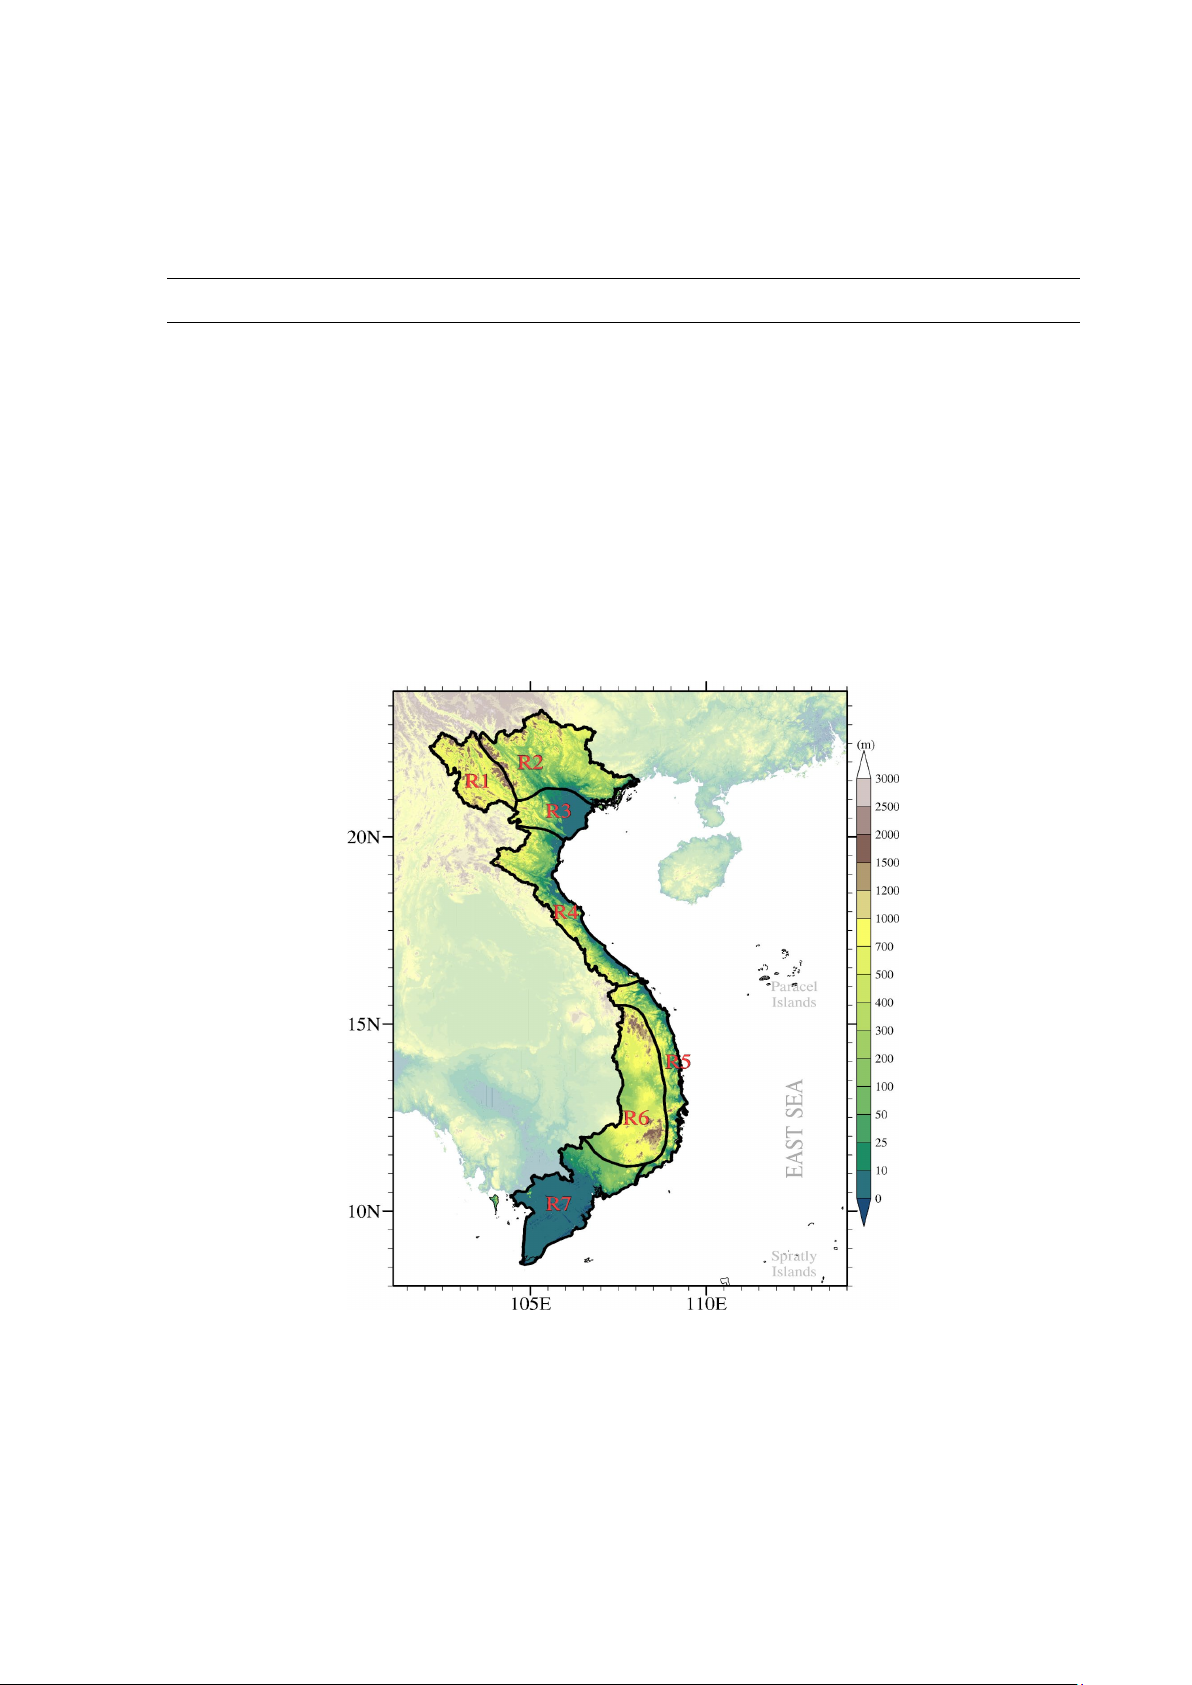
This study focuses on Vietnam, specifically examining its seven sub-climatic regions
(Figure 1). These subregions — Northwest (R1), Northeast (R2), Red River Delta (R3), North
Central (R4), Central South (R5), Central Highlands (R6), and Southern (R7) — are categorized
based on variations in radiation, temperature, and rainfall, with the North domain (R1-R4)
differing from the South domain (R5-R7) in terms of radiation and temperature, while rainfall
further differentiates subregions within each domain (Nguyen and Nguyen, 2004).
Figure 1. Map of Vietnam and location of the seven sub-climatic regions
Source: Authors’ own visualization. Original. Topography data (in color) is extracted from Hydroshed data (NASA SRTM 2013). 9
1.2. Heat stress index: WBGT estimated from Liljegren's Model
WBGT was developed by US military ergonomists in the 1950s. This index is widely used and
recognized to assess heat stress conditions, especially for working people. It is calculated as
a weighted average of three temperature measurements: natural wet-bulb temperature
(Tw), black globe temperature (Tg), and dry bulb temperature (Ta) (Yaglou and Minard 1957).
Tw is measured with a wetted thermometer exposed to the wind and heat radiation at the
site. It simulates the cooling of the body via sweat evaporation and strongly depends on air
temperature and humidity, but also on heat radiations and wind speed. Tg is measured
inside a black globe and simulates the heat absorption from short- and long-wave
radiations, i.e. from the sun, the soil or from other heat sources in the workplace. It depends
on both the air temperature and wind speed. Ta corresponds to the air temperature,
measured with a “normal” thermometer, shaded from direct heat radiations.
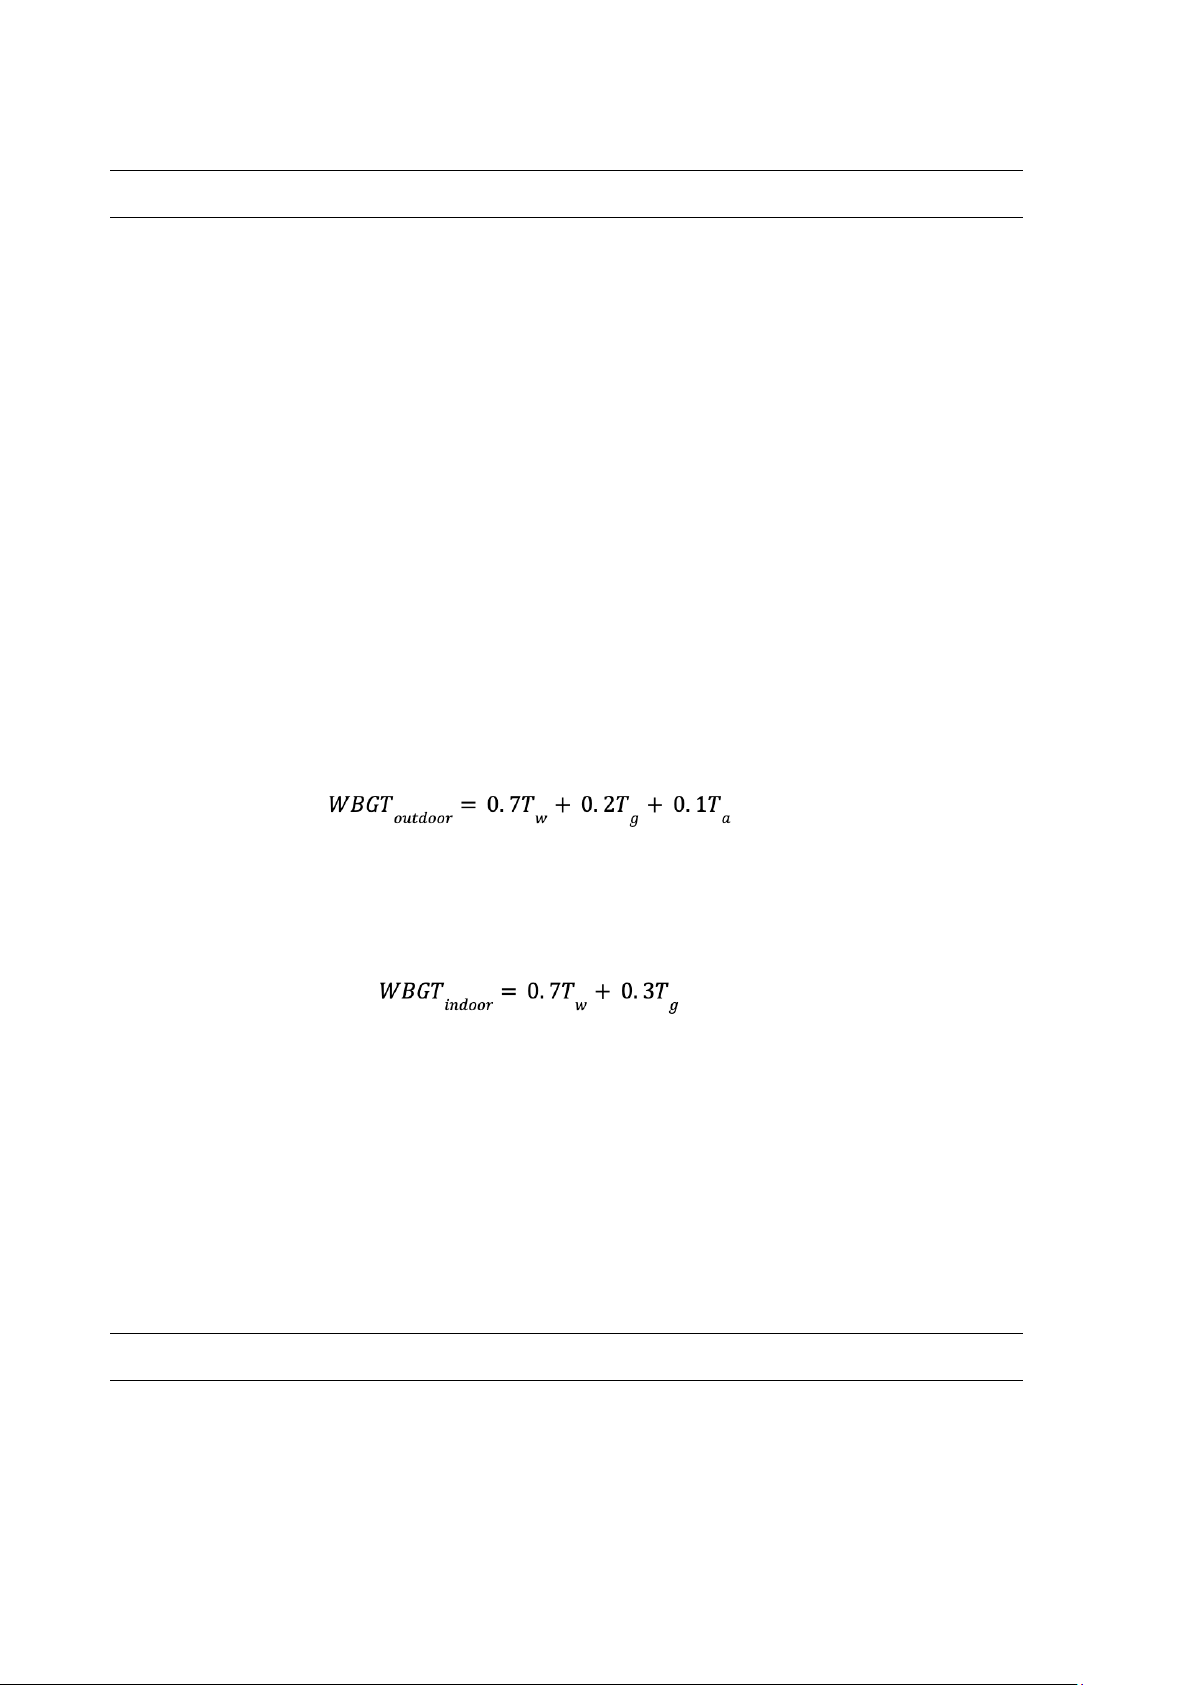
The specific equation used depends on the environment. For daytime condition in outdoor
environment exposed to direct solar radiations, the calculation is: (1)
For nighttime condition, indoor environment, or outdoor shaded areas (i.e., without direct
solar radiation), the equation is: (2)
Liljegren's model is a physically-based model that incorporates fundamental principles of
heat and mass transfer to approximate WBGT. Detailed descriptions and equations of the
model are given in Appendix A1. Liljegren (et al. 2008) provided their original code, which we
utilized here in a Python implementation by Kong and Huber (2022). Daily maximum WBGTx
and daily minimum WBGTm values are defined as the daily maximum of WBGToutdoor
(Equation 1) and daily minimum of WBGTindoor (Equation 2), respectively.
1.3. Impact-Relevant Thresholds
Analyzing changes in heat stress indices alone may not directly translate to societal
impacts, as these values vary based on the specific scales and definitions used. To better
assess the societal implications of heat stress, impact-relevant thresholds are utilized. 10
Although epidemiological studies often lack specific absolute thresholds for heat stress,
established benchmarks from occupational and athletic health safety regulations, as wel
as meteorological heat warning systems, provide a practical framework (Blazejczyk et al.,
2012; Kjel strom et al., 2009; Grundstein et al., 2015; Zhao et al., 2015). Fol owing a previous study
(Schwingshackl et al., 2021), WBGT is categorized into four impact-relevant levels (see
Table 1), adopting the threshold framework from Kjel strom et al., (2009). These thresholds
describe heat impacts on workers during sustained moderate activity, i.e. an approximate metabolic rate of 300 Watts.
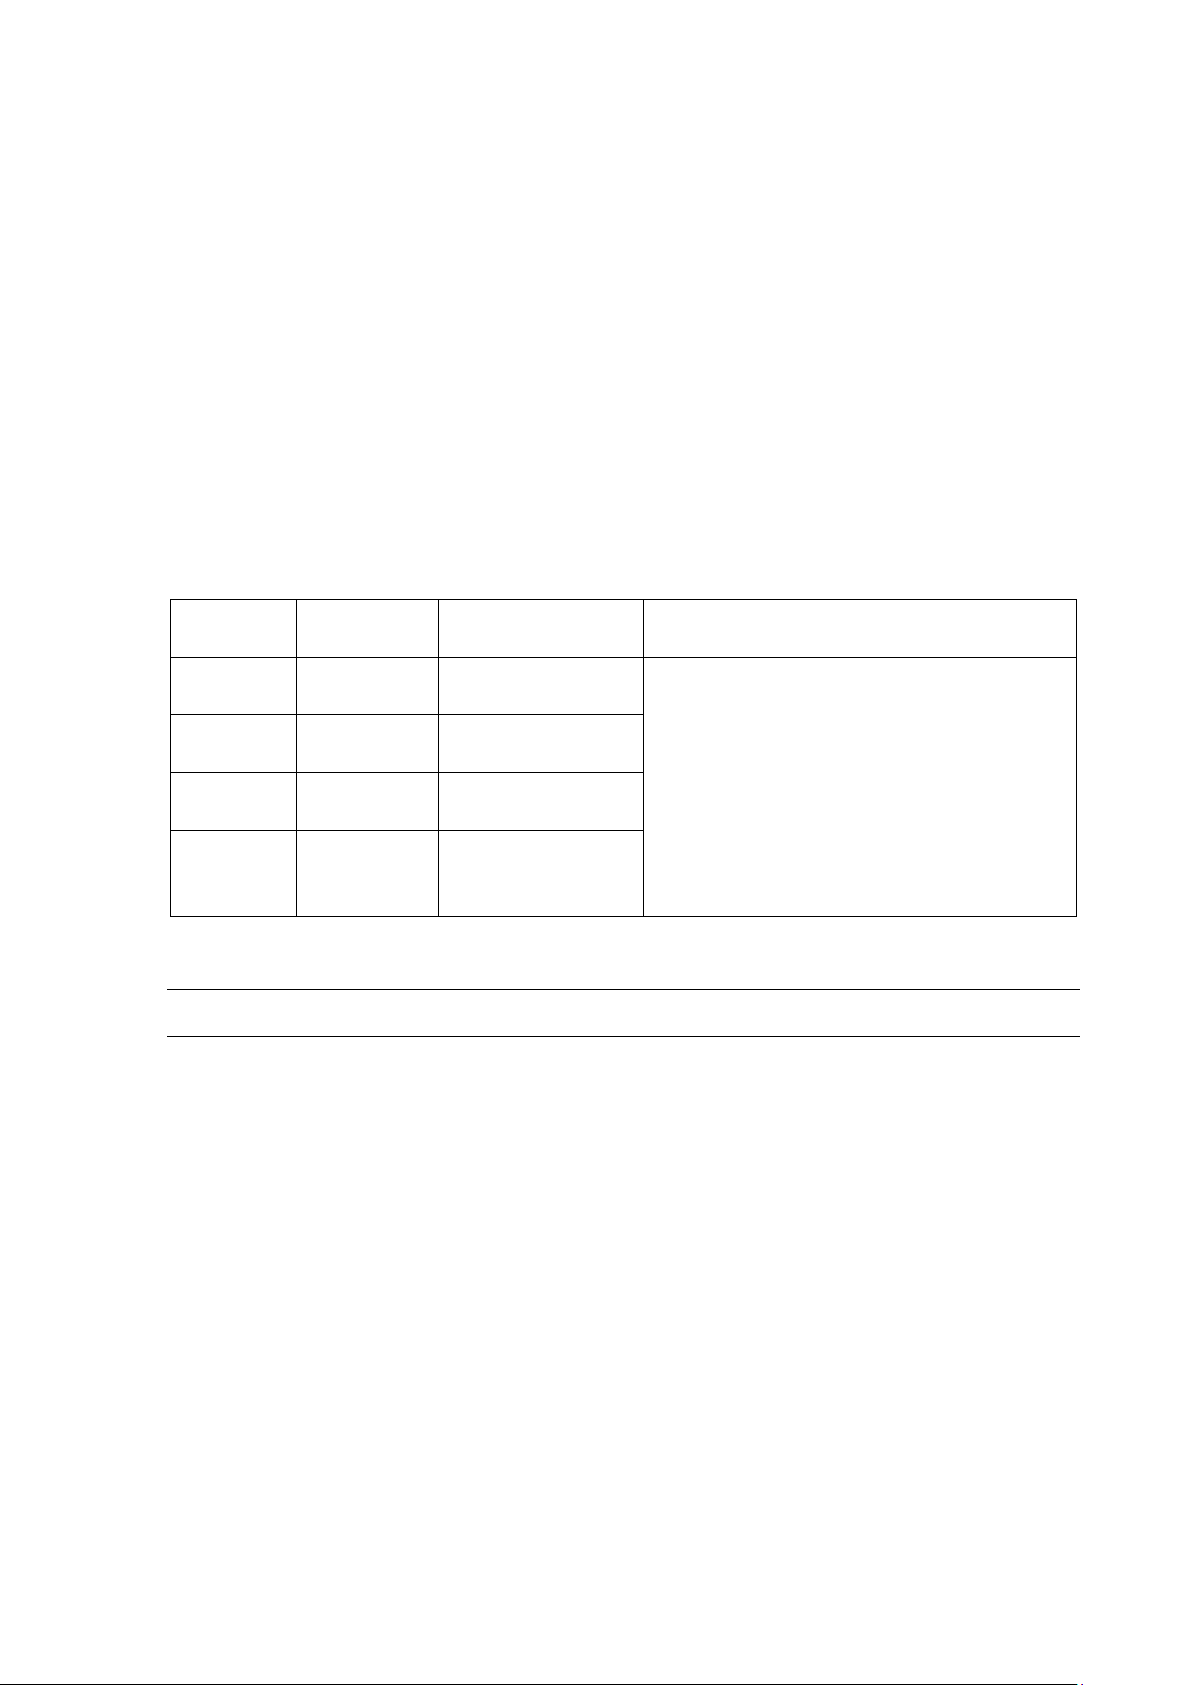
Table 1. Overview of the WBGT thresholds used in this study,
distinguishing between four different severity levels Levels Thresholds Recommendations Assessment base Level 1 29 °C 25% rest/hour Level 2 30.5 °C 50% rest/hour
Recommended maximum WBGT exposure
levels for medium work (~300 W) and
rest/work ratios for an average acclimatized Level 3 32 °C 75% rest/hour
worker with light clothing. Source: Kjellstrom et al. (2009) No work at al Level 4 37 °C (100% rest/hour) 1.4. Data
In this study, two types of datasets are used: reanalysis and climate model projections. The
reanalysis data from ECMWF-ERA5 (Hersbach et al., 2020) are used for calculating WBGT for
the period of 1985–2014, serving as a reference for the bias correction procedure. Climate
projections are obtained from the outputs of two CMIP6 GCMs (NorESM2-MM and CNRM-
ESM2-1, see Table 2), dynamically downscaled over the CORDEX-SEA domain to a resolution
of 25 km (Tangang et al., 2020). These downscaled datasets are generated using the non-
hydrostatic version of the ICTP Regional Climate Model (RCM), RegCM4-NH (Coppola et al.,
2021). For more information on the RegCM4-NH configuration, refer to Ngo-Duc et al.
(2024). Note that the Equilibrium Climate Sensitivity (ECS) of NorESM2 is 2.5°C, i.e. at the lower
end of the ”likely” range of ECS (2.5°C-4°C) assessed in the Sixth Assessment Report (AR6) of
IPCC (2021), while the ECS of CNRM-ESM2 is 4.76°C (Bock et al., 2020), i.e. at the high end of the
IPCC “very likely” range (2°C-5°C). 11
Three SSPs scenarios (SSP1-2.6, SSP2-4.5, and SSP5-8.5) are analyzed to represent a range of
global greenhouse gas emission scenarios. In these scenarios, global temperature would
rise by 1.8°C, 2.7°C and 4.4°C respectively above pre-industrial level by the end of the century
(IPCC,2021). The baseline period spans 1995–2014 (20-year), while the future period extends
from 2015 to 2100. The future period is further divided into three sub-periods: near future
(2021–2040), mid-future (2041–2060), and far future (2081–2100).
Table 2. List of two CMIP6 GCMs used in the dynamical downscaling No GCM Original Resolution (lat. × lon.) Member Variant Equilibrium Climate Sensitivity (ECS) 1 NorESM2-MM 1.25°×0.94° r1i1p1f1 2.5°C 2 CNRM-ESM2-1 1.41°×1.40° r1i1p1f1 4.76°C
For WBGT calculations, several variables are required, including 2-meter near-surface air
temperature (Ta), 2-meter relative humidity (RH), 10-meter wind speed (WS), surface
downwelling shortwave radiation (RSDS), and surface air pressure (PS). These variables are
extracted from al RCM outputs and ERA5 at a 3-hourly temporal resolution. Since RH is not
directly provided in ERA5, near-surface dew point temperature (Td) is used together with Ta
to derive RH by August–Roche–Magnus approximation. To ensure consistency, all RCM
outputs are spatially interpolated onto the 0.25° × 0.25° latitude–longitude grid of ERA5.
Subsequently, all calculations are conducted separately for each RCM, and the results from
the mean of the two RCM experiments are presented.
In addition, following the approach of IPCC AR6 and Hausfather et al. (2022), we complement
scenario-based projections with GWL-based analyses. This method is justified by the strong
relationship between climate variable changes (e.g., temperature, precipitation) and GWL,
regardless of the emission pathway or timing of threshold exceedance (IPCC, 2021). GWLs of
1.5°C, 2°C, 3°C, and 4°C are defined relative to the period 1850–1900, with YGWL representing
the year when the 20-year centered average of the the global mean surface air
temperature anomaly series first exceeds each threshold. The GWL periods for the two GCMs
and three SSP scenarios used in this study fol ow Hauser et al. (2022), applying a 20-year
window spanning 10 years before and 9 years after YGWL. Results are presented as the
average across models and scenarios reaching a given GWL. 12 1.5. Bias correction
As climate models inevitably exhibit biases, a bias correction procedure is applied to adjust
the calculated WBGT derived from simulations and projections. We employ the quantile
delta mapping (QDM) approach described by Cannon et al. (2015) to match the distributions
of RCM outputs during the application period to those of the ERA5 reanalysis during the
historical period (1985–2014). By considering distributional changes between the reference
and future periods for each quantile, QDM can accurately capture shifts in heat extremes
while minimizing the risk of introducing artificial trends (Cannon et al. 2015; Maraun 2016).
QDM is applied to daily maximum and minimum WBGT distributions of the ensemble mean
at every grid point separately and for each month of the year individually. We utilized
50 quantiles for QDM, which is a balance between flexibility and the risk of overfitting
(Zscheischler et al. 2019). 13
2. Results and Discussions
2.1. Projected future changes in WBGT across Vietnam
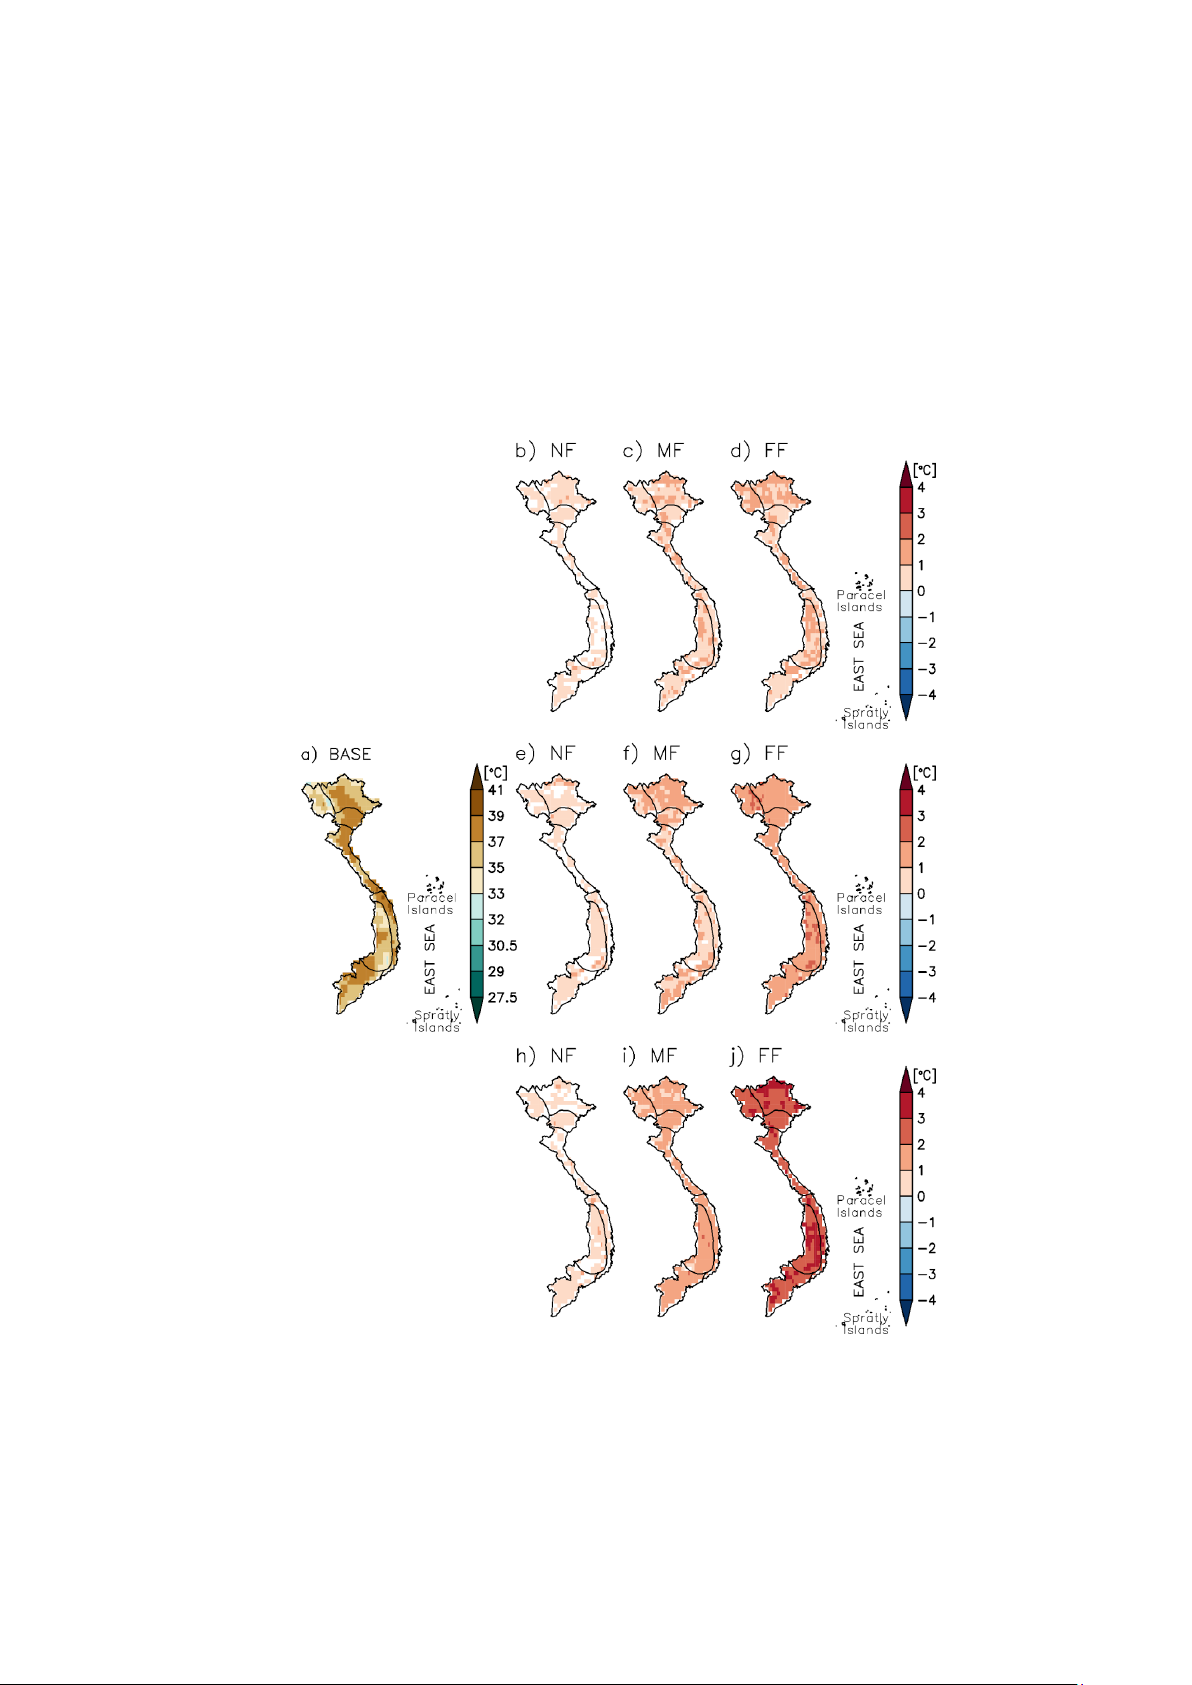
During the baseline period (1995–2014), the simulated climatological annual maximum
WBGTx (WBGTx,x) already exceeded the Level 3 (>32°C) across Vietnam. It even surpasses the
Level 4 (>37°C) in many areas of R3, R4, R5, western R2, central R6, and certain northwestern
areas of R7 (Figure 2(a)). Projections for all future periods suggest significantly (p-value<0.05)
warmer WBGTx,x across nearly all subregions. The lowest increases are projected under
SSP1-2.6 (Figures 2(b)–(d)), and the highest are obtained under SSP5-8.5 (Figures 2(h)–(j)).
More specifical y, meanwhile the differences between scenarios remain modest in the near
future (2021–2040), scenario-dependent variations become more pronounced in the mid-
(2041–2060) and far future (2081–2100). Spatially, projected changes in WBGTx,x in the far
future under lower emission scenarios resemble those in the mid-future under higher
emission scenarios, such as the similarity between Figures 2(d) and 2(f) and between 2(g)
and 2(i). In the near future, increases in WBGTx,x relative to the baseline period are generally
less than 1°C across Vietnam, regardless of the scenarios. Under SSP1-2.6, WBGTx,x increases
mildly by around 1°C in the mid-future and less than 2°C in the far future (Figures 2(c) and
2(d)). Slightly higher increases are projected under the “warmer” SSP2-4.5, with WBGTx,x
increases around 2°C from the mid- to far future (Figures 2(f) and 2(g)). Unsurprisingly, the
most pronounced increases are projected in the far future under SSP5-8.5, generally
exceeding 2°C and possibly surpassing 3°C in central R6, northernmost R2, and southwestern
R7 (Figure 2(j)). Additionally, significant (p-value<0.05) increasing trends in WBGTx,x of
approximately 0.2, 0.3 and 0.4°C per decade are projected across Vietnam under SSP1-2.6,
SSP2-4.5, and SSP5-8.5, respectively, during the entire studied period (1985–2100) (Figure S1).
Overall, it is suggested that WBGTx,x increases significantly over Vietnam by the end of this
century, with the magnitude scaling with radiative forcing.
For quantifying increases in human heat stress due to climate change, exceedances
of WBGTx beyond impact-relevant thresholds provides a more informative metric than
actual values. Figure 3 shows the annual number of days (Nx,3) on which WBGTx exceeds the
Level 3 (>32°C). During the baseline period, the average number Nx,3 is generally below
100 days per year (d/yr) across most subregions (Figure 3a). However, higher values are
observed in northern R5, and particularly northwestern R7, where Nx,3 already reaches 120–
140 d/yduring the baseline period. In contrast, Nx,3 are less than 20–40 dy/y in R1, northeastern
R2, and R6. Similar to WBGTx,x, projected differences in Nx,3 between scenarios are relatively 14
small in the near future, but are increasingly significant in the mid- and far future
(Figures 3(b)–(j)). Projected changes in the far future under lower emission scenarios also
resemble those in the mid-future under higher emission scenarios. Moreover, projected Nx,3
increases scale with radiative forcing, highlighting the direct linkage between emission
pathways and heat stress severity. Specifically, in the near future, increases in Nx,3 are less
than 30 dy/y in R1–R6 and less than 60 dy/y in R7 under all scenarios. Under SSP1-2.6, increases
in Nx,3 remain modest even in the far future, generally below 30 dy/y, except for R7, where
increases range from 60 to 90 dy/y (Figure 3(d)). Under SSP2-4.5, increases are slightly higher,
reaching 90 to 120 dy/y in R7, while only 30 to 60 dy/y in other subregions in the far future
(Figure 3(g)). The largest increases occur under SSP5-8.5 in the far future, with 60 to 120 dy/y
in R1–R6 and over 150 dy/y in R7 (Figure 3(j)). Significant (p-value<0.05) increasing trends of
Nx,3 are obtained throughout the study period, with less than 5 days per decade (dy/dc)
under SSP1-2.6, around 5 dy/dc under SSP2-4.5, and 5–10 dy/dc or slightly higher under SSP5-
8.5 in R1–R6 (Figure S2). However, R7 shows much more significant trends, exceeding 15– 20 dy/dc under SSP5-8.5.
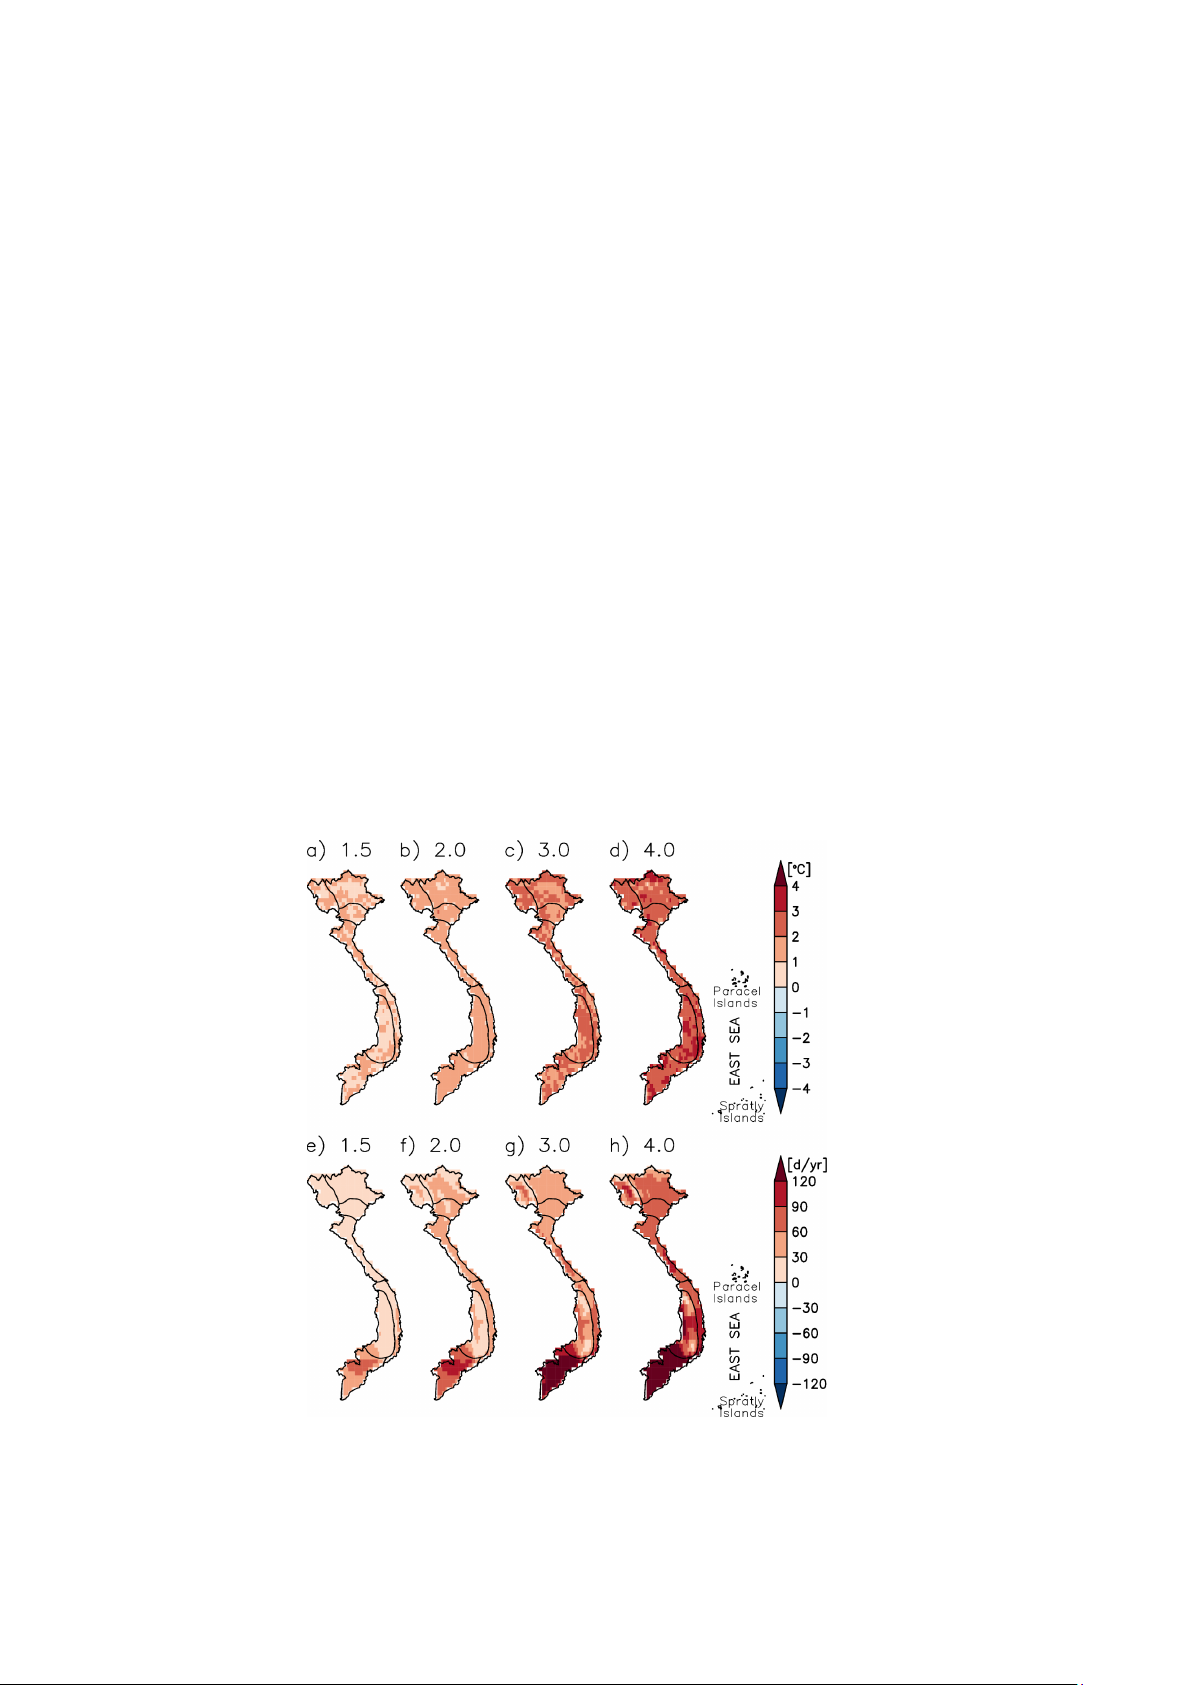
Figure 4 further il ustrates the projected increases in WBGTx characteristics at different GWLs
relative to the baseline. Overall, both WBGTx,x and Nx,3 increases across Vietnam with the
magnitude scaling linearly with GWL. The increases projected for GWLs 1.5°C and 2°C are
comparable to those projected for the mid-future under SSP2-4.5 and SSP5-8.5, respectively,
while the increases at GWLs 3°C and 4°C exceed those projected for the far future under the
same SSP scenarios. Specifically, WBGTx,x, increases by approximately 1oC, 1–2oC, slightly
above 2oC and nearly 3oC across Vietnam at the GWLs of 1.5°C, 2°C, 3°C and 4°C, respectively
(Figures 4(a)–(d)). For Nx,3, the projected increases at these GWLs are generally below 30, 60,
90, and 120 d/yr, respectively, over most sub-regions, except for R7 (Figures 4(e)–(h)). In R7,
Nx,3 increases by more than 60 and 90 d/yr at the GWLs of 1.5°C and 2°C, respectively, and
typically exceeds 120 d/yr at GWLs of 3°C and higher. 15
Figure 2. Climatological annual maximum WBGTx (WBGTx,x)
(a) Spatial distribution of climatological annual maximum WBGTx
(WBGTx,x) over Vietnam during the baseline period (1995–2014) and its
projected changes for the (b), (e), (h) near future (NF; 2021–2040); (c), (f),
(i) mid-future (MF; 2041–2060); and (d), (g), (j) far future (FF; 2081–2100)
under three Shared Socioeconomic Pathways (top) SSP1-2.6, (middle) SSP2-
4.5, and (bottom) SSP5-8.5. Only significant differences (p-value<0.05) are plotted.
Source: Authors’ own calculation. Original. 16
Figure 3. As in Figure 2 but for the annual number of days (Nx,3) when daily maximum
WBGT (WBGTx) exceeds the Level 3 threshold (>32°C)
Source: Authors’ own calculation. Original.
Similar patterns, but with even higher increases, are obtained for the annual maximum
WBGTm (WBGTm,x) under SSP5-8.5 (Figure S3). In the far future, projected increases in
WBGTm,x typically exceed 3oC and may approach 4oC across Vietnam, highlighting the
severe impacts of high-emission scenarios. Likewise, under SSP5-8.5, the annual number of
days (Nm,1) on which WBGTm exceeds the Level 1 (>29°C), which is almost zero in the current 17
climate, is projected to significantly increase in R2–R5 and R7 (Figure S4), exceeding 90 days
per year in some areas by the far future. Similar results are projected at different GWLs, with
increases scaling proportionally with GWL (Figure S5). Further, the increasing trends in
WBGTm,x and Nm,1 exhibit consistent patterns aligned with their projected increases (Figures
S6 and S7). Of particular concern are R3 (the Red River Delta) and R7 (the Mekong River Delta),
the two most densely populated subregions in Vietnam, encompassing Hanoi, the capital,
and Ho Chi Minh City, the largest city. In these areas, the urban heat island effect can further
intensify heat stress, while their economic importance and high concentration of outdoor
workers engaged in medium to heavy labor make them especially vulnerable. These
findings indicate a substantial risk of future heat stress in these subregions, emphasizing the
urgent need for effective mitigation and adaptation strategies. The fol owing subsections
wil further investigate the detailed projections of heat stress at the subregional scale of Vietnam.
Figure 4. The spatial distribution of differences in annual maximum WBGTx (WBGTx,x) between each
GWL — (a) 1.5°C, (b) 2°C, (c) 3°C and (d) 4°C — and the baseline period (1995–2014) over
Vietnam. (e), (f), (g), (h) are the same as (a), (b), (c), (d), respectively, but for the annual
number of days (Nx,3) when WBGTx exceeds the Level 3 threshold (>32oC)
Source: Authors’ own calculation. Original. 18
Tài liệu liên quan:
-

Ung dung game hoa trong cac chien dich MKT
18 9 -
Bao cao Chi so TMDT Viet Nam 2025
15 8 -
Thông tư quy định về việc phân quyền, phân cấp và phân định thẩm quyền quản lý nhà nước về giáo dục cho chính quyền địa phương
24 12 -
Nghị quyết về phát huy các giá trị di sản văn hóa gắn với phát triên du lịch bền vững tỉnh Khánh Hòa đến năm 2025, định hướng đến năm 2030
14 7 -
Quyết định phê duyệt Chiến lược phát triển du lịch Việt Nam đến năm 2030
13 7