Revision: Key Economic Insights and Analysis | Môn Kinh tế quốc tế - Đại học Ngoại Thương
Revision: Key Economic Insights and Analysis Môn Kinh tế quốc tế. Tài liệu được sưu tầm gồm 14 trang, giúp bạn ôn tập tốt hơn. Mời các bạn đón xem.
Môn: Kinh tế quốc tế 10 tài liệu
Trường: Trường Đại học Ngoại Thương 1.1 K tài liệu
Tác giả:


Preview text:
lOMoAR cPSD| 58562220 Revision ể ế ệ ể ề T/F, explain 1.
False. Non-tariff barriers (NTBs) are usually considered less transparent than tariffs because they
can take various forms like quotas, subsidies, and regulations, which are more difficult to quantify and
track compared to tariffs, which are direct taxes on imports. NTBs are often criticized for being less
predictable and more opaque in their application. 2.
False. All countries gain from trade. However, not everyone in each country gains. There are
always some gainers and losers in each country. Gainers tend to make the trade liberalization process to
go faster, while losers tend to slow it down. lOMoAR cPSD| 58562220
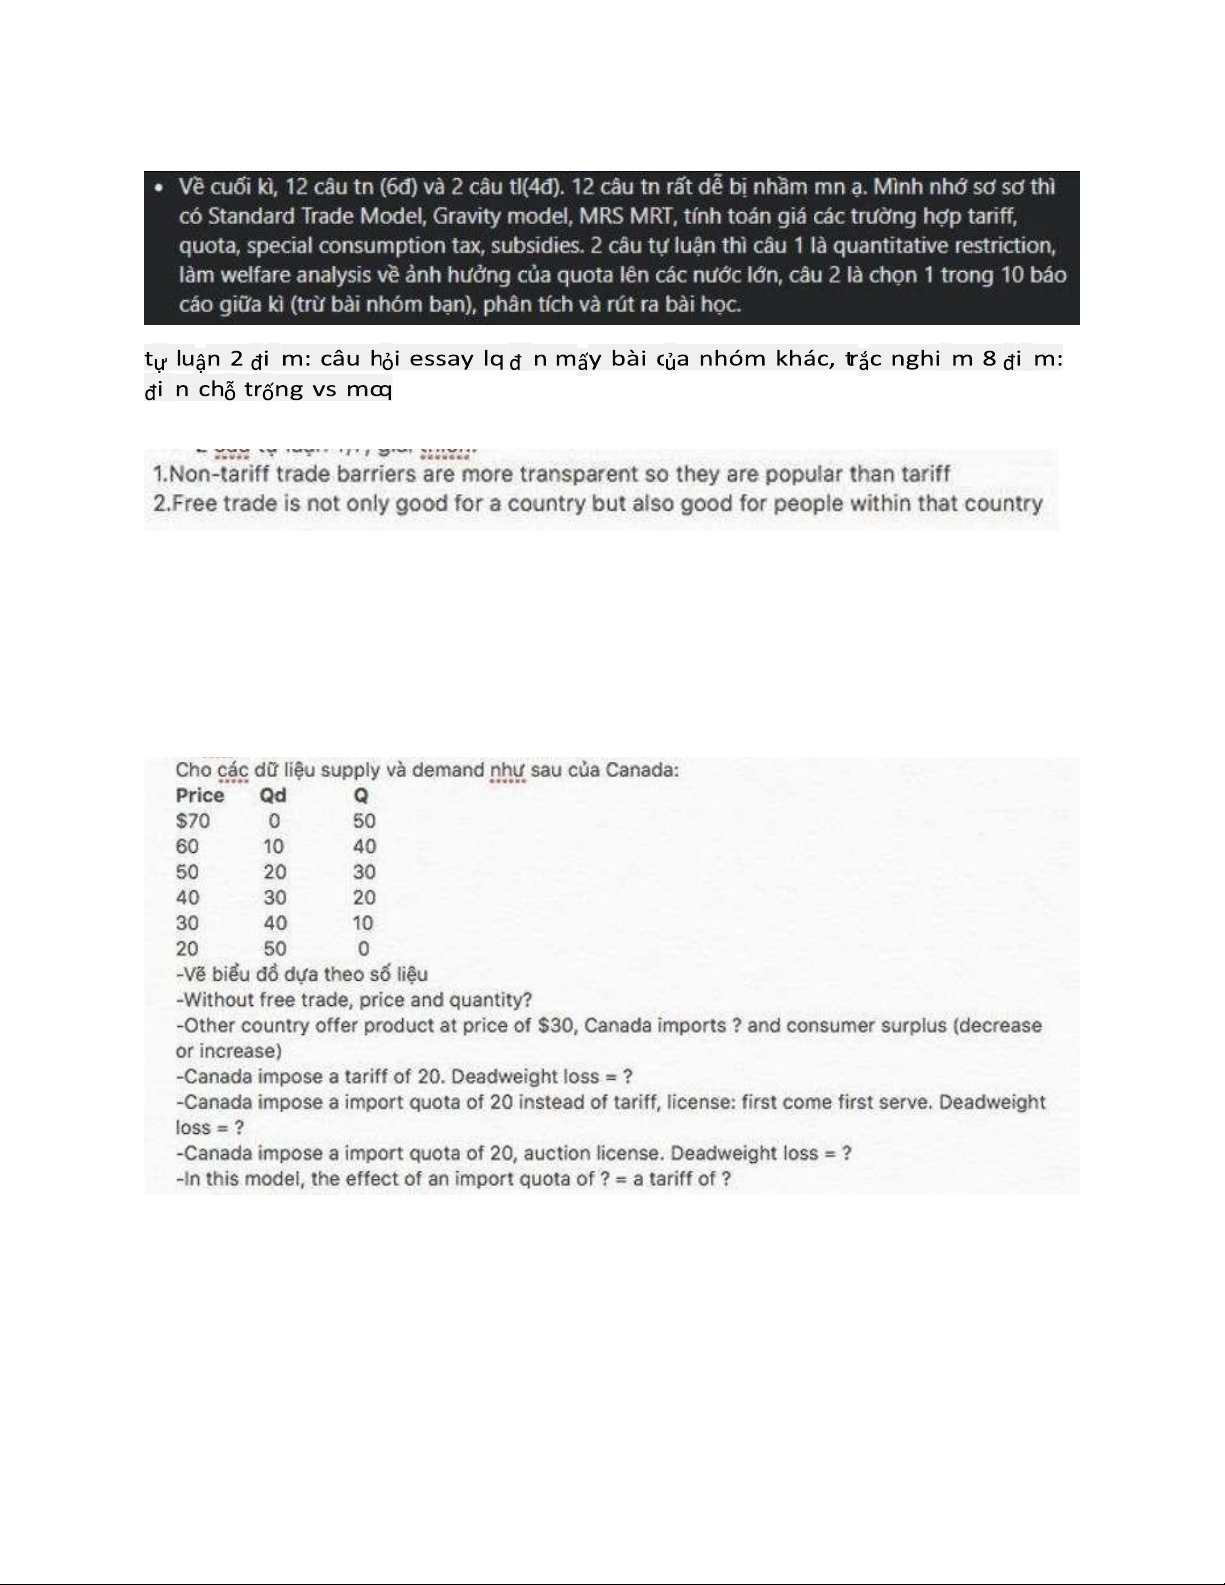
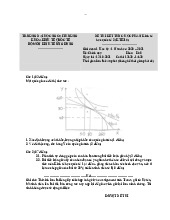
1. Without free trade: eqm at $45 and 25 units
2. Trade at P = $30 => Canada imports 40 – 10 = 30 units, CS increases
3. T = $20 => DWL = 0.5*(45-30)*(40-10) – 0.5*(50-45)*(30-20) = 200
4. Quota = 20 => PQ = 35 => DWL = 0.5*(20+30)*5 = 125
5. Quota = 20, auction license (GR = 20*5 = 100) => DWL = 0.5*5*5*2 = 25
6. In this model, an import quota of 20 is equivalent to a tariff of $5. Exercise: lOMoAR cPSD| 58562220 Answer:
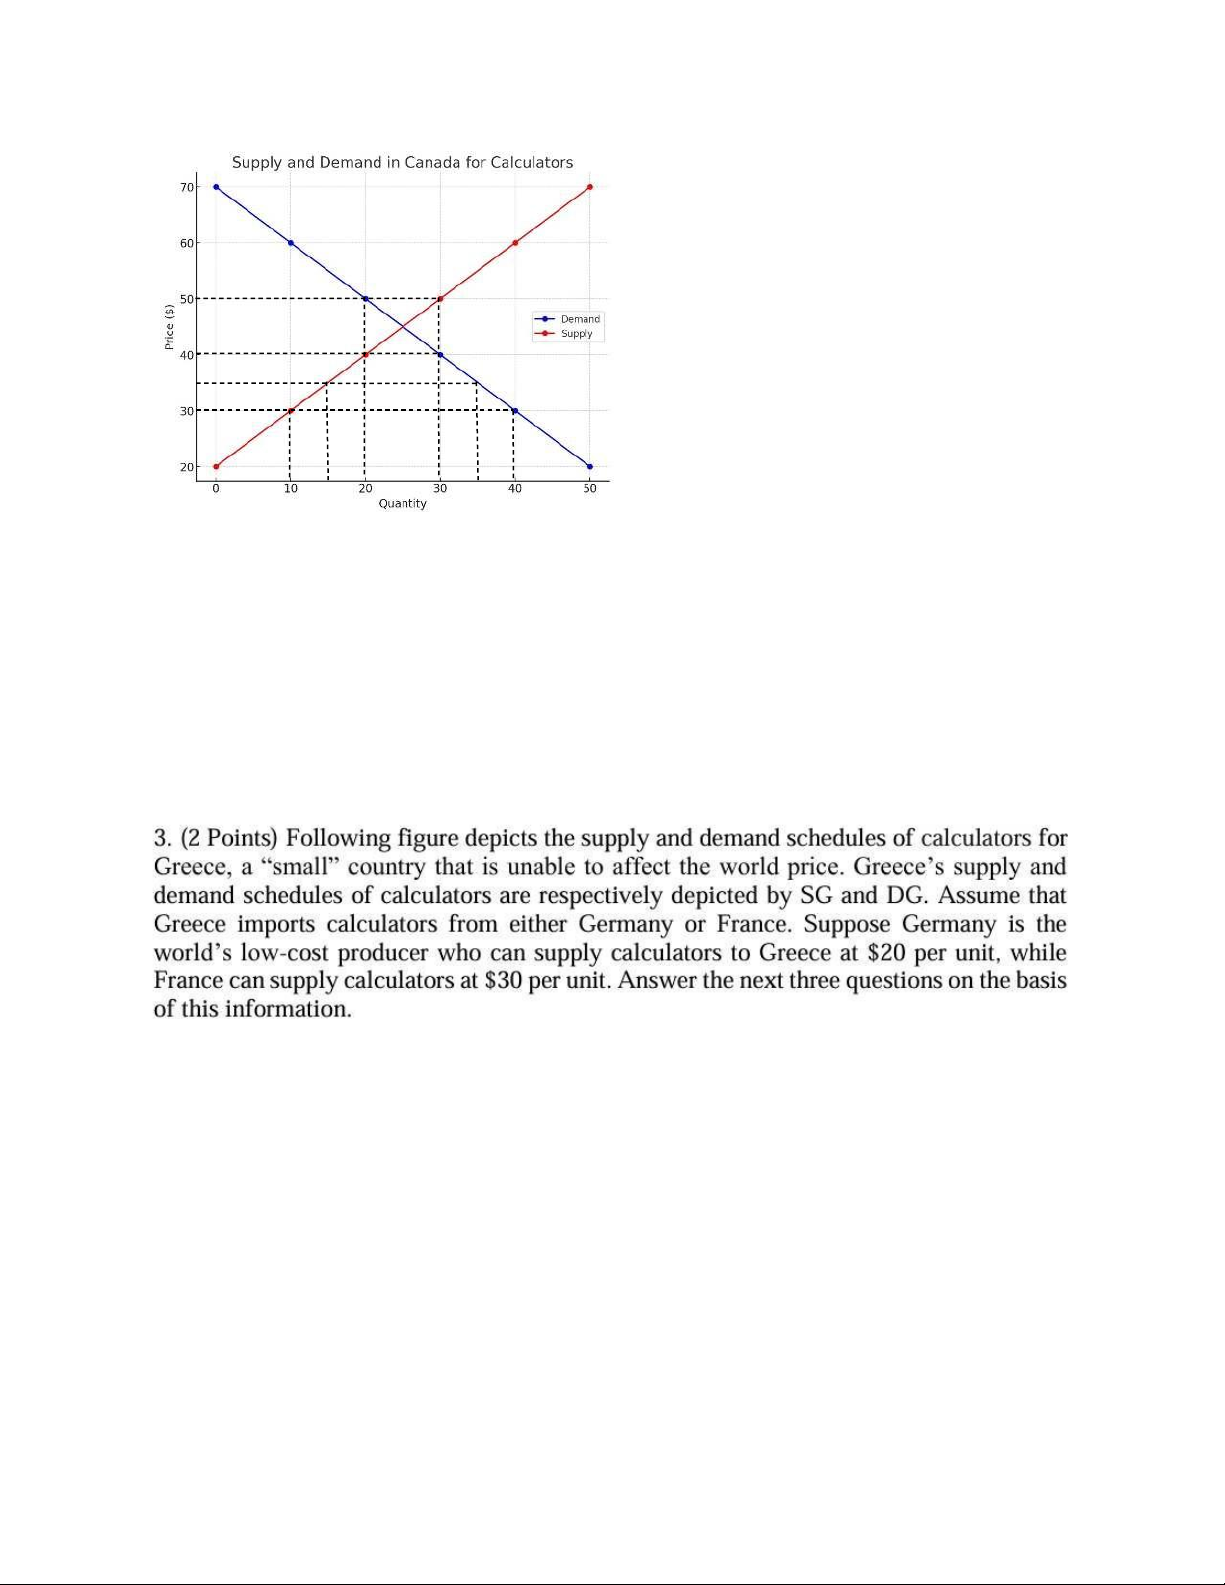
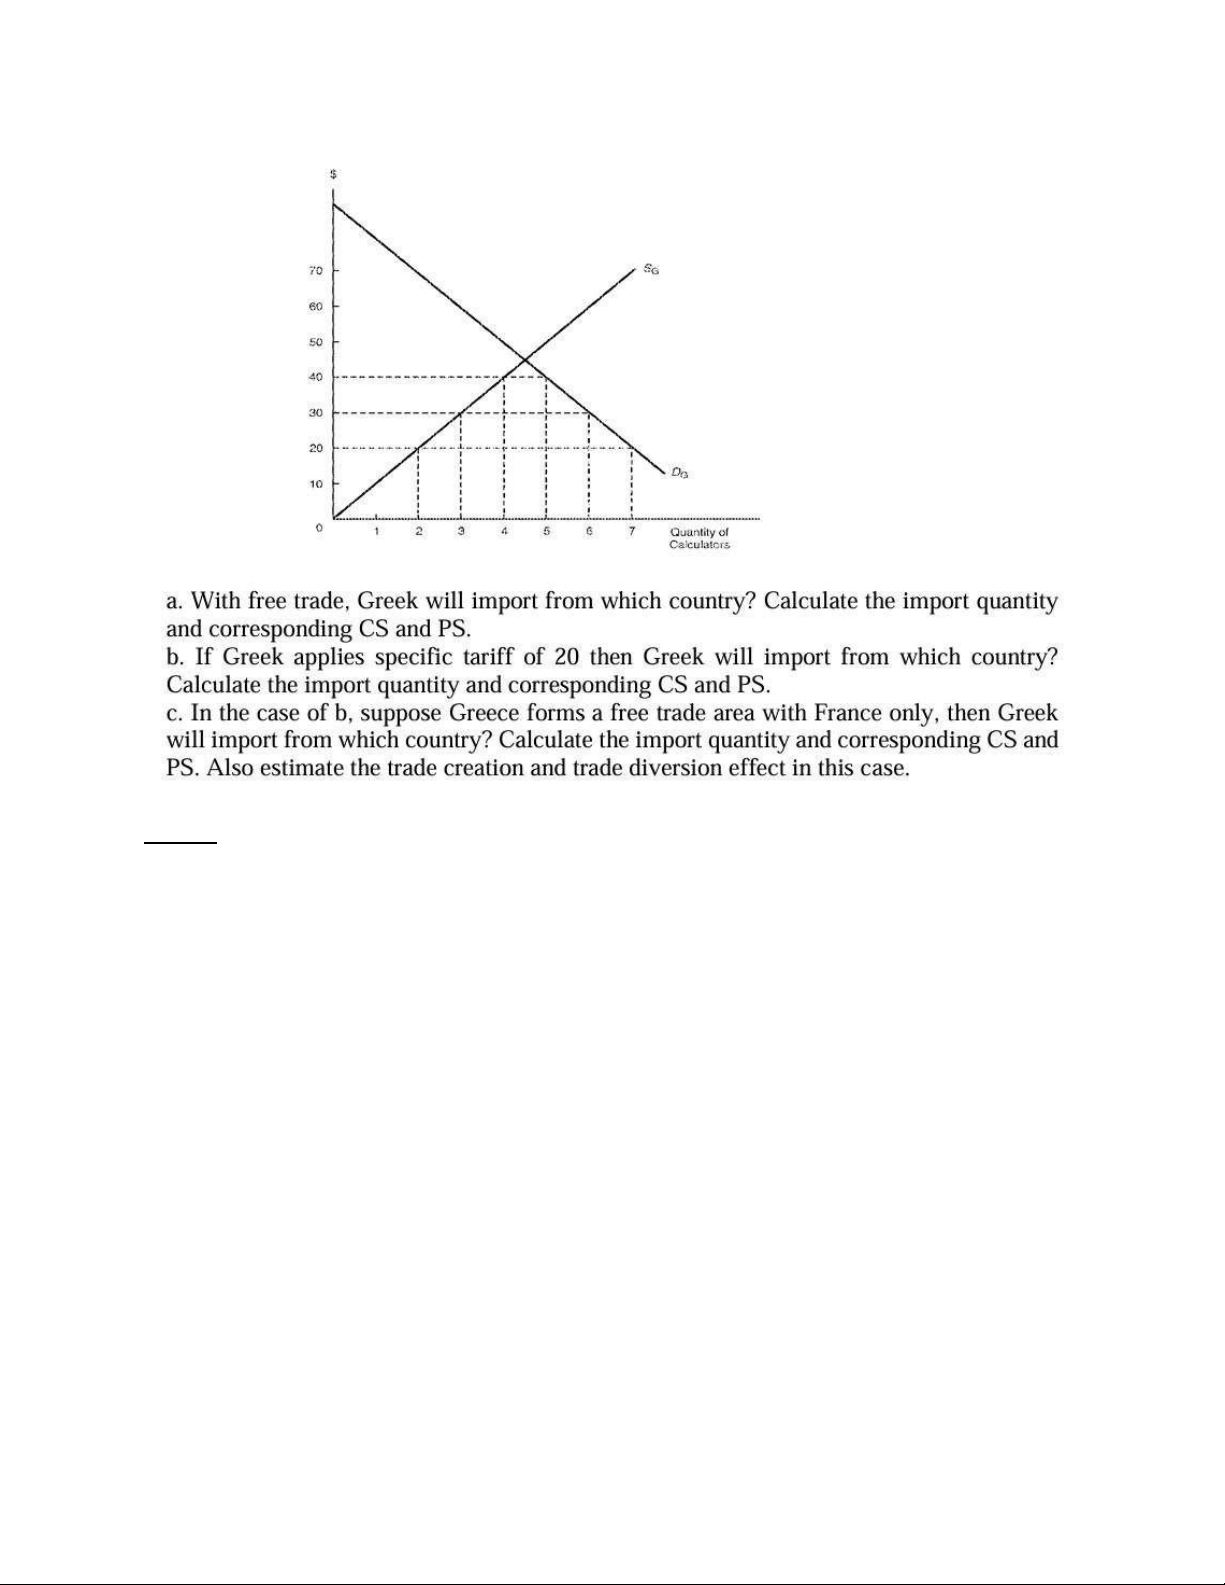
a) PF = 30 > FG = 20 => Greece would import from Germany Import = 7 – 2 = 5 CS = 0.5*(90-20)*7 = 245 PS = 0.5*20*2 = 20
b) T = 20 => Greece would still import from Germany PT = PW + T = 20 + 20 = 40 Import = 5 – 4 = 1 CS = 0.5*(90-40)*5 = 125 PS = 0.5*40*4 = 80
c) Greece would import from France because PF = 30 < PT = 40 Import = 6 – 3 = 3 CS = 0.5*(90-30)*6 = 180 PS = 0.5*30*3 = 45 lOMoAR cPSD| 58562220
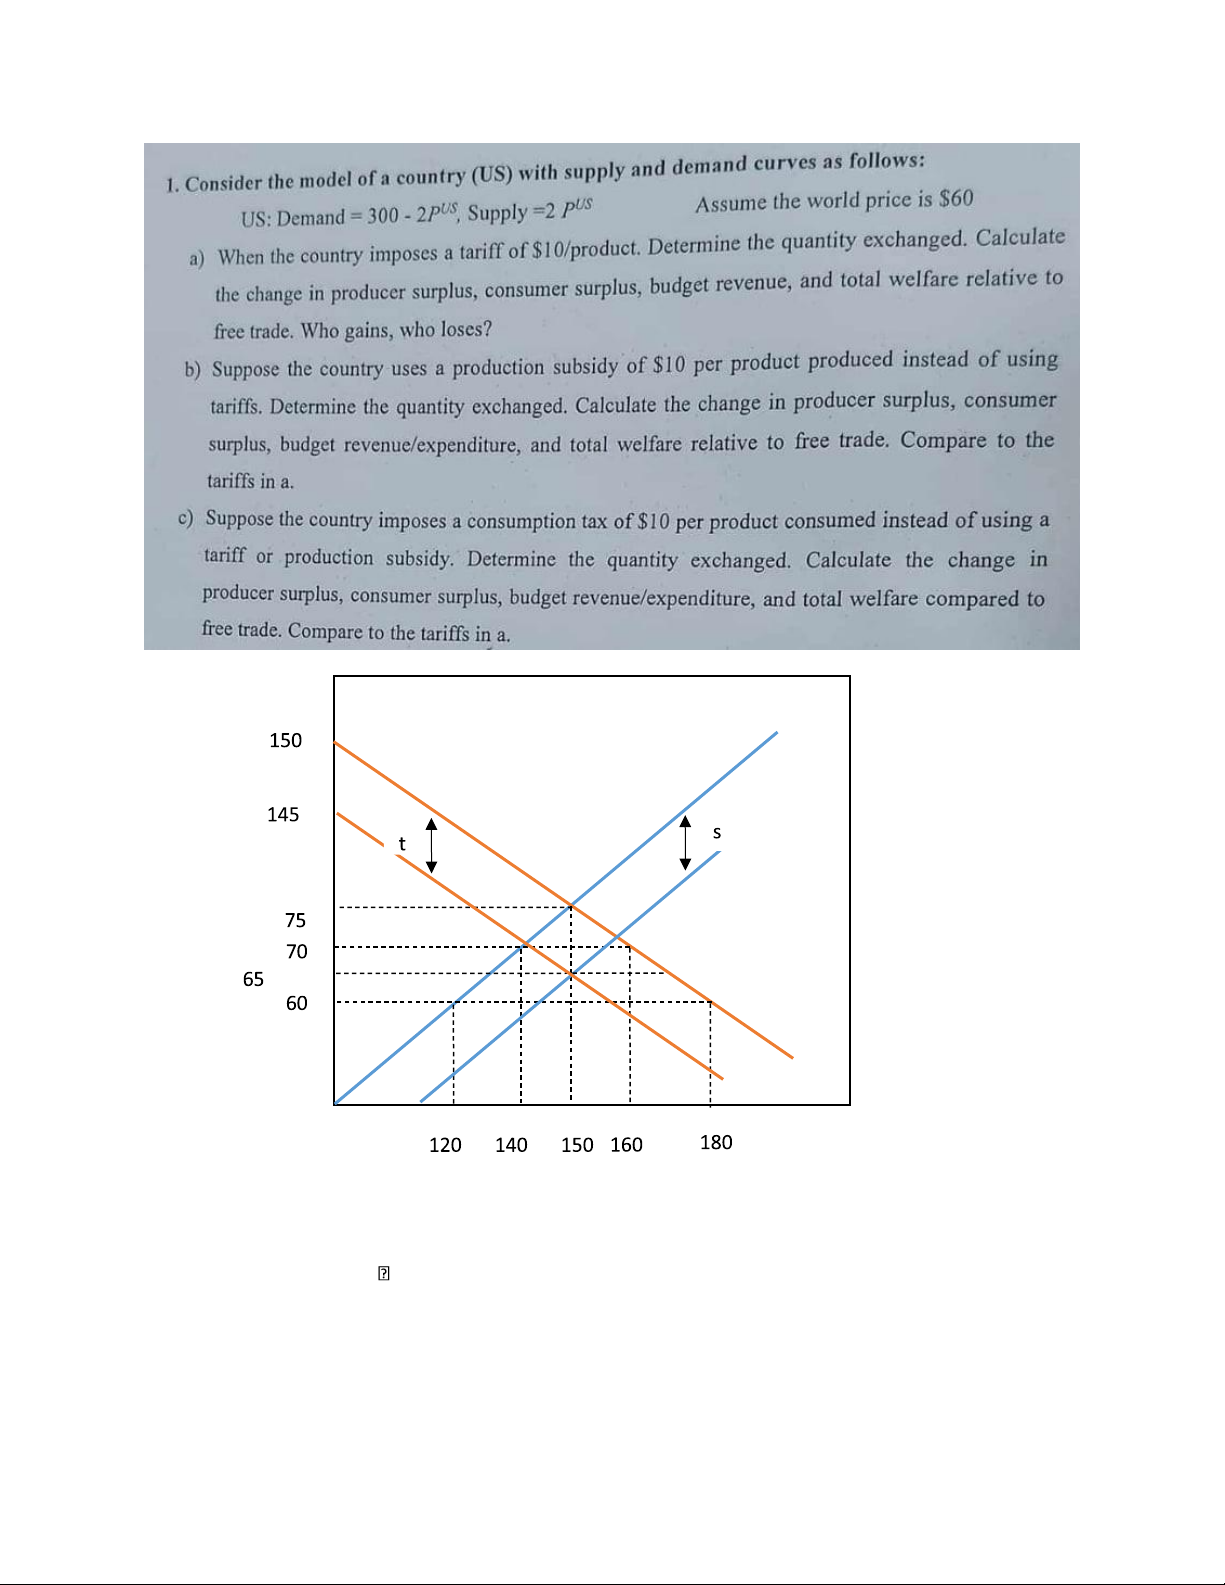
Autarky: 300 – 2PUS = 2PUS PUS = 75 ; QUS = 150 Free trade: PW = 60
a) T = 10 => PT = 60 + 10 = 70
Quantity imported = (300 – 2*70) – (2*70) = 20 lOMoAR cPSD| 58562220 Free trade (1) Tariff (2) Δ = (2) – (1) Gain/Loss US CS
0.5*90*180 = 8100 0.5*80*160 = 6400 -1700 Loss PS
0.5*60*120 = 3600 0.5*70*140 = 4900 1300 Gain GR 0 20*10 = 200 200 Gain TS 11700 11500 -200 Loss b) s = 10 Ps = 75 – 10 = 65
Quantity imported = (300 – 2*65) – (2*65+10) = 30 Tariff (1)
Production subsidy (2) Δ = (2) – (1) Gain/Loss US CS
0.5*80*160 = 6400 0.5*(150-65)*170 = 7225 825 Gain PS
0.5*70*140 = 4900 0.5*65*(150+10) = 5200 300 Gain GR 20*10 = 200 150*10 = 1500 1300 Gain TS 11500 13925 2425 Gain c) t = 10 Pt = 75 – 10 = 65
Quantity imported = (300 – 2*65-10) – (2*65) = 30 Tariff (1) Consumption tax (2) Δ = (2) – (1) Gain/Loss US CS
0.5*80*160 = 6400 0.5*(145-65)*150 = 6000 -400 Loss PS
0.5*70*140 = 4900 0.5*65*130 = 4225 -675 Loss GR 20*10 = 200 140*10 = 1400 1200 Gain TS 11500 11625 125 Gain Midterm topics: Non tariff barriers
THE IMPACT OF NON-TARIFF METHODS ON WOOD EXPORT OF RUSSIA IN 20002022
Summary of Non-Tariff Barriers (NTBs) from the Report:
This report examines the impact of non-tariff barriers (NTBs) on Russia's wood exports between
2000-2022. NTBs are trade restrictions that differ from tariffs, including sanitary and
phytosanitary measures (SPS), technical barriers to trade (TBT), and export quotas. These
measures have negatively affected Russia's wood export, especially with the increased use of
NTBs in importing countries like the EU, China, and Uzbekistan. The research utilizes the lOMoAR cPSD| 58562220
gravity model to estimate the effects of NTBs, noting that while GDP growth positively affects
trade, NTBs like SPS and TBT have negative impacts. Specifically, technical barriers and
sanitary measures increase compliance costs and reduce demand for Russian wood products.
This has contributed to a significant drop in exports, particularly to European markets after
sanctions related to Russia's actions in Ukraine. Lesson Learned:
1. Negative Economic Impact: NTBs such as SPS and TBT increase compliance costs for
exporters, leading to a decline in wood exports. Russia's trade with countries that impose
strict NTBs is negatively affected.
2. Importance of Policy Adaptation: Russian policymakers need to adapt by improving
domestic production standards and focusing on diversifying export markets to reduce
dependency on regions with stringent NTBs.
3. Necessity for Exporters to Adjust: Exporters should invest in compliance mechanisms
to meet the technical and sanitary requirements of importing countries. This includes
better monitoring of product standards and enhancing operational efficiency.
4. Potential for Market Adjustment: In the long term, the adaptation to NTBs can lead to
improved product quality and export performance if properly managed through
technological investments and better trade negotiations
Gravity model application
Analyzing the Factors affecting Textile and Garment Export of Vietnam: A Gravity Model Approach
The report analyzes the factors influencing Vietnam's textile and garment export using the
gravity model of international trade. This model, grounded in Newton's law of gravity, suggests
that trade between two countries is influenced by their economic size (GDP) and the distance
between them. Vietnam's export performance is examined across 13 major trading partners over
the 2012-2021 period, focusing on variables such as population, GDP, exchange rate, and strategic partnerships.
Key Findings from the Gravity Model Application:
1. Population of Importing Countries: A significant positive correlation was found
between the population of importing countries and Vietnam’s textile exports. An increase
in population size boosts demand for textiles.
2. GDP of Importing Countries: Higher GDP in importing countries positively influences
Vietnam’s exports. Larger, wealthier economies have greater demand for Vietnam’s textile and garment products.
3. Exchange Rate: The study revealed a significant negative impact of the exchange rate
on trade. When Vietnam's currency appreciates relative to its partners, its exports decrease. lOMoAR cPSD| 58562220
4. Vietnam’s Own Population and GDP: Surprisingly, the report found no significant
influence from Vietnam's own population and GDP on its textile and garment exports.
5. Strategic Partnerships: Although trade agreements and partnerships were expected to
boost exports, their impact was negative but statistically insignificant. This could be due
to the recent nature of these agreements or trade diversion effects. Lessons Learned: •
Focus on High Demand Markets: Vietnam should target countries with growing
populations and strong economies as they offer the best opportunities for export growth. •
Enhancing Product Quality: Since higher-income markets demand better-quality goods,
Vietnam should improve the quality of its textile and garment exports to remain competitive. •
Exchange Rate Management: The negative impact of exchange rate fluctuations
highlights the need for Vietnam to maintain stable currency policies to protect its export revenues. •
Diversification: The reliance on a few major markets is risky. Vietnam should explore
smaller markets and diversify its export destinations to reduce dependency and enhance trade resilience. •
Technological Innovation: To further capitalize on export potential, investment in
innovation and technology is essential for improving productivity and competitiveness.
These insights offer strategic directions for Vietnam’s textile industry, helping it navigate global trade dynamics effectively.
Optimal tariff The Interplay of Optimal Tariffs and Gasoline Taxes: Insights from Russia and OPEC
Key Findings in the Report
The report explores how optimal tariffs and gasoline taxes interact in oil-dependent economies,
focusing on Russia and OPEC members from 2000 to 2023. It found that optimal tariffs have a
significant negative effect on gasoline taxes, meaning that as tariffs are raised, gasoline taxes
tend to decrease. This relationship likely reflects a strategic response by policymakers to
maintain competitive pricing and balance between generating revenue and avoiding market
distortions. The report highlights several factors: •
Neighboring gasoline prices: These significantly impact domestic gasoline tax policies, with
countries lowering taxes to stay competitive. •
Public debt: Higher debt levels correlate with lower gasoline taxes, as governments may reduce
taxes to ease the burden on consumers. •
CO2 emissions: Despite growing emissions, the report found a reluctance to raise gasoline taxes,
suggesting that economic concerns often outweigh environmental considerations. lOMoAR cPSD| 58562220 Lessons Learned
1. Strategic Use of Tariffs: While optimal tariffs can boost revenue and improve a country's
terms of trade in the short term, the risks of retaliation and long-term economic
inefficiencies highlight the limitations of this strategy. Policymakers should weigh the
potential gains against the likelihood of retaliatory measures that could nullify benefits.
2. Balancing Economic and Environmental Goals: The interplay between gasoline taxes
and environmental policies shows that economic objectives often take precedence over
environmental concerns. Policymakers need to adopt more holistic approaches that
address both economic stability and sustainability goals, especially in oil-dependent economies.
3. Regional Price Sensitivity: The influence of neighboring countries' gasoline prices on
domestic tax policies underscores the importance of regional market dynamics.
Policymakers must consider cross-border price fluctuations when setting domestic tax
rates to avoid economic distortions and revenue losses.
4. Debt Management and Tax Policy: High public debt levels often lead to lower gasoline
taxes as governments seek to support economic growth. However, this approach could
limit long-term public investment, creating a cycle of fiscal strain. A balance between
debt management and sustainable tax policies is essential.
In conclusion, the report highlights the complex interdependence between optimal tariffs,
gasoline taxes, and broader economic policies. Policymakers in oil-exporting countries need to
consider both short-term economic gains and the potential long-term consequences of their fiscal strategies.
Conflicts related to Russia
Russia – Ukraine conflict and its impact on global oil market
Summary of Conflicts Related to Russia
The Russia-Ukraine conflict, which began in 2014 and escalated dramatically in February
2022, has had profound consequences for global markets, particularly the global oil market. As
one of the world’s largest oil producers, Russia's invasion of Ukraine and the subsequent
international sanctions have significantly disrupted oil flows and led to supply shortages. Key developments include:
1. Sanctions and Export Restrictions: Western nations, including the US and the EU,
imposed severe sanctions on Russia, banning Russian oil imports and excluding Russia
from international financial systems. This led to a sharp reduction in Russia’s ability to
export oil to its traditional markets, such as Europe, which had been heavily dependent on Russian crude.
2. Supply Chain Disruptions: The conflict disrupted critical energy infrastructure,
including refineries and pipelines like the Druzhba pipeline, which is crucial for lOMoAR cPSD| 58562220
transporting Russian oil to Europe. Ukraine, being a key transit country, was heavily
affected by these disruptions.
3. Oil Price Fluctuations: The conflict triggered extreme volatility in oil prices. Brent
crude peaked at $123 per barrel in March 2022, driven by supply shortages and market
uncertainty. Oil prices remained high throughout 2022 due to the ongoing conflict and
subsequent sanctions on Russian oil, affecting global markets and raising energy costs for
consumers and businesses worldwide.
4. Shifts in Global Trade: As a result of the sanctions, Russia sought to redirect its oil
exports to other markets, particularly in Asia. China and India became major importers
of discounted Russian oil, as Western markets cut their reliance on Russian energy. This
shift reshaped global oil trade patterns and increased Asia’s dependence on Russian crude.
5. Impact on Oil-Producing Nations: The conflict also led to production adjustments by
other oil producers like the US and OPEC+, which sought to stabilize prices amidst the
disruptions. However, OPEC+ adopted a conservative production increase strategy,
further contributing to the price volatility. Lessons Learned
1. Energy Security and Diversification: The conflict underscored the importance of
energy security and the need for countries to diversify their energy sources. Europe,
heavily reliant on Russian oil and gas, has accelerated its transition to alternative energy
sources, including renewable energy and LNG from the US. Diversification is crucial
for reducing vulnerability to geopolitical shocks.
2. Global Interconnectedness: The conflict highlighted the interconnectedness of global
energy markets. Disruptions in one region can quickly ripple across the globe, affecting
prices, supply chains, and economic stability. Countries need to build resilient energy
systems that can withstand such disruptions.
3. The Role of Sanctions: While sanctions can serve as powerful tools of economic
warfare, they also have global repercussions. The Russia-Ukraine conflict demonstrated
how sanctions on energy-producing nations can lead to supply shortages and price
increases, which hurt both the sanctioned country and the global economy.
4. Economic Resilience through Adaptation: Countries like China and India were able to
take advantage of discounted Russian oil, demonstrating that economic resilience often
involves adapting to new trade dynamics during conflicts. This highlights the need for
flexibility in trade and energy policies during times of crisis.
5. Accelerating Energy Transition: The conflict has also accelerated discussions around
the transition to clean energy. Nations, especially in Europe, are now more committed to
reducing their dependence on fossil fuels, viewing this as not only an environmental goal
but also a strategic necessity to ensure long-term energy independence.
In conclusion, the Russia-Ukraine conflict has had far-reaching impacts on global energy
markets, demonstrating the critical importance of diversified energy sources, resilient supply
chains, and the ability to quickly adapt to geopolitical disruptions. lOMoAR cPSD| 58562220
Semiconductor industry Vietnam opportunities and challenges in the global semiconductor industry
Semiconductor Industry Overview
The semiconductor industry is pivotal to technological advancements across various sectors,
including electronics, computing, AI, and IoT. It produces active components like integrated
circuits and transistors, which form the backbone of modern technology. Asia, led by countries
like Taiwan, South Korea, and China, dominates global semiconductor production.
Vietnam's Role in the Semiconductor Industry
Vietnam is emerging as a key player in the semiconductor industry, thanks to its growing
manufacturing capacity, attractive investment climate, and government support. Global giants
like Intel, Samsung, and Amkor Technology have set up operations in Vietnam, making
significant investments in the sector. Strengths
1. Government Support: Vietnam’s government is actively promoting semiconductor development
through policies that attract foreign investments and technology transfers.
2. Strategic Location: Vietnam’s geographic position offers easy access to global markets and
proximity to major semiconductor hubs in Asia.
3. Skilled Workforce: Vietnam is improving its talent pool, especially in STEM fields, with plans to
train 50,000 workers in the semiconductor industry by 2030.
4. Low Costs: Vietnam offers a favorable cost structure, with cheap labor and government
incentives like tax breaks and land use exemptions. Weaknesses
1. Limited Domestic Manufacturing: Vietnam still relies on foreign investments for high-end
semiconductor production, lacking indigenous capabilities.
2. Workforce Skill Gap: Although the workforce is growing, there’s a shortage of highly skilled
engineers, which could limit Vietnam’s ability to move up the value chain.
3. Infrastructure Challenges: Vietnam needs to improve its infrastructure, especially power supply
and logistics, to support large-scale semiconductor manufacturing. Opportunities
1. Rising Global Demand: The global semiconductor market, driven by the growth of AI, IoT, and
5G, offers Vietnam immense opportunities to tap into increasing demand.
2. Foreign Investment: Vietnam continues to attract substantial foreign direct investments (FDIs),
especially from countries like South Korea and the U.S., enhancing its semiconductor manufacturing capabilities. lOMoAR cPSD| 58562220
3. Strategic Trade Agreements: Vietnam’s participation in trade pacts like the CPTPP and RCEP
opens up new markets and encourages technology transfers from leading semiconductor nations. Threats
1. Fierce Competition: Vietnam faces intense competition from established semiconductor giants
like Taiwan, South Korea, and China, who dominate global production and have advanced R&D capabilities.
2. Dependence on Foreign Technology: Vietnam’s reliance on foreign firms for technology and
expertise limits its ability to innovate independently.
3. Geopolitical Risks: Ongoing trade tensions, particularly between the U.S. and China, could
disrupt supply chains and impact Vietnam’s semiconductor growth. Lessons Learned
1. Government Investment is Crucial: Vietnam can learn from Taiwan’s success in the
semiconductor industry, which was largely due to government-driven R&D investments, talent
development, and strategic policies. Vietnam should increase its domestic R&D funding and
continue nurturing its talent pool.
2. Need for Local Expertise: Vietnam’s dependence on foreign firms highlights the need to develop
local capabilities in advanced chip design and manufacturing. Taiwan’s rise as a semiconductor
powerhouse illustrates the importance of fostering strong domestic players.
3. Strategic Partnerships and Trade Agreements: Vietnam’s integration into global supply chains
through trade agreements and strategic partnerships will be key to its semiconductor industry’s
growth. Expanding collaboration with foreign firms can help Vietnam reduce its reliance on
imports for critical components.
4. Infrastructure Development: Vietnam must address its infrastructure bottlenecks, particularly in
energy supply and transportation, to support the semiconductor industry’s expansion.
In conclusion, Vietnam holds considerable potential to become a prominent player in the global
semiconductor market but must address internal challenges by fostering local innovation,
improving infrastructure, and enhancing the skills of its workforce. Lessons from successful
countries like Taiwan can guide its journey towards becoming a key player in the industry. Trade war US - China
Analyzing Vietnam’s trade activities with United States and China: Evidence under US - China trade war
Summary of the US-China Trade War
The US-China trade war began in 2018 as a response to concerns over the US trade deficit with
China, perceived unfair trade practices, and the growing influence of China's economy. The
conflict arose primarily due to three factors: lOMoAR cPSD| 58562220
1. Trade Imbalance: The US had a significant trade deficit with China, importing far more than it exported.
2. Technology Theft: The US accused China of unfairly acquiring US technology, impacting its competitive edge.
3. Security Concerns: The US viewed China's growing technological capabilities, especially in
sectors like 5G and AI, as a threat to national security.
The trade war led to the US imposing tariffs on various Chinese products, starting with solar
panels and washing machines, and escalating to consumer goods, steel, and aluminum. In
retaliation, China imposed tariffs on US goods. The war disrupted global supply chains,
increased economic uncertainty, and resulted in higher costs for businesses and consumers in
both countries. Although a Phase One Agreement was signed in 2020, addressing some trade
issues, many concerns remained unresolved.
Effects of the Trade War on Other Countries
While the US and China were directly impacted, the trade war also had significant implications for other nations: •
Emerging Economies: Countries like Vietnam, India, and Indonesia benefited from the trade
diversion as businesses sought to relocate manufacturing from China to avoid tariffs. Vietnam, in
particular, capitalized on the shift, increasing exports to the US and attracting new investments. •
Global Supply Chains: The war led to restructuring of global supply chains, with companies
adopting a "China Plus One" strategy to mitigate risks, which saw increased trade and investment in other Asian nations. •
European Union: While not significantly impacted in industries like real estate or tourism,
European businesses anticipated more opportunities once the trade war subsided. Lessons Learned
1. Global Interdependence: The trade war highlighted how deeply interconnected global
economies are. Tariffs and trade restrictions in one country can have ripple effects across
multiple industries and nations, leading to supply chain disruptions and economic instability.
2. Diversification is Key: The trade war emphasized the importance of diversifying supply
chains and export markets. Countries like Vietnam successfully capitalized on trade
diversion by positioning themselves as alternative suppliers, demonstrating the value of
flexibility and agility in global trade.
3. Technology and National Security: The conflict underscored the growing importance of
technology in trade disputes. The focus on technological dominance (such as 5G and AI)
revealed that future trade conflicts may increasingly center on strategic industries rather
than just traditional goods and services.
4. Unpredictability of Trade Wars: The uncertainty caused by trade wars can lead to
hesitancy among investors, and economic policies must be designed with flexibility to
adapt to sudden shifts in international relations and trade policies. lOMoAR cPSD| 58562220
5. Reshaping of Global Trade Patterns: Countries affected by the trade war can benefit by
strategically positioning themselves to fill the gaps left by major players. Nations with
competitive advantages in manufacturing and lower labor costs, like Vietnam, are
wellplaced to gain from such shifts in trade relations.
Trade and EnvironmentEconomic Opportunities and Environmental Costs: Analyzing the Funan Techo
Canal’s Role in Regional Trade Growth
Open and Closed economy
How EU's sanctions affect Russian oil export
Trade war US - Japan Trade War US - Japan: Impacts of US’s Automobile’s Import Quota on Japan’s Trade Balance
Competition Electric vehicle market
Electric Vehicle Dynamics: A Comparative Analysis of Market
Strategies in the U.S. and China
Gravity Model Application
Trade Potential of Vietnam: A Socio-cultural Gravity Model Analysis
Xuất khẩu vũ khí in the gravity model framework
Economics, National Defense, and Politics:
Understanding U.S. Arms Exports from 2007 to 2023 via the Gravity Model Oil market
CRUDE OIL EXPORTATION FORECAST: A STRATEGIC ANALYSIS IN VIETNAM
Gravity Model Application
THE ROLE OF LOGISTICS PERFORMANCE IN ENHANCING
VIETNAM’S EXPORT VALUE: AN ANALYSIS FROM 2007 – 2023
Strategic trade policy (Boeing và Airbus)
CASE STUDY OF BOEING AND AIRBUS
The strategic trade policy between Boeing and Airbus has revolved around government subsidies
and support, leading to intense rivalry in the global aerospace industry. Both companies received
significant government backing, which shaped their market dominance. Boeing, being an early
mover, leveraged U.S. government support in the form of defense contracts, R&D, and
technology transfers, allowing it to maintain a strong position in the market. Airbus, established
later as a European collaboration, received substantial financial aid from European governments,
enabling it to compete with Boeing and gain significant market share over time. Lessons learned:
1. Government Subsidies Matter: Strategic government intervention through subsidies has
been crucial in determining market competitiveness. Both Boeing and Airbus relied
heavily on government support to reduce production costs and enhance their R&D capabilities.
2. Game Theory in Action: The competition between Boeing and Airbus can be analyzed
using game theory, particularly the prisoner’s dilemma and Nash equilibrium. Both
companies were incentivized to continue receiving subsidies, fearing loss of market share
if they ceased while the other continued. lOMoAR cPSD| 58562220
3. Subsidy Races Lead to Trade Disputes: The ongoing disputes, often brought before the
WTO, highlight the dangers of subsidy races. They lead to retaliatory measures, such as
tariffs, and prolonged tensions between the U.S. and the EU.
4. Market Innovation is Key: Beyond government support, both companies had to
continuously innovate to maintain competitiveness, especially in the context of changing
market dynamics like the need for fuel-efficient aircraft.
5. Global Collaboration and Fair Competition: There is a growing need for transparency
and adherence to international trade norms to avoid unfair advantages and ensure longterm industry stability. Second best theory
RENEWABLE ENERGY SUBSIDIES TO REDUCE CARBON EMISSION AS THE
SECOND-BEST POLICY FOR CARBON PRICING: A CASE STUDY OF THE 24 TOP EMITTING COUNTRIES
The Second Best Theory, outlined in the report, addresses situations where achieving all optimal
economic conditions is not feasible. In such cases, it suggests that adjusting other variables away
from their ideal states might improve overall efficiency. The theory emphasizes that when market
distortions occur (e.g., monopolies, externalities), simply aiming for a single best outcome might
not be effective. Instead, introducing additional distortions could lead to a more favorable result.
In the context of carbon emissions, the report explains that renewable energy subsidies serve as a
second-best solution when direct carbon pricing (the first-best option) is politically or practically
unfeasible. Subsidies help reduce carbon emissions by promoting the use of cleaner energy, even
though they might not eliminate the distortion caused by fossil fuel reliance. However, the report
highlights the risk of the "Green Paradox," where subsidies may initially encourage higher fossil
fuel consumption before full transition to renewables occurs. Lessons learned:
1. Pragmatic Policy Design: In real-world scenarios, achieving the ideal policy is often not
possible due to political or economic constraints. Second-best policies, like renewable
energy subsidies, provide a practical alternative.
2. Importance of Adjusting Other Variables: When the ideal condition (e.g., perfect
carbon pricing) cannot be achieved, adjusting other areas, like offering subsidies, can mitigate negative outcomes.
3. Careful Planning is Essential: The potential for unintended effects, such as the Green
Paradox, requires careful design of environmental policies to avoid counterproductive outcomes.
4. Global Cooperation: Successful climate policy often depends on international
coordination, especially to avoid issues like premature fossil fuel extraction.
Tài liệu liên quan:
-
Chính sách thương mại quốc tế của Nhật Bản và gợi ý đối với Việt Nam | Môn Kinh tế quốc tế - Đại học Ngoại Thương
172 86 -
Tác động của xuất khẩu đến tăng trưởng kinh tế ở các nước đang phát triển ở Đông Nam Á trong giai đoạn 2004-2022 | Môn Kinh tế quốc tế - Đại học Ngoại Thương
111 56 -
Đề thi Học kỳ 1 Năm học 2020-2021 | Môn Kinh tế quốc tế - Đại học Ngoại Thương
117 59 -

Chapter 1: Introduction to International Economics Note | Môn Kinh tế quốc tế - Đại học Ngoại Thương
121 61