Smart Spreading Factor Assignment Strategies for LoRaWANs | Iot và ứng dụng | Học viện Công nghệ Bưu chính Viễn thông
LoRa is a proprietary physical layer radio/chipset technol- ogy that provides wireless link solution for low power wide area networks. It uses proprietary spread spectrum modulation technique that is the derivative of Chirp Spread Spectrum (CSS). A chirp is a sinusoidal signal of which frequency increases over time. Chirp frequency increases linearly and sweeps the entire bandwidth [4]. Tài liệu được sưu tầm và soạn thảo dưới dạng file PDF để gửi tới các bạn cùng tham khảo, ôn tập đầy đủ kiến thức, chuẩn bị cho các buổi học thật tốt. Mời bạn đọc đón xem!
Môn: IoT và ứng dụng 143 tài liệu
Trường: Học viện Công Nghệ Bưu Chính Viễn Thông 1.8 K tài liệu
Tác giả:
Preview text:
2019 IEEE Symposium on Computers and Communications (ISCC)
Smart Spreading Factor Assignment for LoRaWANs Tugrul Yatagan and Sema Oktug
Department of Computer Engineering, Istanbul Technical University Istanbul, Turkey
Email: {yatagan, oktug}@itu.edu.tr
Abstract—Low power wide area network (LPWAN) technolo-
protocol called LoRaWAN. LoRaWAN and Sigfox MAC pro-
gies offer affordable connectivity to massive number of low-power
tocols are based on pure ALOHA medium access. LoRaWAN
devices distributed over large geographical areas. Focus of this
networks can be deployed as a private network like WiFi.
work is one of the most promising LPWAN technologies: LoRa.
LoRa offers long range communication and strong resilience to
However, Sigfox and NB-IoT are only available with operator
interference by proprietary modulation technique based on Chirp contract [2].
Spread Spectrum (CSS). LoRa modulation trades data rate for
LoRa can adjust data rate by spreading symbols within
sensitivity and communication range by spreading symbols within
a fixed channel bandwidth. This enables tradeoff between
a fixed channel bandwidth. Collisions in LoRaWAN networks
receive sensitivity and air time of transmission [3]. Simulta-
are strongly related with spreading factor (SF) assignment of
nodes which indeed effects network performance. In this work,
neous same SF transmissions are prone to collision, however,
a simulation environment to evaluate the performance of SF
different SF transmissions in the same channel are orthogonal
assignment schemes is implemented. Furthermore, a novel smart
to each other. Thus, SF assignment is crucial for overall
SF assignment strategy which utilizes Support Vector Machine
network performance. In this work, a LoRa discrete event
(SVM) and Decision Tree Classifier (DTC) machine learning
simulator is developed to study the performance of LoRa
techniques for optimization of SF assignment is proposed. It is
observed and presented that the proposed smart SF assignment
SF assignment strategies. Also, a machine learning based SF
techniques give promising simulation results in terms of packet
assignment approach is proposed. Support Vector Machine delivery ratio (PDR).
(SVM) and Decision Tree Classifier (DTC) techniques are
Index Terms—LoRa, LoRaWAN, Spreading Factor, LPWAN,
employed and the introduced schemes are called as smart SF Machine Learning
schemes. The performance of the smart schemes are compared
with the performance of the lowest SF assignment scheme. It I. INTRODUCTION
is shown that the proposed smart SF assignment schemes give
NUMBER of Internet of Things (IoT) applications in- promising results.
creased exponentially in last few years [1]. Recent devel-
This paper is organized as follows: Section II and Section
opments on LPWAN technologies has great impact on growth
III provides some background information about LoRa and
of number of IoT applications. LPWAN technologies address
LoRaWAN. Section IV summarize the other related works.
some of the well-known wireless communication challenges.
Section V describes the smart SF assignment technique pro-
Traditional wireless communication methods such as cellular
posed. Simulation environments and results are shown in
networks (e.g., 2G, 3G, LTE) and short-range communication
Section VI and VII. Finally, Section VIII concludes the paper
technologies (e.g., Bluetooth, WiFi, Zigbee) cannot provide by giving future directions.
low power and long range at the same time. Cellular networks
can provide long range and high data rate, but they are
complex and consume too much power. Besides, most of the II. LORA
IoT applications do not require high data rate. Short-range
communication methods can provide relatively low power
LoRa is a proprietary physical layer radio/chipset technol-
consumption, but their range is limited to a few hundred meters
ogy that provides wireless link solution for low power wide
at best [2]. LPWAN technologies fill the technology gap be-
area networks. It uses proprietary spread spectrum modulation
tween short range and cellular technologies by providing low
technique that is the derivative of Chirp Spread Spectrum
power and long-range communication. LPWAN technologies
(CSS). A chirp is a sinusoidal signal of which frequency
basically sacrifice data rate to provide low power consumption.
increases over time. Chirp frequency increases linearly and
There are several emerging LPWAN technologies. LoRa,
sweeps the entire bandwidth [4].
Sigfox, NB-IoT and LTE-M are commonly used, well-known
LPWAN technologies [2]. LoRa and Sigfox use license free A. Spreading Factor
ISM frequency bands while NB-IoT and LTE-M use licensed
frequency bands which brings extra cost [2]. Both LoRa
The ratio between symbol and chirp rate is equal to 2SF. SF
and Sigfox are known for ultra-low power consumption and
can take values between 7 to 12. SF also determines data rate
resilience to interference. While NB-IoT and LTE-M are
of a LoRa transmission [4]. Data rate of a LoRa transmission
promoted for higher data rate. LoRa has open standard MAC can be calculated as:
978-1-7281-2999-0/19/$31.00 ©2019 IEEE
2019 IEEE Symposium on Computers and Communications (ISCC) 4 4 + CR Rb = SF ∗ bps (1) 2SF BW |Hz
Where, Rb is data rate in bps, SF is spreading factor SF ∈
{7, .., 12}, CR is error correction code rate CR ∈ {1, .., 4}
and BW is bandwidth in Hertz [4].
When BW and CR are constant, as the SF increases, the
data rate decreases. Increasing the SF makes the signal more
resilient to noise thus increases the transmission range. In-
creasing the SF also increases the transmission duration which
increases the power consumption. Therefore, it is possible to
trade between range and power consumption by changing SF.
B. Spreading Factor Assignment Issue
Simultaneous different SF transmissions are orthogonal to
each other up to some extent. Which means that, a LoRa
gateway can simultaneously receive multiple transmissions
with different SFs. However, simultaneous transmissions with
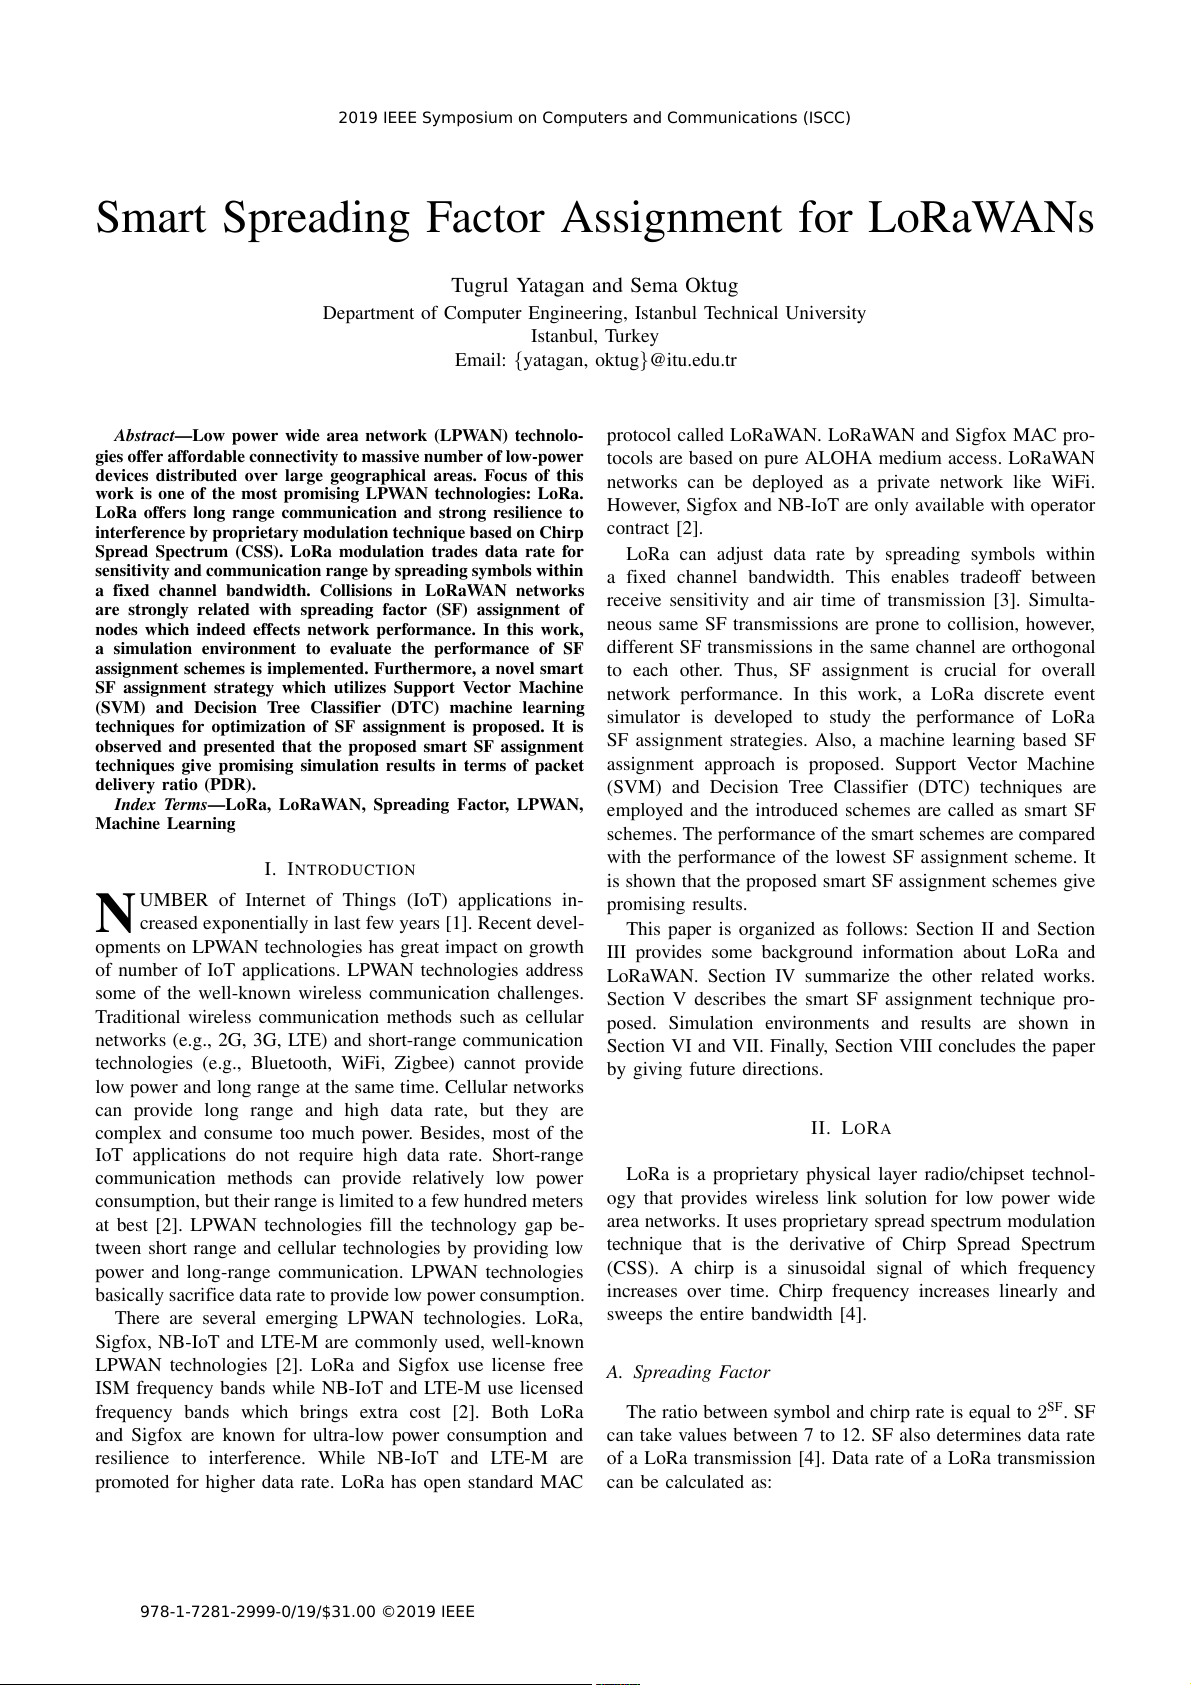
Fig. 1. Collision between nodes close to the gateway.
the same SF may not be received by the gateway due to
collision. For this reason, SF assignment of nodes is crucial
would break inter-operability between different LoRa net- for network performance.
works. LoRaWAN is based on pure ALOHA medium access
In a LoRaWAN network, initially, a node is not aware of
which means that end nodes do not check whether the channel
how far away it is from a gateway. However, a node can
is free or not before transmission, accepting the possibility of a
guess the distance from a gateway by observing received
collision. A typical LoRaWAN network consists of following
signal power of a downlink transmission. If received signal three network entities.
power of a downlink transmission is too high, then node A. End node
can decrease its next transmission SF to decrease power
consumption. This SF assignment method is called lowest
LoRaWAN end node (EN) is a low power embedded device
possible SF assignment scheme for the rest of the paper.
that only communicates to gateways. LoRaWAN standard
Lowest possible SF assignment scheme is commonly used in
defines three classes for end devices which are Class A, Class
LoRaWAN deployments. Also, a gateway can request from a
B, and Class C. Different classes provide LPWAN solutions
node to decrease its SF or transmit power.
to different applications and deployments. Class A end nodes
In Figure 1, a LoRaWAN network deployed with a single
generate uplink transmission at any time and only receive a
gateway is illustrated. Different color rings represent achiev-
period of time after uplink transmission. Class B end nodes
able range of different SFs from the gateway and different
extend Class A behavior by adding scheduled receive windows
color circles represent selected SF of the nodes. The end
for downlink transmission. Receive window is synchronized
devices close to the gateway will fall into the lowest SF
using a beacon packet transmitted by gateways. Class C end
(SF7) area section. The end devices close to the gateway will
nodes extend Class A behavior by keeping receive window
probably select the lowest SF most of the time. This causes
open all the time except uplink transmission. This provides
a lot of collisions between same SF transmissions. Hence
Class C end nodes with low latency downlink communication,
the number of collisions will increase as the number of end
which requires more power consumption. In this paper, only
devices close to the gateway increases.
Class A end devices are considered since Class A behavior
leads to the lowest power consumption. III. LORAWAN B. Gateway
LoRa has an open standard medium access control (MAC)
LoRaWAN gateway (GW) is a device that receive/transmit
layer protocol called LoRaWAN which is designed for large
packets coming from/to end nodes. A typical gateway can
scale LoRa networks considering well known LPWAN chal-
receive from multiple channels at the same time. Gateways
lenges and their best practice solutions. LoRaWAN is devel-
are usually connected to power grid, so power consumption
oped and maintained by LoRa Alliance. LoRa Alliance is
of a gateway is insignificant in most of the deployments.
an open, non-profit organization dedicated to standardization
of LoRaWAN. LoRaWAN provides inter-operability between C. Network server
different LoRa networks. LoRa can be used as a wireless
LoRaWAN network server (NS) is a server that provides
link technology without complying LoRaWAN, however this
MAC layer processing. Network server routes messages from
2019 IEEE Symposium on Computers and Communications (ISCC)
application to end nodes and vice versa. Network server can be
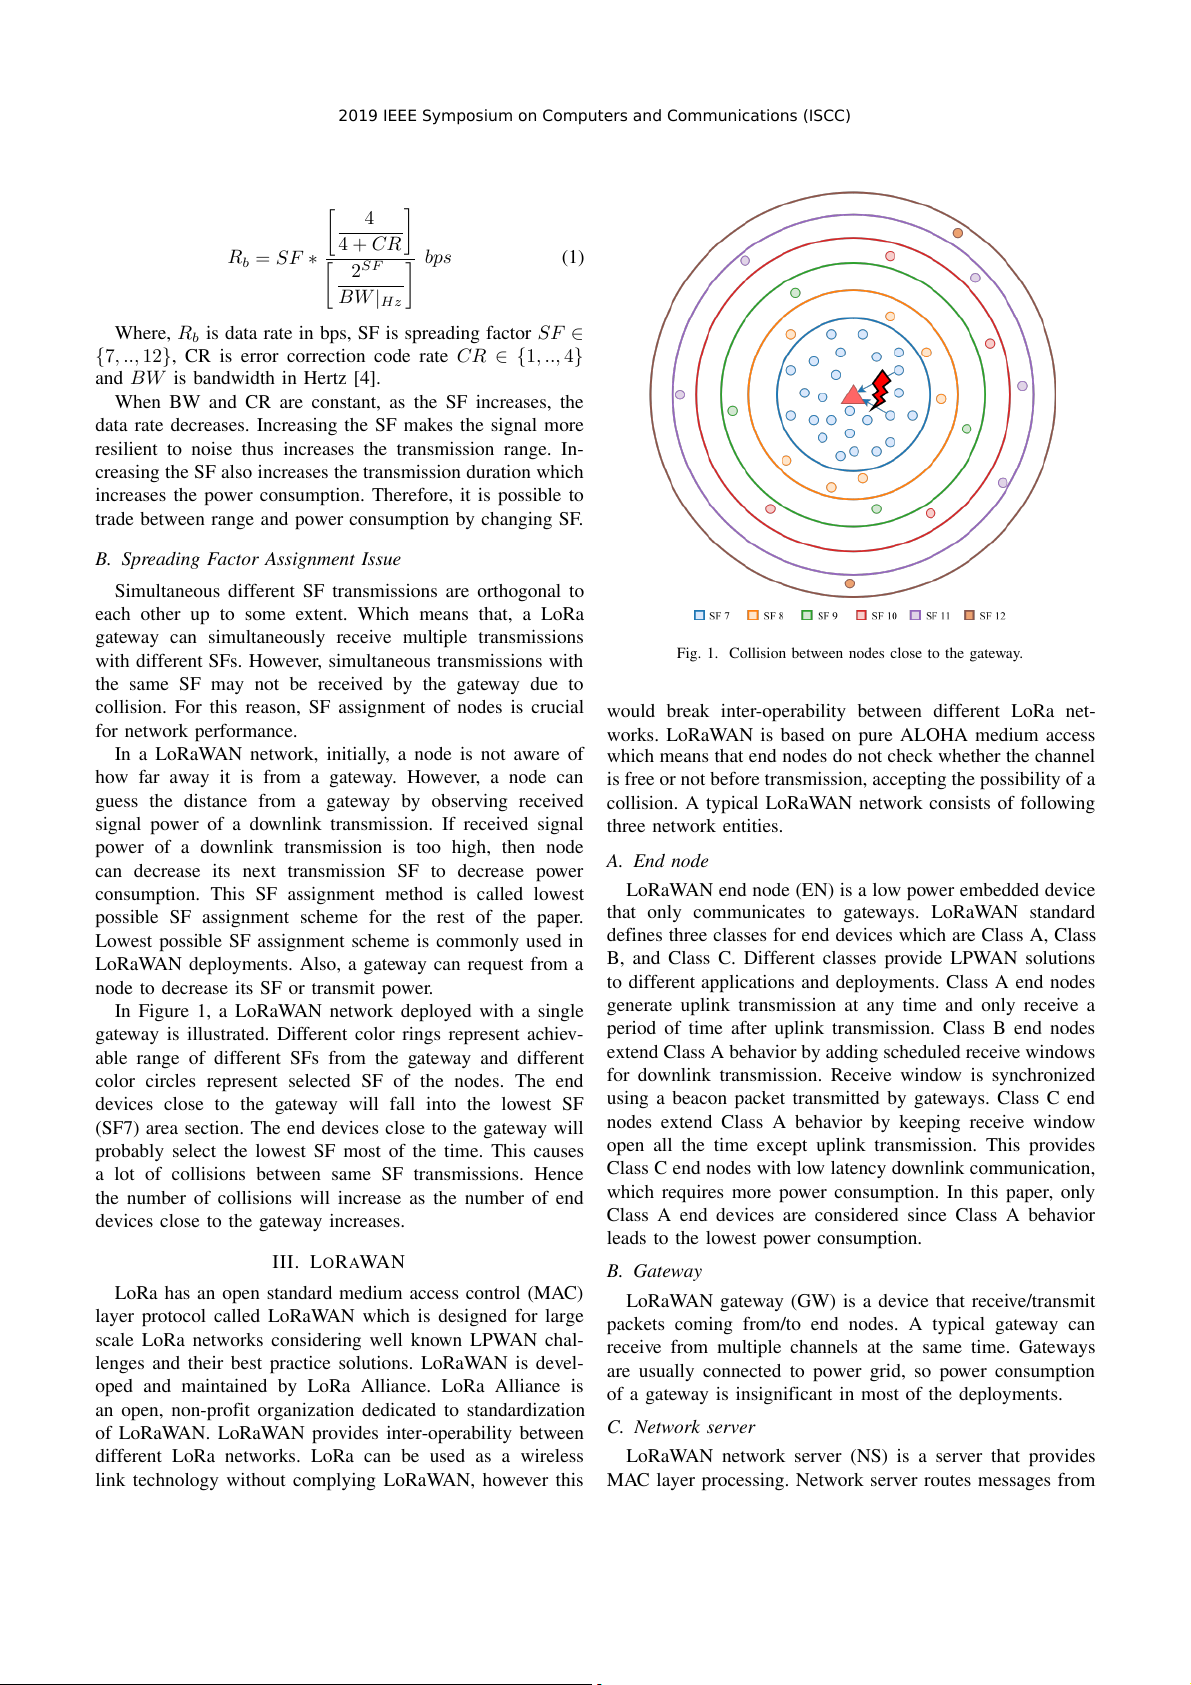
SFs as shown in Figure 2. Higher SF assigned nodes are drawn
used for tweaking end node parameters like channel, transmit
with bold circle border in Figure 2. However, distribution of
power and SF to increase network performance.
SF among nodes becomes an important problem. Increasing a
node’s SF should be done carefully since higher SF means IV. RELATED WORKS
longer air time and longer air time means increasing the
The literature related to the work presented in this paper has
probability of collisions with other high SF transmissions. In
started to grow recently. LPWAN technologies and especially
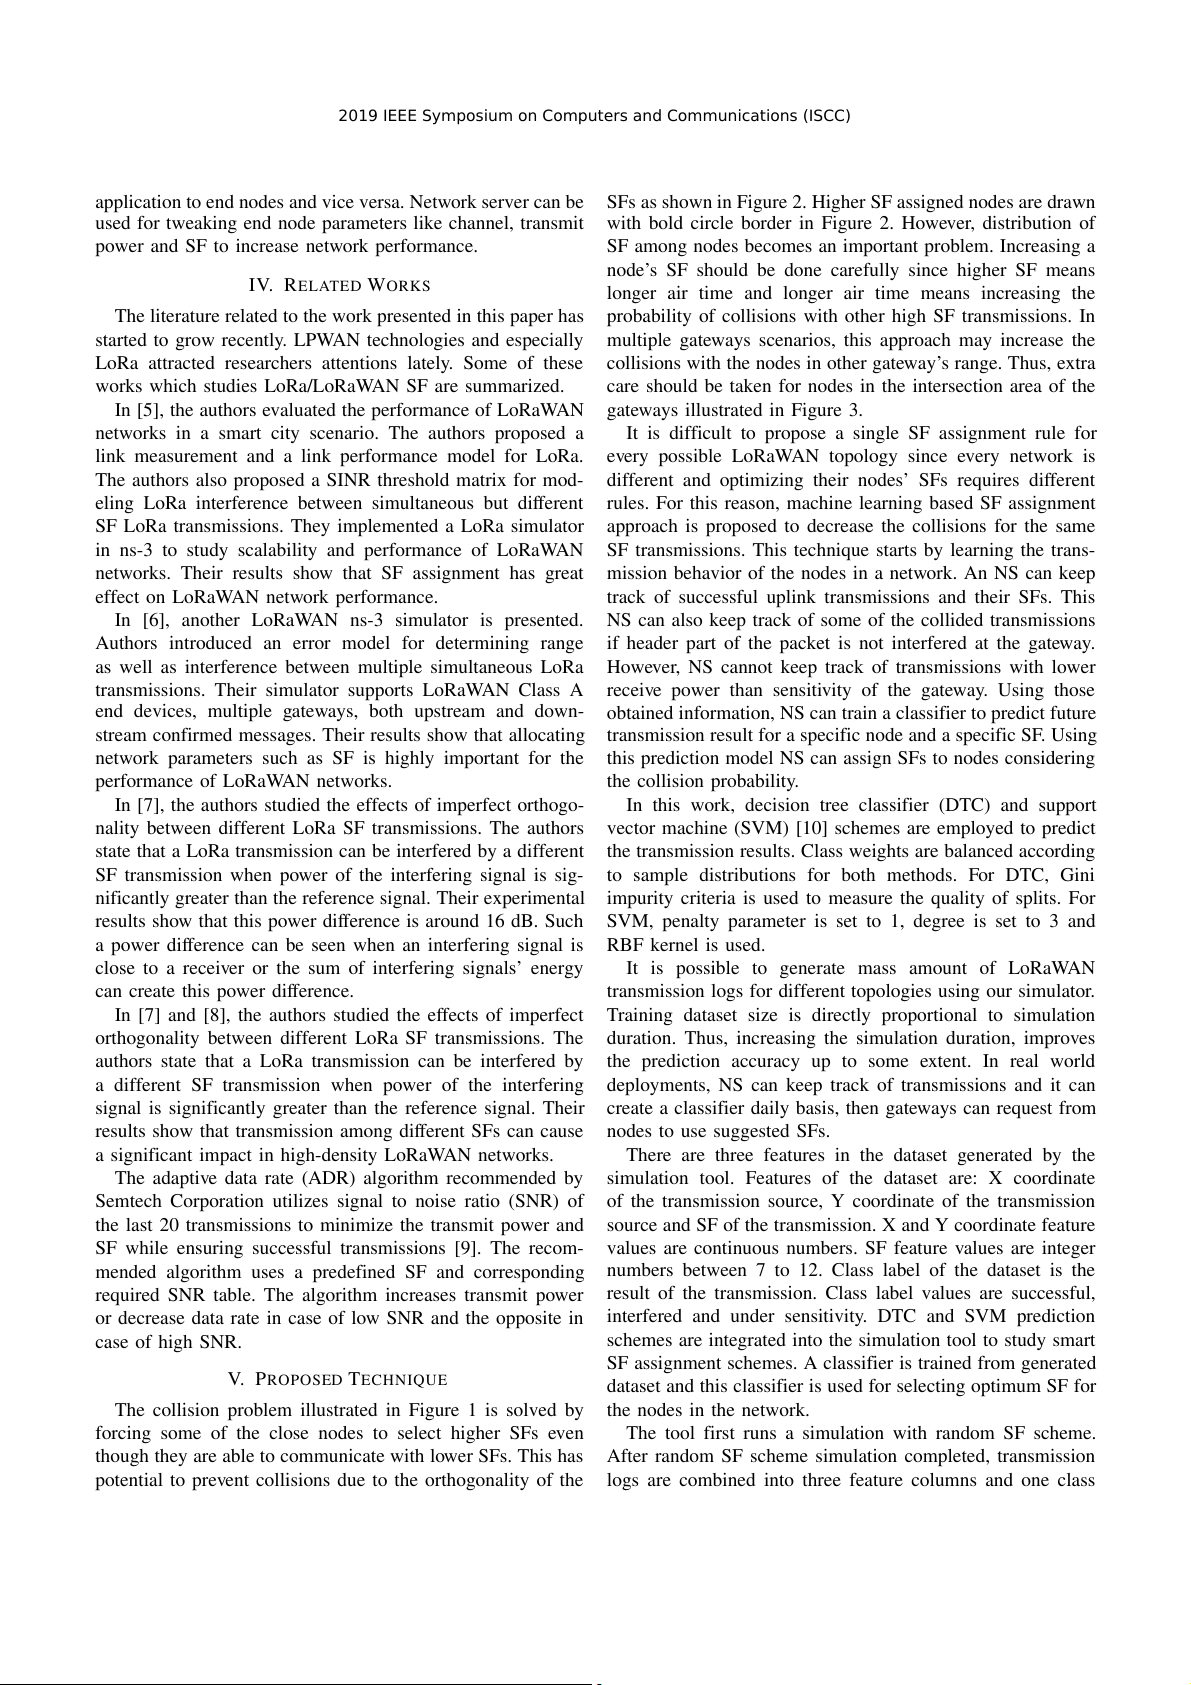
multiple gateways scenarios, this approach may increase the
LoRa attracted researchers attentions lately. Some of these
collisions with the nodes in other gateway’s range. Thus, extra
works which studies LoRa/LoRaWAN SF are summarized.
care should be taken for nodes in the intersection area of the
In [5], the authors evaluated the performance of LoRaWAN
gateways illustrated in Figure 3.
networks in a smart city scenario. The authors proposed a
It is difficult to propose a single SF assignment rule for
link measurement and a link performance model for LoRa.
every possible LoRaWAN topology since every network is
The authors also proposed a SINR threshold matrix for mod-
different and optimizing their nodes’ SFs requires different
eling LoRa interference between simultaneous but different
rules. For this reason, machine learning based SF assignment
SF LoRa transmissions. They implemented a LoRa simulator
approach is proposed to decrease the collisions for the same
in ns-3 to study scalability and performance of LoRaWAN
SF transmissions. This technique starts by learning the trans-
networks. Their results show that SF assignment has great
mission behavior of the nodes in a network. An NS can keep
effect on LoRaWAN network performance.
track of successful uplink transmissions and their SFs. This
In [6], another LoRaWAN ns-3 simulator is presented.
NS can also keep track of some of the collided transmissions
Authors introduced an error model for determining range
if header part of the packet is not interfered at the gateway.
as well as interference between multiple simultaneous LoRa
However, NS cannot keep track of transmissions with lower
transmissions. Their simulator supports LoRaWAN Class A
receive power than sensitivity of the gateway. Using those
end devices, multiple gateways, both upstream and down-
obtained information, NS can train a classifier to predict future
stream confirmed messages. Their results show that allocating
transmission result for a specific node and a specific SF. Using
network parameters such as SF is highly important for the
this prediction model NS can assign SFs to nodes considering
performance of LoRaWAN networks. the collision probability.
In [7], the authors studied the effects of imperfect orthogo-
In this work, decision tree classifier (DTC) and support
nality between different LoRa SF transmissions. The authors
vector machine (SVM) [10] schemes are employed to predict
state that a LoRa transmission can be interfered by a different
the transmission results. Class weights are balanced according
SF transmission when power of the interfering signal is sig-
to sample distributions for both methods. For DTC, Gini
nificantly greater than the reference signal. Their experimental
impurity criteria is used to measure the quality of splits. For
results show that this power difference is around 16 dB. Such
SVM, penalty parameter is set to 1, degree is set to 3 and
a power difference can be seen when an interfering signal is RBF kernel is used.
close to a receiver or the sum of interfering signals’ energy
It is possible to generate mass amount of LoRaWAN
can create this power difference.
transmission logs for different topologies using our simulator.
In [7] and [8], the authors studied the effects of imperfect
Training dataset size is directly proportional to simulation
orthogonality between different LoRa SF transmissions. The
duration. Thus, increasing the simulation duration, improves
authors state that a LoRa transmission can be interfered by
the prediction accuracy up to some extent. In real world
a different SF transmission when power of the interfering
deployments, NS can keep track of transmissions and it can
signal is significantly greater than the reference signal. Their
create a classifier daily basis, then gateways can request from
results show that transmission among different SFs can cause nodes to use suggested SFs.
a significant impact in high-density LoRaWAN networks.
There are three features in the dataset generated by the
The adaptive data rate (ADR) algorithm recommended by
simulation tool. Features of the dataset are: X coordinate
Semtech Corporation utilizes signal to noise ratio (SNR) of
of the transmission source, Y coordinate of the transmission
the last 20 transmissions to minimize the transmit power and
source and SF of the transmission. X and Y coordinate feature
SF while ensuring successful transmissions [9]. The recom-
values are continuous numbers. SF feature values are integer
mended algorithm uses a predefined SF and corresponding
numbers between 7 to 12. Class label of the dataset is the
required SNR table. The algorithm increases transmit power
result of the transmission. Class label values are successful,
or decrease data rate in case of low SNR and the opposite in
interfered and under sensitivity. DTC and SVM prediction case of high SNR.
schemes are integrated into the simulation tool to study smart
SF assignment schemes. A classifier is trained from generated V. PROPOSED TECHNIQUE
dataset and this classifier is used for selecting optimum SF for
The collision problem illustrated in Figure 1 is solved by the nodes in the network.
forcing some of the close nodes to select higher SFs even
The tool first runs a simulation with random SF scheme.
though they are able to communicate with lower SFs. This has
After random SF scheme simulation completed, transmission
potential to prevent collisions due to the orthogonality of the
logs are combined into three feature columns and one class
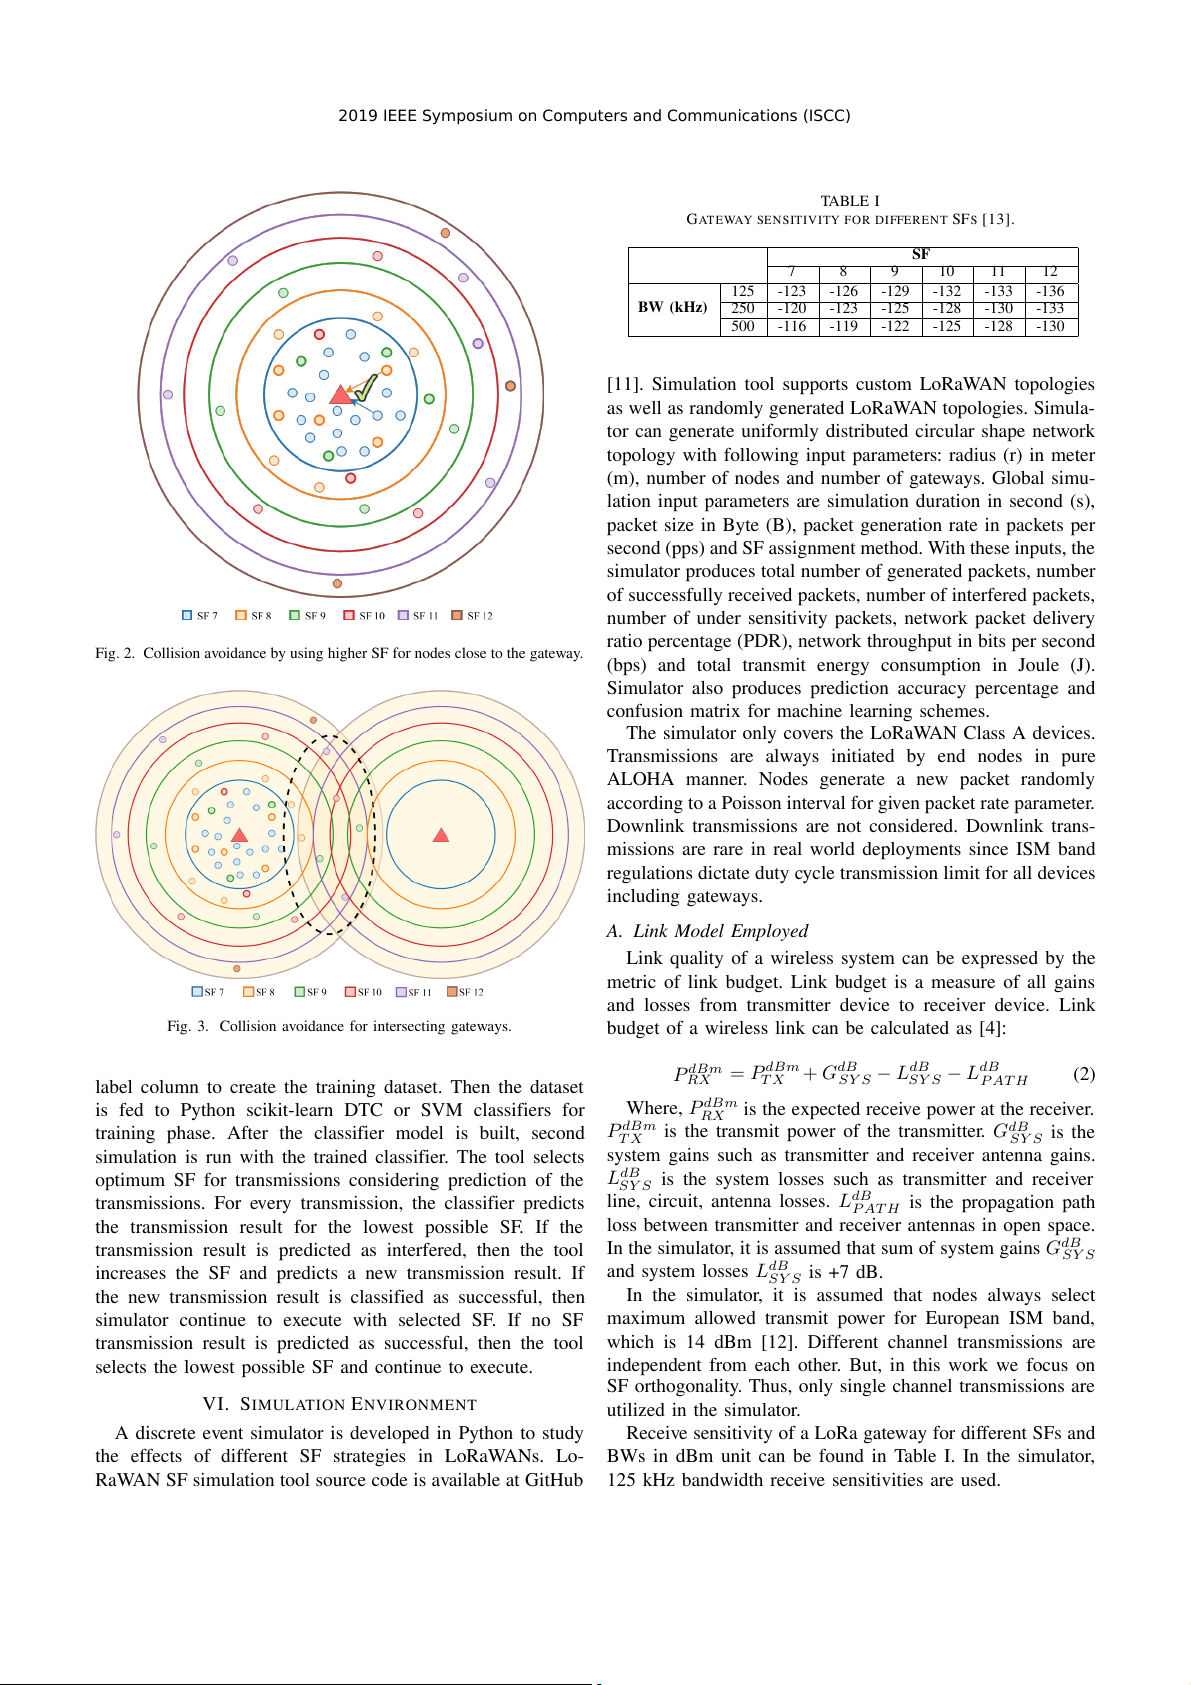
2019 IEEE Symposium on Computers and Communications (ISCC) TABLE I
GATEWAY SENSITIVITY FOR DIFFERENT SFS [13]. SF 7 8 9 10 11 12 125 -123 -126 -129 -132 -133 -136 BW (kHz) 250 -120 -123 -125 -128 -130 -133 500 -116 -119 -122 -125 -128 -130
[11]. Simulation tool supports custom LoRaWAN topologies
as well as randomly generated LoRaWAN topologies. Simula-
tor can generate uniformly distributed circular shape network
topology with following input parameters: radius (r) in meter
(m), number of nodes and number of gateways. Global simu-
lation input parameters are simulation duration in second (s),
packet size in Byte (B), packet generation rate in packets per
second (pps) and SF assignment method. With these inputs, the
simulator produces total number of generated packets, number
of successfully received packets, number of interfered packets,
number of under sensitivity packets, network packet delivery
ratio percentage (PDR), network throughput in bits per second
Fig. 2. Collision avoidance by using higher SF for nodes close to the gateway.
(bps) and total transmit energy consumption in Joule (J).
Simulator also produces prediction accuracy percentage and
confusion matrix for machine learning schemes.
The simulator only covers the LoRaWAN Class A devices.
Transmissions are always initiated by end nodes in pure
ALOHA manner. Nodes generate a new packet randomly
according to a Poisson interval for given packet rate parameter.
Downlink transmissions are not considered. Downlink trans-
missions are rare in real world deployments since ISM band
regulations dictate duty cycle transmission limit for all devices including gateways. A. Link Model Employed
Link quality of a wireless system can be expressed by the
metric of link budget. Link budget is a measure of all gains
and losses from transmitter device to receiver device. Link
Fig. 3. Collision avoidance for intersecting gateways.
budget of a wireless link can be calculated as [4]: P dBm = P dBm + GdB − LdB − LdB
label column to create the training dataset. Then the dataset RX T X SY S SY S P AT H (2)
is fed to Python scikit-learn DTC or SVM classifiers for
Where, P dBm is the expected receive power at the receiver. RX
training phase. After the classifier model is built, second
P dBm is the transmit power of the transmitter. GdB T X is the SY S
simulation is run with the trained classifier. The tool selects
system gains such as transmitter and receiver antenna gains.
optimum SF for transmissions considering prediction of the LdB
is the system losses such as transmitter and receiver SY S
transmissions. For every transmission, the classifier predicts
line, circuit, antenna losses. LdB is the propagation path P AT H
the transmission result for the lowest possible SF. If the
loss between transmitter and receiver antennas in open space.
transmission result is predicted as interfered, then the tool
In the simulator, it is assumed that sum of system gains GdB SY S
increases the SF and predicts a new transmission result. If and system losses LdB is +7 dB. SY S
the new transmission result is classified as successful, then
In the simulator, it is assumed that nodes always select
simulator continue to execute with selected SF. If no SF
maximum allowed transmit power for European ISM band,
transmission result is predicted as successful, then the tool
which is 14 dBm [12]. Different channel transmissions are
selects the lowest possible SF and continue to execute.
independent from each other. But, in this work we focus on
SF orthogonality. Thus, only single channel transmissions are VI. SIMULATION ENVIRONMENT utilized in the simulator.
A discrete event simulator is developed in Python to study
Receive sensitivity of a LoRa gateway for different SFs and
the effects of different SF strategies in LoRaWANs. Lo-
BWs in dBm unit can be found in Table I. In the simulator,
RaWAN SF simulation tool source code is available at GitHub
125 kHz bandwidth receive sensitivities are used.
2019 IEEE Symposium on Computers and Communications (ISCC)
Free space propagation loss is calculated as [14]: P dB
= 40(1 − 4 × 10⁻³ × h)log R| P AT H 10 km (3) −18log h| f | 10 m + 21log10 MHz + 80
Where, h is the gateway altitude and f is the frequency
of the signal. In this work, it is assumed that h = 15 m
and f = 868 MHz. With these assumptions, propagation loss calculation become [5]: P dB P AT H = 120.5 + 37.6log R| 10 km (4)
If the received signal power is higher than the gateway sen-
sitivity, then signal can be decoded by the receiver successfully
when there is no interfering transmission.
B. Interference Model Employed
In the simulator, interference model described in [5] is
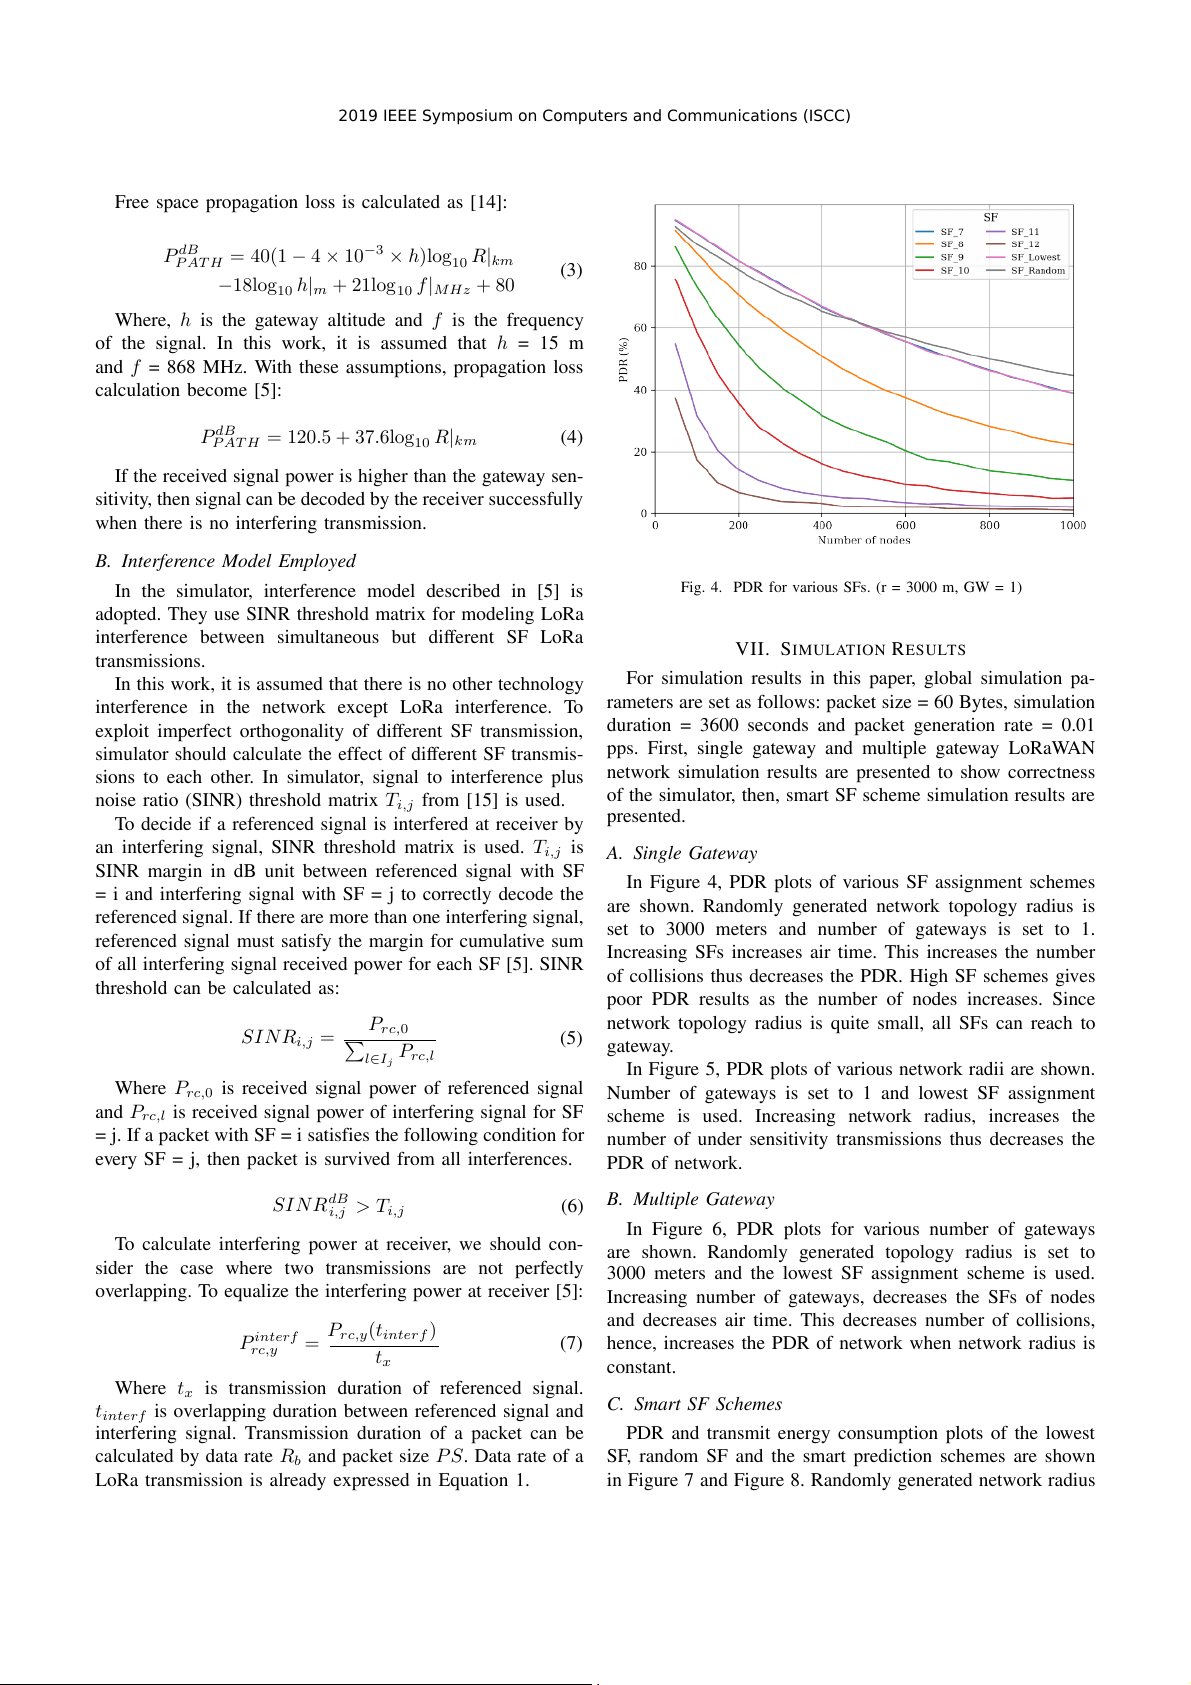
Fig. 4. PDR for various SFs. (r = 3000 m, GW = 1)
adopted. They use SINR threshold matrix for modeling LoRa
interference between simultaneous but different SF LoRa VII. SIMULATION RESULTS transmissions.
In this work, it is assumed that there is no other technology
For simulation results in this paper, global simulation pa-
interference in the network except LoRa interference. To
rameters are set as follows: packet size = 60 Bytes, simulation
exploit imperfect orthogonality of different SF transmission,
duration = 3600 seconds and packet generation rate = 0.01
simulator should calculate the effect of different SF transmis-
pps. First, single gateway and multiple gateway LoRaWAN
sions to each other. In simulator, signal to interference plus
network simulation results are presented to show correctness
noise ratio (SINR) threshold matrix T
of the simulator, then, smart SF scheme simulation results are i,j from [15] is used.
To decide if a referenced signal is interfered at receiver by presented.
an interfering signal, SINR threshold matrix is used. Ti,j is A. Single Gateway
SINR margin in dB unit between referenced signal with SF
In Figure 4, PDR plots of various SF assignment schemes
= i and interfering signal with SF = j to correctly decode the
are shown. Randomly generated network topology radius is
referenced signal. If there are more than one interfering signal,
set to 3000 meters and number of gateways is set to 1.
referenced signal must satisfy the margin for cumulative sum
Increasing SFs increases air time. This increases the number
of all interfering signal received power for each SF [5]. SINR
of collisions thus decreases the PDR. High SF schemes gives
threshold can be calculated as:
poor PDR results as the number of nodes increases. Since Prc,0
network topology radius is quite small, all SFs can reach to SINRi,j = (5) P P gateway. l∈I rc,l j
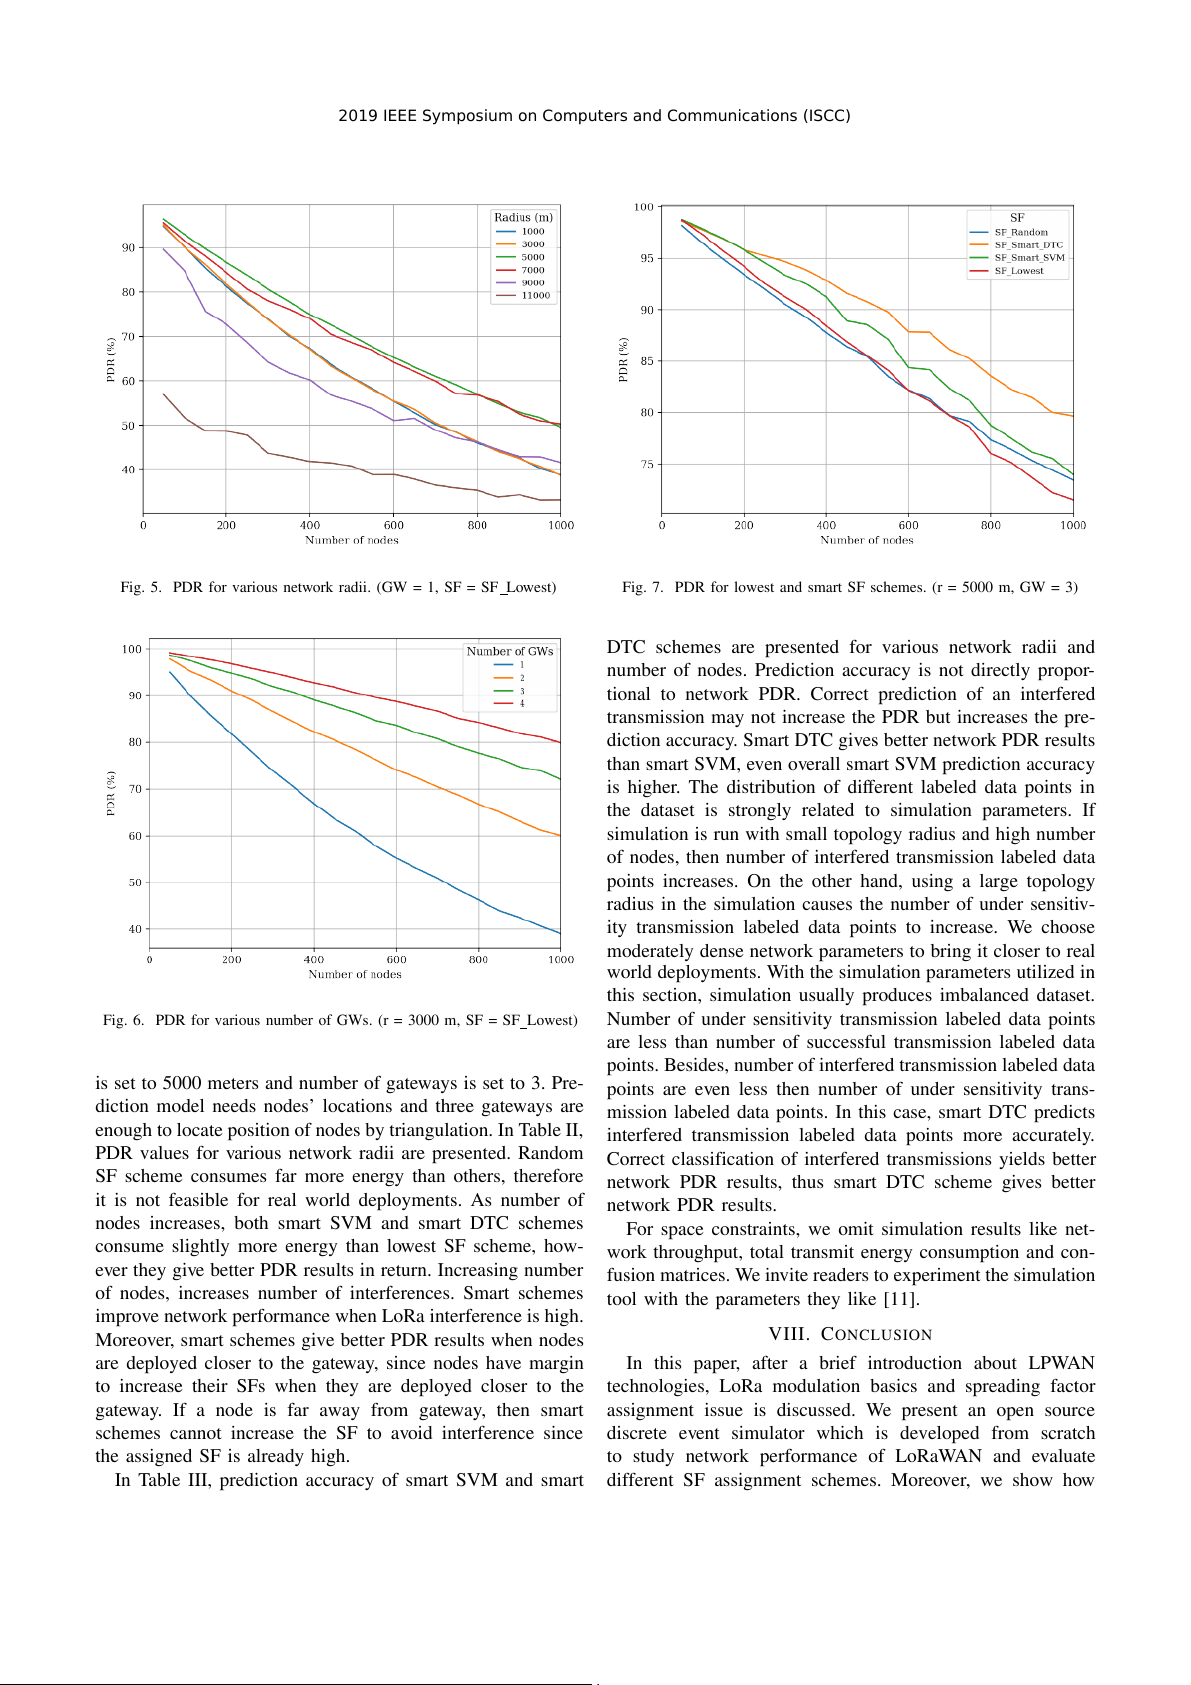
In Figure 5, PDR plots of various network radii are shown.
Where Prc,0 is received signal power of referenced signal
Number of gateways is set to 1 and lowest SF assignment
and Prc,l is received signal power of interfering signal for SF
scheme is used. Increasing network radius, increases the
= j. If a packet with SF = i satisfies the following condition for
number of under sensitivity transmissions thus decreases the
every SF = j, then packet is survived from all interferences. PDR of network. SINRdB B. Multiple Gateway i,j > Ti,j (6)
In Figure 6, PDR plots for various number of gateways
To calculate interfering power at receiver, we should con-
are shown. Randomly generated topology radius is set to
sider the case where two transmissions are not perfectly
3000 meters and the lowest SF assignment scheme is used.
overlapping. To equalize the interfering power at receiver [5]:
Increasing number of gateways, decreases the SFs of nodes
and decreases air time. This decreases number of collisions, Prc,y(tinterf ) P interf rc,y = (7)
hence, increases the PDR of network when network radius is tx constant.
Where tx is transmission duration of referenced signal. t C. Smart SF Schemes
interf is overlapping duration between referenced signal and
interfering signal. Transmission duration of a packet can be
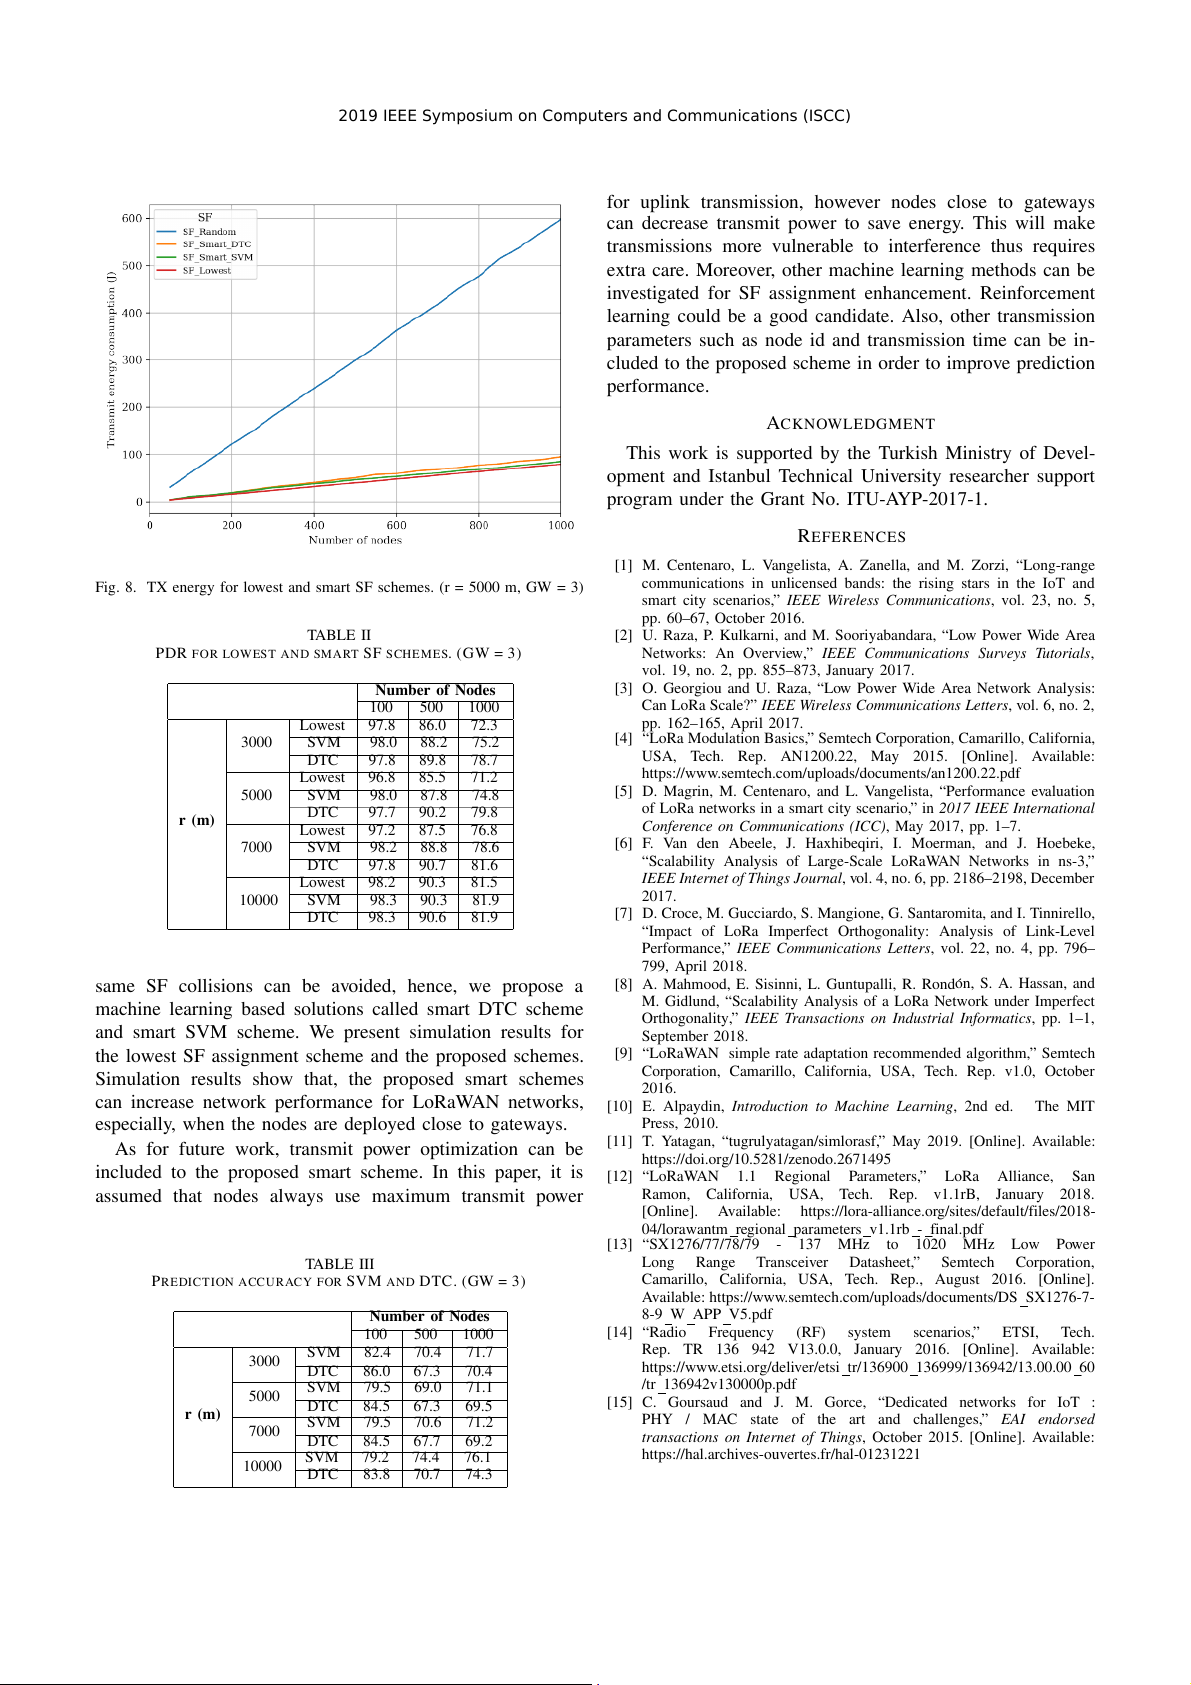
PDR and transmit energy consumption plots of the lowest
calculated by data rate Rb and packet size P S. Data rate of a
SF, random SF and the smart prediction schemes are shown
LoRa transmission is already expressed in Equation 1.
in Figure 7 and Figure 8. Randomly generated network radius
2019 IEEE Symposium on Computers and Communications (ISCC)
Fig. 5. PDR for various network radii. (GW = 1, SF = SF Lowest)
Fig. 7. PDR for lowest and smart SF schemes. (r = 5000 m, GW = 3)
DTC schemes are presented for various network radii and
number of nodes. Prediction accuracy is not directly propor-
tional to network PDR. Correct prediction of an interfered
transmission may not increase the PDR but increases the pre-
diction accuracy. Smart DTC gives better network PDR results
than smart SVM, even overall smart SVM prediction accuracy
is higher. The distribution of different labeled data points in
the dataset is strongly related to simulation parameters. If
simulation is run with small topology radius and high number
of nodes, then number of interfered transmission labeled data
points increases. On the other hand, using a large topology
radius in the simulation causes the number of under sensitiv-
ity transmission labeled data points to increase. We choose
moderately dense network parameters to bring it closer to real
world deployments. With the simulation parameters utilized in
this section, simulation usually produces imbalanced dataset.
Fig. 6. PDR for various number of GWs. (r = 3000 m, SF = SF Lowest)
Number of under sensitivity transmission labeled data points
are less than number of successful transmission labeled data
points. Besides, number of interfered transmission labeled data
is set to 5000 meters and number of gateways is set to 3. Pre-
points are even less then number of under sensitivity trans-
diction model needs nodes’ locations and three gateways are
mission labeled data points. In this case, smart DTC predicts
enough to locate position of nodes by triangulation. In Table II,
interfered transmission labeled data points more accurately.
PDR values for various network radii are presented. Random
Correct classification of interfered transmissions yields better
SF scheme consumes far more energy than others, therefore
network PDR results, thus smart DTC scheme gives better
it is not feasible for real world deployments. As number of network PDR results.
nodes increases, both smart SVM and smart DTC schemes
For space constraints, we omit simulation results like net-
consume slightly more energy than lowest SF scheme, how-
work throughput, total transmit energy consumption and con-
ever they give better PDR results in return. Increasing number
fusion matrices. We invite readers to experiment the simulation
of nodes, increases number of interferences. Smart schemes
tool with the parameters they like [11].
improve network performance when LoRa interference is high.
Moreover, smart schemes give better PDR results when nodes VIII. CONCLUSION
are deployed closer to the gateway, since nodes have margin
In this paper, after a brief introduction about LPWAN
to increase their SFs when they are deployed closer to the
technologies, LoRa modulation basics and spreading factor
gateway. If a node is far away from gateway, then smart
assignment issue is discussed. We present an open source
schemes cannot increase the SF to avoid interference since
discrete event simulator which is developed from scratch
the assigned SF is already high.
to study network performance of LoRaWAN and evaluate
In Table III, prediction accuracy of smart SVM and smart
different SF assignment schemes. Moreover, we show how
2019 IEEE Symposium on Computers and Communications (ISCC)
for uplink transmission, however nodes close to gateways
can decrease transmit power to save energy. This will make
transmissions more vulnerable to interference thus requires
extra care. Moreover, other machine learning methods can be
investigated for SF assignment enhancement. Reinforcement
learning could be a good candidate. Also, other transmission
parameters such as node id and transmission time can be in-
cluded to the proposed scheme in order to improve prediction performance. ACKNOWLEDGMENT
This work is supported by the Turkish Ministry of Devel-
opment and Istanbul Technical University researcher support
program under the Grant No. ITU-AYP-2017-1. REFERENCES
[1] M. Centenaro, L. Vangelista, A. Zanella, and M. Zorzi, “Long-range
Fig. 8. TX energy for lowest and smart SF schemes. (r = 5000 m, GW = 3)
communications in unlicensed bands: the rising stars in the IoT and
smart city scenarios,” IEEE Wireless Communications, vol. 23, no. 5, pp. 60–67, October 2016. TABLE II
[2] U. Raza, P. Kulkarni, and M. Sooriyabandara, “Low Power Wide Area
PDR FOR LOWEST AND SMART SF SCHEMES. (GW = 3)
Networks: An Overview,” IEEE Communications Surveys Tutorials,
vol. 19, no. 2, pp. 855–873, January 2017. Number of Nodes
[3] O. Georgiou and U. Raza, “Low Power Wide Area Network Analysis: 100 500 1000
Can LoRa Scale?” IEEE Wireless Communications Letters, vol. 6, no. 2, Lowest 97.8 86.0 72.3 pp. 162–165, April 2017. 3000 SVM 98.0 88.2 75.2
[4] “LoRa Modulation Basics,” Semtech Corporation, Camarillo, California, DTC 97.8 89.8 78.7
USA, Tech. Rep. AN1200.22, May 2015. [Online]. Available: Lowest 96.8 85.5 71.2
https://www.semtech.com/uploads/documents/an1200.22.pdf 5000 SVM 98.0 87.8 74.8
[5] D. Magrin, M. Centenaro, and L. Vangelista, “Performance evaluation DTC 97.7 90.2 79.8
of LoRa networks in a smart city scenario,” in 2017 IEEE International r (m) Lowest 97.2 87.5 76.8
Conference on Communications (ICC), May 2017, pp. 1–7. 7000 SVM 98.2 88.8 78.6
[6] F. Van den Abeele, J. Haxhibeqiri, I. Moerman, and J. Hoebeke, DTC 97.8 90.7 81.6
“Scalability Analysis of Large-Scale LoRaWAN Networks in ns-3,” Lowest 98.2 90.3 81.5
IEEE Internet of Things Journal, vol. 4, no. 6, pp. 2186–2198, December 10000 SVM 98.3 90.3 81.9 2017. DTC 98.3 90.6 81.9
[7] D. Croce, M. Gucciardo, S. Mangione, G. Santaromita, and I. Tinnirello,
“Impact of LoRa Imperfect Orthogonality: Analysis of Link-Level
Performance,” IEEE Communications Letters, vol. 22, no. 4, pp. 796– 799, April 2018.
same SF collisions can be avoided, hence, we propose a
[8] A. Mahmood, E. Sisinni, L. Guntupalli, R. Rond´on, S. A. Hassan, and
machine learning based solutions called smart DTC scheme
M. Gidlund, “Scalability Analysis of a LoRa Network under Imperfect
Orthogonality,” IEEE Transactions on Industrial Informatics, pp. 1–1,
and smart SVM scheme. We present simulation results for September 2018.
the lowest SF assignment scheme and the proposed schemes.
[9] “LoRaWAN simple rate adaptation recommended algorithm,” Semtech
Simulation results show that, the proposed smart schemes
Corporation, Camarillo, California, USA, Tech. Rep. v1.0, October 2016.
can increase network performance for LoRaWAN networks,
[10] E. Alpaydin, Introduction to Machine Learning, 2nd ed. The MIT
especially, when the nodes are deployed close to gateways. Press, 2010.
As for future work, transmit power optimization can be
[11] T. Yatagan, “tugrulyatagan/simlorasf,” May 2019. [Online]. Available:
https://doi.org/10.5281/zenodo.2671495
included to the proposed smart scheme. In this paper, it is [12] “LoRaWAN 1.1 Regional Parameters,” LoRa Alliance, San
assumed that nodes always use maximum transmit power Ramon, California, USA, Tech. Rep. v1.1rB, January 2018. [Online]. Available:
https://lora-alliance.org/sites/default/files/2018-
04/lorawantm regional parameters v1.1rb - final.pdf [13] “SX1276/77/78/79 - 137 MHz to 1020 MHz Low Power TABLE III Long Range Transceiver Datasheet,” Semtech Corporation,
PREDICTION ACCURACY FOR SVM AND DTC. (GW = 3)
Camarillo, California, USA, Tech. Rep., August 2016. [Online].
Available: https://www.semtech.com/uploads/documents/DS SX1276-7- Number of Nodes 8-9 W APP V5.pdf 100 500 1000 [14] “Radio Frequency (RF) system scenarios,” ETSI, Tech. SVM 82.4 70.4 71.7
Rep. TR 136 942 V13.0.0, January 2016. [Online]. Available: 3000 DTC 86.0 67.3 70.4
https://www.etsi.org/deliver/etsi tr/136900 136999/136942/13.00.00 60 SVM 79.5 69.0 71.1 /tr 136942v130000p.pdf 5000 DTC 84.5 67.3 69.5
[15] C. Goursaud and J. M. Gorce, “Dedicated networks for IoT : r (m) SVM 79.5 70.6 71.2
PHY / MAC state of the art and challenges,” EAI endorsed 7000 DTC 84.5 67.7 69.2
transactions on Internet of Things, October 2015. [Online]. Available: SVM 79.2 74.4 76.1
https://hal.archives-ouvertes.fr/hal-01231221 10000 DTC 83.8 70.7 74.3
Tài liệu liên quan:
-

Tóm tắt lý thuyết môn IoT và ứng dụng | Học viện Công Nghệ Bưu Chính Viễn Thông
23 12 -

Accelerated Corner-Detector Algorithms: GPU Implementations and Results | Iot và ứng dụng | Học viện Công nghệ Bưu chính Viễn thông
46 23 -

Đề xuất Dự án IoT: Thiết bị phát hiện chạm cho xe máy | Iot và ứng dụng | Học viện Công nghệ Bưu chính Viễn thông
35 18 -

Phân Tích và Giải Pháp FastAPI | Iot và ứng dụng | Học viện Công nghệ Bưu chính Viễn thông
30 15 -

Tăng cường pháp chế xã hội chủ nghĩa trong quản lý nhà nước | Iot và ứng dụng | Học viện Công nghệ Bưu chính Viễn thông
25 13