Statistics For Business Assignment - Statistics for Business | Trường Đại học Quốc tế, Đại học Quốc gia Thành phố HCM
Statistics For Business Assignment - Statistics for Business | Trường Đại học Quốc tế, Đại học Quốc gia Thành phố HCM được sưu tầm và soạn thảo dưới dạng file PDF để gửi tới các bạn sinh viên cùng tham khảo, ôn tập đầy đủ kiến thức, chuẩn bị cho các buổi học thật tốt. Mời bạn đọc đón xem!
Môn: Statistics for Business (BAO8OIU) 43 tài liệu
Trường: Trường Đại học Quốc tế, Đại học Quốc gia Thành phố Hồ Chí Minh 1.9 K tài liệu
Tác giả:


Preview text:
VIETNAM NATIONAL UNIVERSITY HCMC INTERNATIONAL UNIVERSITY
BA080IU – Statistics For Business
ASSIGNMENT (S1, 2022-2023) Instructions:
Due Date: 3pm, Monday 17th October 2022 (Week 8)
Submission: You must submit both soft copy (PDF file) and hard copy of your assignment.
Submit your assignment on Blackboard as a PDF file, and print out your assignment and
hand it in Room O1.306. Your submission will be complete only if both (soft and hard)
copies have been submitted.
• There are 8 questions in total.
• All questions should be answered clearly and in your own words.
• All relevant working must be shown.
• Your submission is final and whatever you submit will be marked. You will not be
given an opportunity to resubmit, so make sure that the document that you submit is
the final draft of your assignment and not some other document that is on your computer.
• No extensions will be granted. There will be a deduction of 30% of the total available
marks made from the total awarded mark for each day or part thereof that the
submission is late (for example, any submission after 3pm 17th October 2022 until
next day 18th October 2022 – 30% penalty). Please note that opening hours of Room
O1.306: 8.00 am – 3.30 pm Monday –
Friday. Therefore, you cannot submit the hard
copy of your assignment outside these opening hours. This penalty does not apply to
cases in which the University grants the student Special Consideration (e.g. medical
reasons). No submission will be accepted after the marked assignments have been
returned to the students. Students who wish to submit the assignment after the
deadline should contact the lecturer so that the necessary arrangements may be made.
• It is intended that students will work on the assignments independently. Students
who submit an assignment that is substantially copied from another source may
receive a mark of zero, and may be referred to the Faculty for further action. 1 QUESTION 1 (10 marks)
A recent study showed that women who lived near a freeway had an unusually high rate of
rheumatoid arthritis. Sarah said, “They should move away from freeways.” Is there a fallacy
in Sarah’s reasoning? Explain. QUESTION 2 (20 marks)
Below is a 6 x 8 array containing the ages of moviegoers. 32 34 33 12 57 13 58 16 23 23 62 65 35 15 17 20 14 11 51 33 31 13 11 58 23 10 63 34 12 15 62 13 40 11 18 62 64 30 42 20 21 56 11 51 38 49 15 21
Treat this as a population. Select a random sample of 10 moviegoers’ ages by using:
a. Simple random sampling with Excel’s =RANDBETWEEN( ) function. Explain your method.
b. Systematic sampling. Explain your method.
c. What was the proportion of all 48 moviegoers who were under age 30?
d. For each of the samples of size n = 10 that you took, what was the proportion of moviegoers under age 30?
e. Was each sample proportion close to the population proportion? QUESTION 3 (10 marks)
Parking at a large university has become a big problem. The university’s administrators want
to determine the average parking time of its students. An administrator inconspicuously
followed 250 students and carefully recorded the time it took them to find a parking spot.
a. What is the population of interest to the university administration?
b. Identify the sample of interest to the university administration.
c. What is the variable of interest to the university administration? QUESTION 4 (10 marks)
A manufacturer of computer chips claims that less than 10% of its products are defective.
When 1,000 chips were drawn from a large production, 7.5% were found to be defective.
a. What is the population of interest? b. What is the sample? 2 c. What is the parameter? d. What is the statistic?
e. Does the value 10% refer to the parameter or to the statistic?
f. Is the value 7.5% a parameter or a statistic?
g. Explain briefly how the statistic can be used to make inferences about the parameter to test the claim. QUESTION 5 (20 marks)
Below are sorted data showing average spending per customer (in dollars) at 74 Noodles & Company restaurants.
a. Explain how you chose the number of bins and the bin limits.
b. Make a histogram and describe its shape.
6.54 6.58 6.58 6.62 6.66 6.70 6.71 6.73 6.75 6.75 6.76 6.76
6.76 6.77 6.77 6.79 6.81 6.81 6.82 6.84 6.85 6.89 6.90 6.91
6.91 6.92 6.93 6.93 6.94 6.95 6.95 6.95 6.96 6.96 6.98 6.99
7.00 7.00 7.00 7.02 7.03 7.03 7.03 7.04 7.05 7.05 7.07 7.07
7.08 7.11 7.11 7.13 7.13 7.16 7.17 7.18 7.21 7.25 7.28 7.28
7.30 7.33 7.33 7.35 7.37 7.38 7.45 7.56 7.57 7.58 7.64 7.65 7.87 7.97 QUESTION 6 (10 marks)
Black Friday in the United States is the day after Thanksgiving. Many retailers offer door-
crasher specials to induce customers to shop at their stores. The number of door-crasher
specials is limited. However, the sale price is so low that people who want to buy that item
often line up outside the store to wait for it to open. A random sample of Black Friday
shoppers was asked how long they waited outside for the store to open (hours) and the
amount they expected to save by buying the door-crasher special. Draw a scatter diagram
and describe what you have learned from the graph. Time 3.0 2.5 1.5 5.0 3.0 4.5 7.0 0.5 6.5 6.0 Savings 325 250 275 150 225 350 375 100 400 350 3 QUESTION 7 (10 marks)
The monthly unemployment rate in one state for the past 12 months is listed here.
a. Draw a bar chart of these data with 6.0% as the lowest point on the vertical axis.
b. Draw a bar chart of these data with 0.0% as the lowest point on the vertical axis.
c. Discuss the impression given by the two charts.
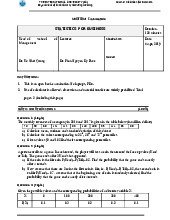
d. Which chart would you use? Explain. Month 1 2 3 4 5 6 7 8 9 10 11 12 Rate 7.5 7.6 7.5 7.3 7.2 7.1 7.0 6.7 6.4 6.5 6.3 6.0 QUESTION 8 (10 marks)
How well have Canada and the United States performed at the Winter Olympics? We
recorded the total number of medals won by the two countries in each year. Draw a chart
to describe both time series. Describe what you have discovered from the chart. Year Canada United States 1924 1 4 1928 1 6 1932 7 12 1936 1 4 1948 3 9 1952 2 11 1956 3 7 1960 4 10 1964 3 7 1968 3 7 1972 1 8 1976 3 10 1980 2 12 1984 4 8 1988 5 6 1992 7 11 1994 13 13 1998 15 13 2002 17 34 2006 24 25 2010 26 37 2014 25 28 2018 29 23 4
Tài liệu liên quan:
-
Đề thi giữa kỳ học phần Statistics for Business năm 2015 | Trường Đại học Quốc tế, Đại học Quốc gia Thành phố Hồ Chí Minh
323 162 -
Đề thi giữa kỳ học phần Statistics for Business có đáp án | Trường Đại học Quốc tế, Đại học Quốc gia Thành phố Hồ Chí Minh
385 193 -
Đề thi giữa kỳ học phần Statistics for Business năm 2019 | Trường Đại học Quốc tế, Đại học Quốc gia Thành phố Hồ Chí Minh
270 135 -
Đề thi giữa kỳ học phần Statistics for Business | Trường Đại học Quốc tế, Đại học Quốc gia Thành phố Hồ Chí Minh
283 142 -
Bài tập tiểu luận nhóm học phần Statistics for Business | Trường Đại học Quốc tế, Đại học Quốc gia Thành phố Hồ Chí Minh
293 147