Toyota_Production_System_Berengueres_2012
cuốn sách nói về cấu trúc quản trị vận hành và sản xuất của toyota
Môn: Tài liệu Tổng hợp 3.6 K tài liệu
Trường: Tài liệu khác 3.9 K tài liệu
Tác giả:


Preview text:
THE TOYOTA PRODUCTION SYSTEM RE-CONTEXTUALIZED
(With history, anecdotes and implementation tips) 4thEdition Includes Value Stream Mapping case by Staffan Nöteberg
Jose Berengueres, Ph. D
The Toyota Production System Re-contextualized 4th Edition ISBN 978-1-84753-477-4
Copyright © 2007-2012 by Jose Berengueres. All rights reserved. Revised 4rd English Edition, Dubai October 2012 Contents
1 Industry Framework ................................................................. 11
1.1 Toyota: Growth and efficiency .................................................... 11
1.2 Size Matters ............................................................................... 13
1.3 The consolidation wave of the 90s ............................................. 15
1.4 Organic growth vs. Acquisition ................................................... 18
2 Brief history of Toyota .............................................................. 21
2.1 Origin .......................................................................................... 21
2.2 The Beginnings .......................................................................... 21
2.3 Mommy’s Loom .......................................................................... 24
2.4 From the Loom to the Automobile .............................................. 25
2.5 Taiichi Ohno or the birth of TPS ................................................. 28
3 The Production System ............................................................ 31
3.1 Underlying Principles .................................................................. 31
3.2 Operative Targets ....................................................................... 33
3.3 The difference between “Lean” and “TPS” ................................. 33
3.4 Sociolinguistic barriers ............................................................... 35
3.5 A visit to Denso Academy .......................................................... 37
4 TPS step by step ...................................................................... 41
4.1 Poka-Yoke and Jidouka ............................................................. 41
4.2 Muda - Waste ............................................................................. 45
4.3 Standardization of Work ............................................................. 52
4.4 Visualization ............................................................................... 52
4.5 Itsutsu no Naze .......................................................................... 53
4.6 Heijunka and Push/Pull .............................................................. 55
4.7 Just-in-Time ................................................................................ 56
4.8 Gemba & Genchi Genbutsu ........................................................ 57
4.9 Kanban ....................................................................................... 58
4.10 Andon ....................................................................................... 59
4.11 Multi-product mini-batch ........................................................... 61
4.12 Sense of Crisis .......................................................................... 62
4.13 5S – Kaizen .............................................................................. 63
4.14 How-to Organize a Kaizen committee ...................................... 70
4.15 The P.D.C.A method ................................................................. 74
4.16 How–to A3 Report and Value Stream Mapping ........................ 78
5 Appendix: Fun facts about Japanese carmakers ..................... 81
References .................................................................................. 87 Industry Framework | 11
There is only one way... to be the best,
slogan of Nissan in the roaring 90s 1 Industry Framework
1.1 Toyota: Growth and efficiency
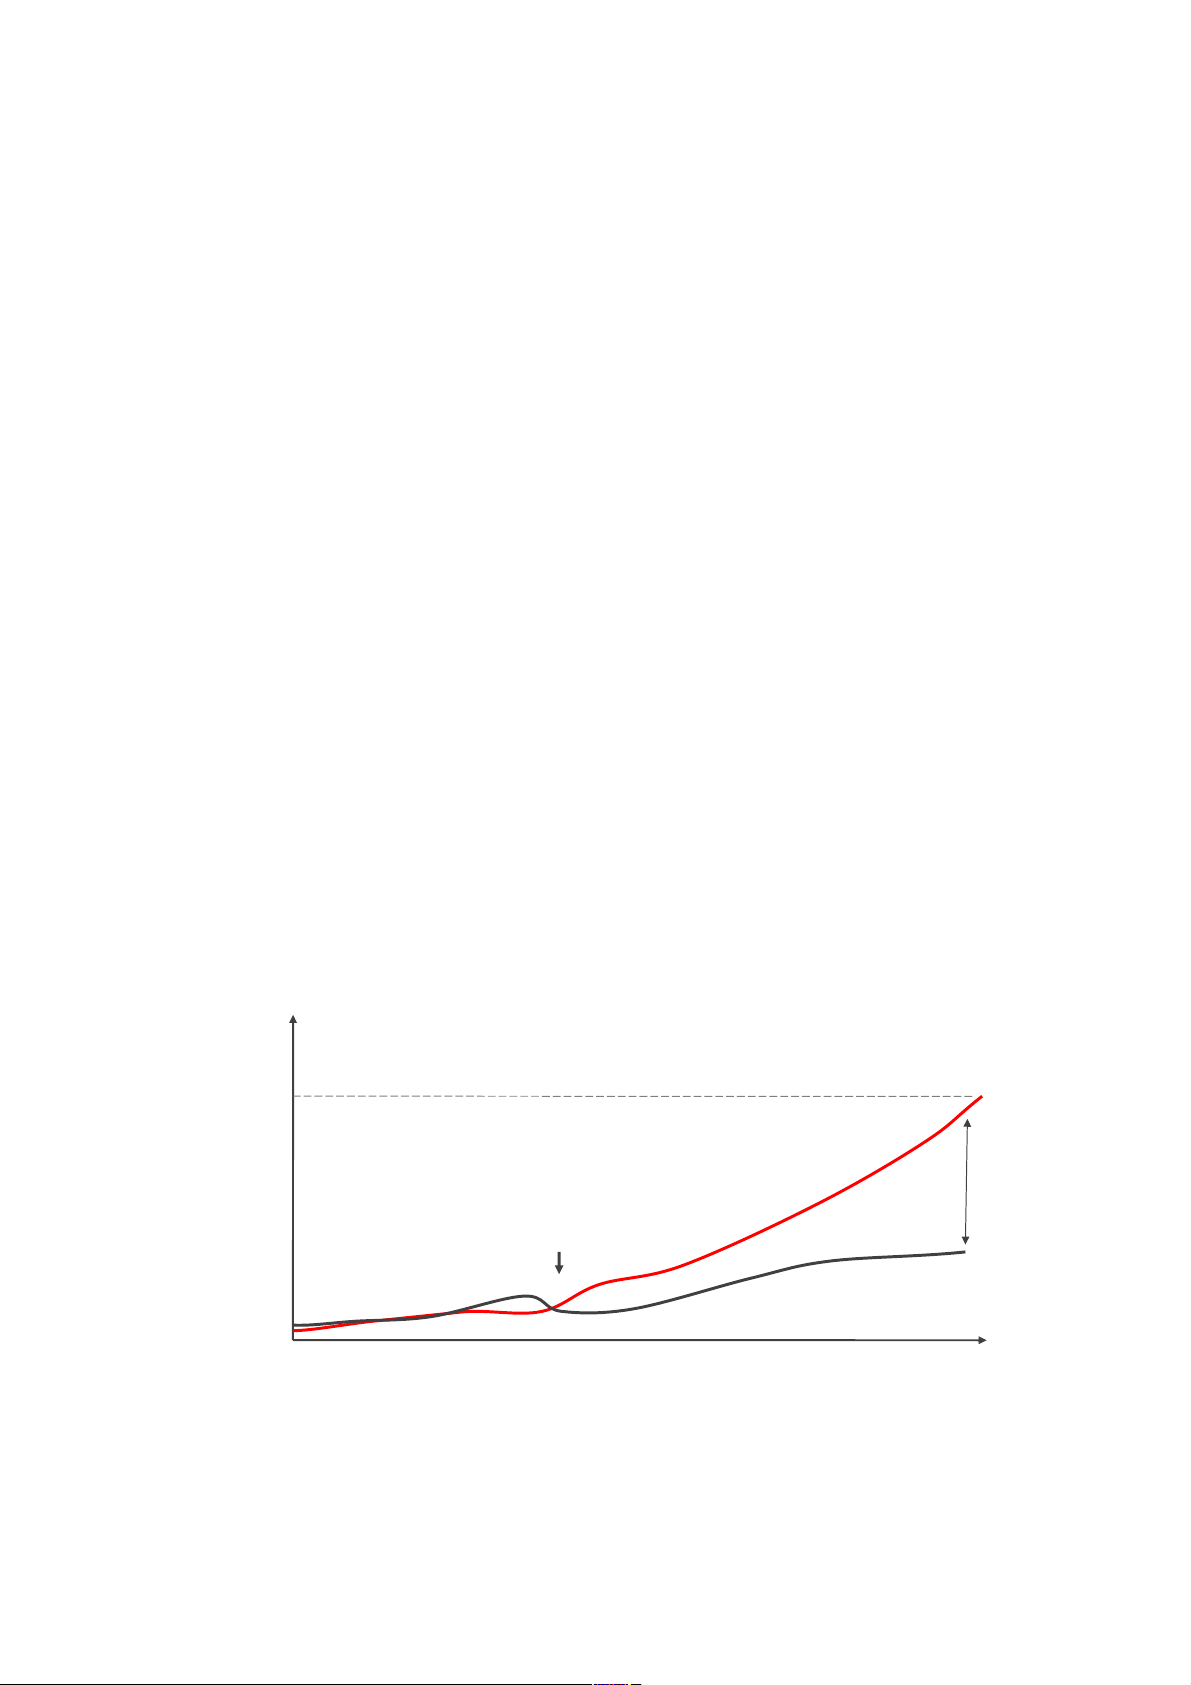
Figure 1 shows the benefit per car sold of two carmakers (Toyota and
Volkswagen). From all the volume manufacturers Toyota is the one that
makes the highest profit and with great distance from the rest of global
manufacturers. It is also the largest company by market capitalization per
car sold (five year average). Where lays the reason of this competitive
advantage? If we ask people at consulting firms, they say that Toyota is
not the most productive manufacturer ever. In 2006 in the key North
American market for instance, Nissan beats Toyota in labour productivity
(18 hours of labour to make a car vs. 22 hours for Toyota) and also in
pre-tax profit per car sold 1500 vs. 1000 EUR. (GM lost 1000 per car sold).
Toyota does not own the most productive plants either. Toyota 1000€ car Sold 1st Oil shock Profit per 331€ VolksWagen* 1960 1970 1980 1990 2000
Figure 1 Profit per car sold of Toyota vs. Volkswagen (2005). What is the source
of Toyota’s competitive advantage? 12 | Jose Berengueres
However, on a global scale it is the only one manufacturer that uses its
factories nearest to its full capacity. 96 to 106% compared to a typical
75% industry average. It is also the volume manufacturer that produces the
most reliable cars (Harbour 2006). Consider this, in 2006 for each Toyota
car sold customers encountered 1.06 problems within 90 days of the
purchase. The industry average is 1.24 problems. As for the other
carmakers: Volkswagen rated 1.71. Nissan rated 1.21 (Initial Quality, J.D
Power 2006). What is the key of Toyota’s success? Of all the factors that
could explain Toyota’s growth: (i) labour productivity (ii) capacity utilization (iii) product quality
none of them seems more correlated with Toyota’s progression than
product quality. On the other hand, if we compare quality at Toyota,
Nissan and Volkswagen, (1.06, 1.21 and 1.71) the spread does not seem so
big. It is just 0.65 more problems per every one car sold. 65 per cent points
does not seem a big figure, but Toyota sold 10 million cars last year so
that's 6.5 million problems less to take care of. Taxi of choice
Lets take a look at taxi fleets in free markets such as Abu Dhabi, UAE.
The Toyota Camry is 70% of the total fleet:
Taxi Driver – These cars are driven 24 hours continuously in two
shift drivers. The company provides accommodation for the
drivers. Two drivers are assigned per car. When one driver works
the other sleeps, so the car is always driving. At this rate each
taxi logs 900 km per day, it can produce a daily income of
400-800Dhs (100-200$). Most taxis will reach the 600,000km
mark after two years. After they reach this mark, they are sold or scrapped.
Author – What about the other cars such as the Nissan Sunny or the Hyundai Sonata? Industry Framework | 13
Taxi Driver – Hyundai is not a bad car. It is good for family use,
but only Camry can go up to 600,000 km.
In the end, this tinny quality gap has had a clear effect for Toyota: (i) The hoarding of huge capitals (ii) Sustained growth
Therefore reducing (the causes of) such gap should be a top priority for
any manager that wishes to survive let alone succeed. But, how to close
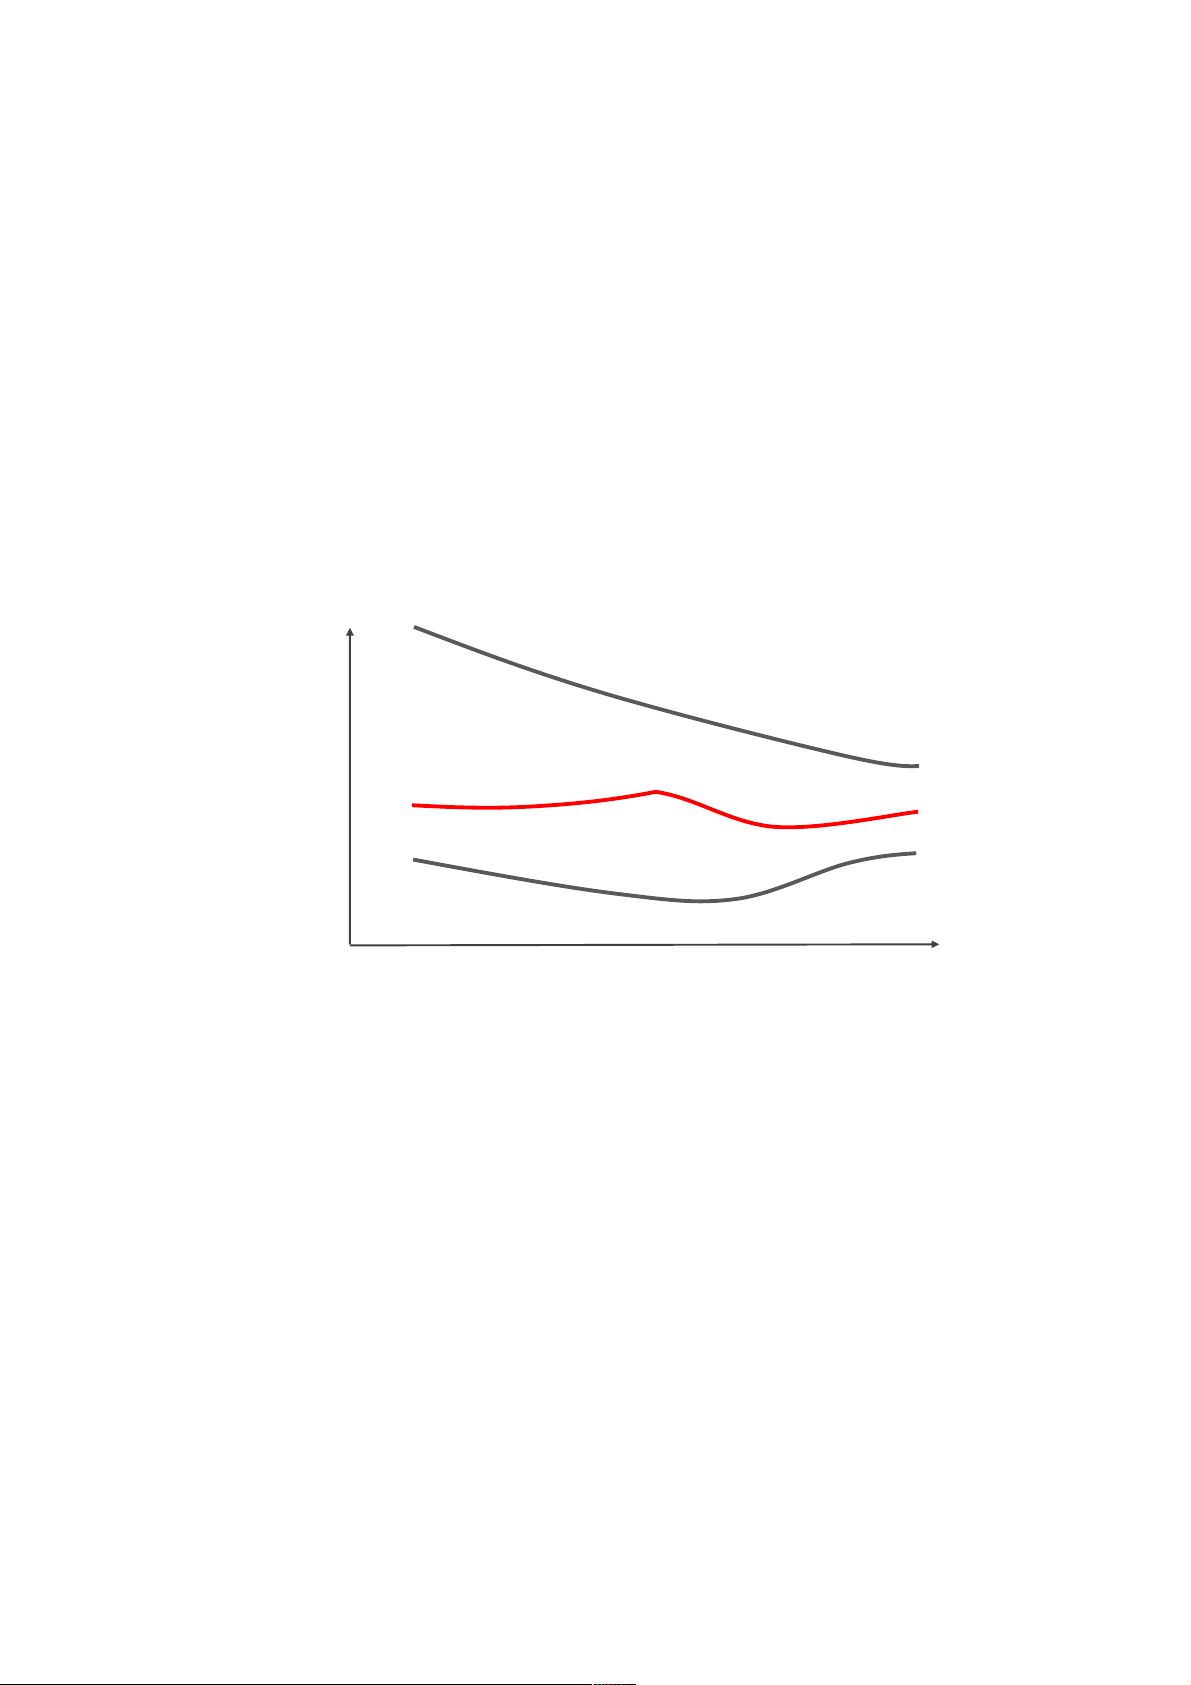
the quality gap? How to be efficient without compromising on quality? 32h icle Veh 24h urs per GM 21.4h Toyota bly Ho 19.2h Nissan Assem 19h 1999 2002 2005
Figure 2 Labour productivity evolution in North America (Harbour 2006).
Toyota is not the most productive maker in manpower terms. 1.2 Size Matters
Once mass-production of a new product commences a law, as precise as
Moore’s law can approximate the cost of producing an additional unit.
According to this law, the cost decreases exponentially not with time but
with the cumulative number of units produced. A way of being more
efficient is gaining size to reach the so-called scale economies. There are two ways of doing that: (i) Organically (ii) Merger and Acquisition 14 | Jose Berengueres
Organic growth refers to the growing of a plant: slow but steady. A
paradigmatic example of organic growth can be found in Inditex S.A of
Spain. The rationale behind most M&A is that the combination of two
entities in a bigger one results in an entity with larger operations and thus
able to undertake bigger economies of scale. That is the idea behind being
the cost leader. In the light of this reasoning an M&A operation is justified
if the future savings due to future scale economies are bigger than the cost
of transaction plus integration.
Are Future Savings larger than acquisition price + integration costs?
As we will see later M&A is a concept with no traction inside the Toyota
philosophy. Nevertheless, this does not mean that at Toyota they ignore
the importance of being big. On the contrary, an illustrative example can
be found in the battle that Toyota and Honda held for the hybrid market
some years ago. You probably remember the Prius: the best selling hybrid
car in history. Maybe the Honda Insight does not sound so familiar. Honda
Insight is also a hybrid car (less popular than the Prius) but that was first
to market. If you see a 1999 Honda Insight on the street you will quickly
realize the reason why it was less popular than the Prius: it is smaller and just two persons can fit in.
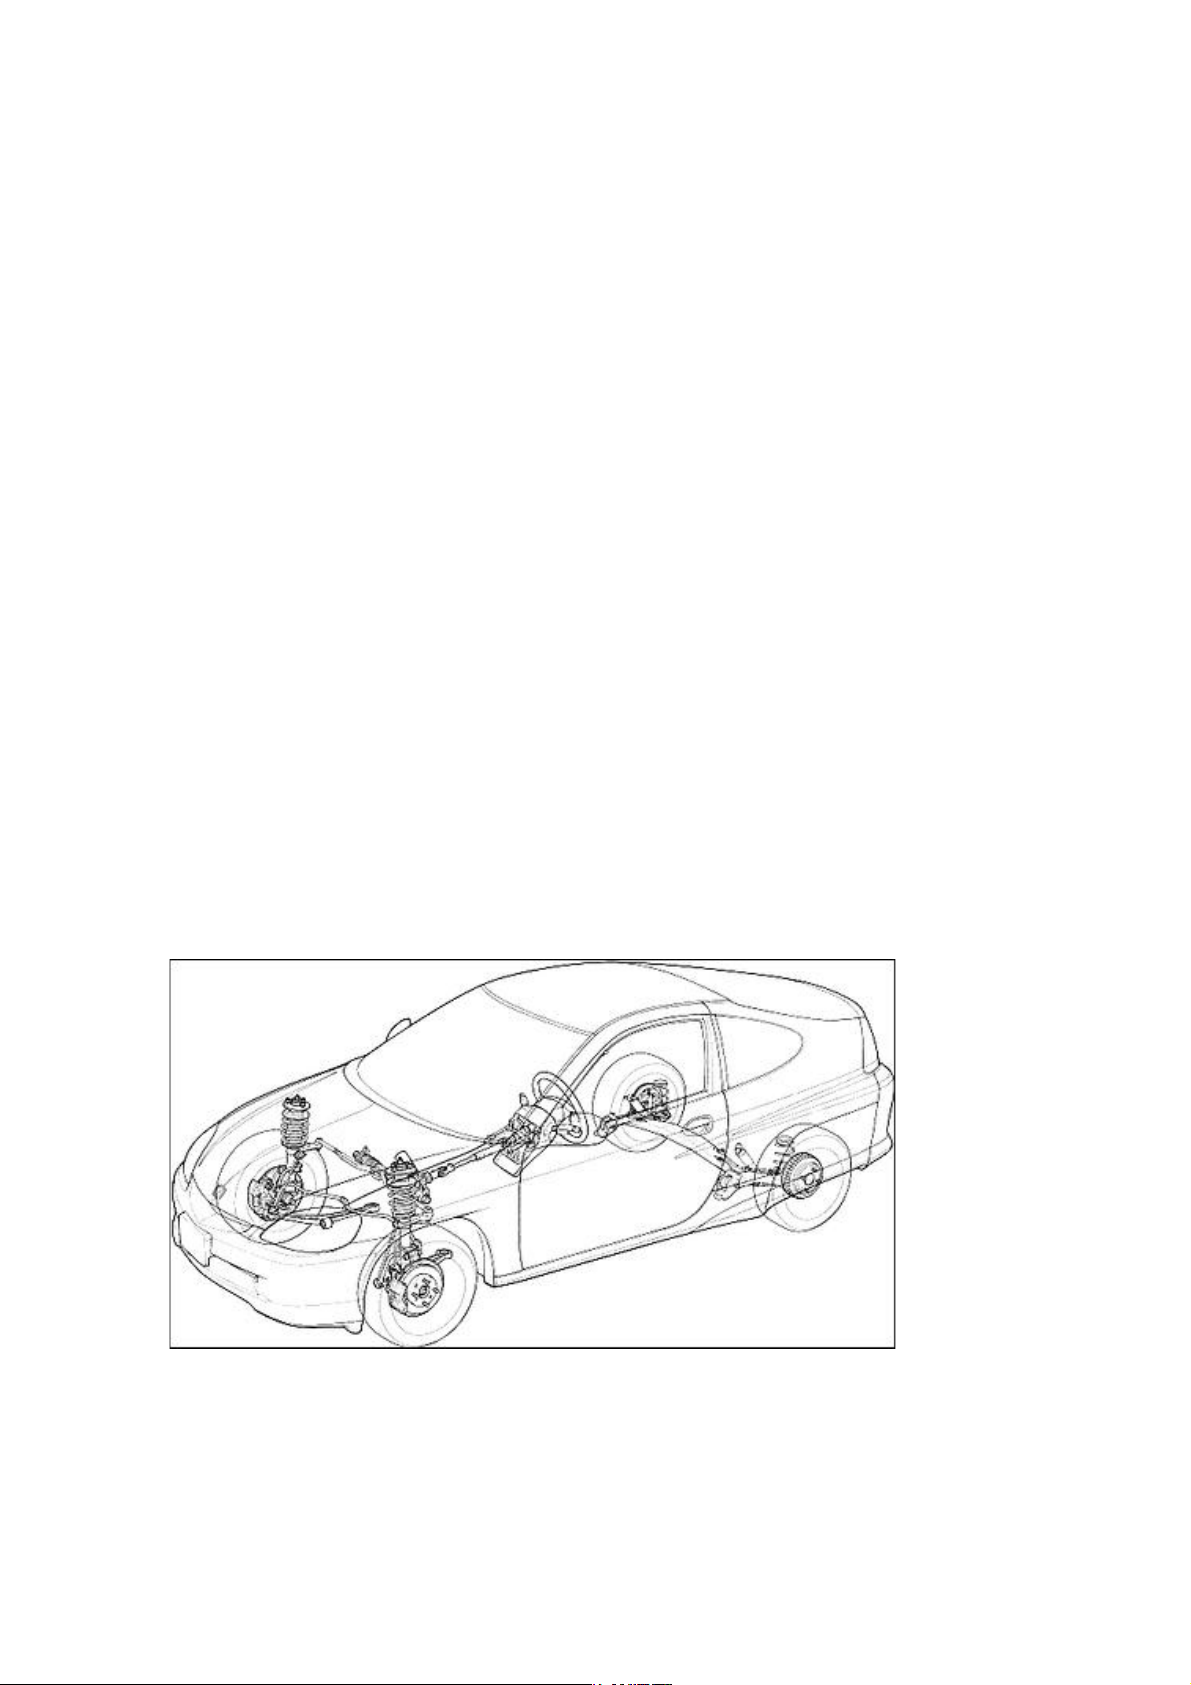
Figure 3 Layout of the two-seater Honda Insight of 1999. There was not enough
space for additional seats. Source: Honda/cartype.com.
The reason is that the rear of the Insight hosts hybrid components. Industry Framework | 15
Couldn’t Honda in the 90s develop a hybrid car for four passengers? The
answer is no. Honda (because of it smaller size) did not have enough
resources at that time to develop a specific platform for a larger hybrid.
Faced with the dilemma the Honda engineers had no choice but to reuse
an existing platform (the one of its bestselling compacts). This left no
space... Put in words by a Honda chief engineer:
“I already told (the higher ups) that by using such platform there
would not be enough space for 5 seats, but we already had been
told that there was not enough money to develop a specific
platform…” (Nikkei 2006)
On the other hand, Toyota due to its larger size could afford the risks (and
costs) of designing a Prius from zero including a new brand platform.
Building a hybrid was a direct order from at the time Toyota CEO, the
genial Hiroshi Okuda. The order was given in 1996 to a staff in a rather casual way:
“Well, now you don't have an excuse not to make a hybrid” (Nikkei 2006)
A decade later, the result is clear: Prius won, and the conclusion of the
Insight-Prius battle is that size matters. Every body knows it. In the
following section we will examine how this idea coupled with greed and
fear shaped the industry during the 90s.
1.3 The consolidation wave of the 90s
In the post-war era automobile industry, M&A was a fairly rare
phenomenon until the decade of the 90s when the sector enters a very
active phase believed to start with the acquisition of Rover by BMW. The
operation would later turn sour and would end up in BMW selling Rover.
Nevertheless, a cunning BMW would retain the rights to the Rover-owned
Mini brand and would successfully re-launch it some years later. Since
then, only a select bunch of deals has had positive returns on investment:
The re-purchase by General Motors of Hyundai Motor after the Korean
Won devaluation in 1997. The acquisition by Ford of Mazda by which 16 | Jose Berengueres
Ford through Mark Fields brings to Mazda a much-needed management
expertise that traces its origins to Mr. McNamara’s Whiz Kids. The
agreement between Nissan and Renault by which a “literally” desperate
Nissan, that had just been turned down by Daimler, (in the wake of the
Daimler-Mitsubishi alliance), accepts the management leadership of
Carlos Goshn in management matters (not technology):
“You tell us how to organize ourselves. But please... don’t tell us
how to make a car”. (Magee 2005).
Is Nissan a proud company? The acronym stands for Japanese Productions, in Japanese: Nippon Seisan.
NISSAN = NIP-PON + SEI-SAN
Nissan started producing cars in Yokohama at the same time as Toyota but
that ended up in a very different philosophical silo. Nissan grew out of
agglutinating smaller makers such as Datsun under Japanese government
directions. From the rest of the consolidation wave (read fear) that swept
across Detroit and Western Europe during the 90s few other deals had
positive returns on investment. An iconic example of a failed acquisition is
the takeover of Chrysler by German Daimler. Chrysler, as they say, was
the queen of Detroit in 1998. It had become thanks to the success of the Chrysler voyager:
“Voyager was the first minivan that could hold the bites and
parts of the extended family, dogs etcetera together” (Blue Ocean Strategy, 2005).
Daimler paid 36 billion dollars for it. In 2008 some analysts estimated that
it was worth less than 12 billion. The explanation offered by Liker on this
loss of value is as follows: at the end of the 90s Chrysler had managed to
establish Toyota-style relations with its supplier network. They had
succeeded in replicating what in Toyota they call an extended supplier
network (Liker 2003). This was starting to bear fruits with cars such as the
Chrysler Neon (a car that even sold some units in Europe during the 90s)
and the PT Cruiser (a car that looks like a shoe but that is popular among Industry Framework | 17
consumers because of its usability). However, after the Germans took over
Chrysler they imposed cost cutting drives that destroyed whatever
provider-relations Chrysler had built.
“At the Toyota Head Quarters they were really alarmed by the
progression of Chrysler” (Liker 2007)
Figure 4 More powerful but cheaper than the competition, the 1996 Chrysler
Neon revolutionized the car industry with powerful base engines. An example of
value innovation is shown here: the famous three clips instead of the customary
four helped cut costs at no visible loss for the customer.
On one occasion Toyota did buy one Chrysler Neon car. It was
disassembled in-house. Then it was shown to the press in the following way:
Ah… but look here. This panel is attached with clips! And only three of them.
Years later, the value destruction at Chrysler became apparent and
questioned the long-term logic of the Germanic cost cutting drives. The
lesson here is clear: it is better to treat your suppliers as part of your
family. If you squeeze them too much today, tomorrow they will lack competitive capacity. 18 | Jose Berengueres Teaching
A healthy provider is more useful than a zombie one at Toyota they say:
Treat your suppliers as an extension of your own company
1.4 Organic growth vs. Acquisition
The 90s lesson is that slower organic growth seems to be the only credible
ways to gain scale in order to survive in a globalizing market. It is the way
chosen (willingly or unwillingly) by Honda, BMW and Suzuki.
Additionally, in this framework of global overcapacity (currently
estimated at 75% in 2006) appears Toyota with record profits and its
production system. The visionary book The machine that changed the
world by Womack in 1990 and more recently the bestseller The Toyota
Way (Liker 2003) have decisively contributed to popularize the Toyota
production techniques in the West. All this factors have put Toyota and in
particular its production system in the spotlight. Not only due to financial
reasons but also because its long-term thinking rings a bell with
sustainable thinking. This is a remarkable fact because it is the first time
since Kung Fu made it to Hollywood that a thinking based on Confucian
principles has been so widely studied in West. Never the less, the Toyota
Production System is traditionally absorbed in the West under the names
such as Lean Management or GE’s Black Belt certification system. In fact,
there is no shortage of firms that try to import, copy or adapt the Toyota
Production System (from now on referred as TPS). However, experience
tells us that implementing TPS in the West is no easy task. In fact, it is not
even an easy thing to do in Japan. In spite that, several carmakers have
named its production systems after Toyota: Ford has its own FPS: Ford
Production System. Nissan has its own NPS: Nissan Production System.
Moreover, General Motors has a 50% joint venture with Toyota at the
NUMMI factory in California but for years has been unable to transplant
the experience of NUMMI to the rest of its factories (Liker 2003). At the
end NUMMI was a factory failure. The site is now the main site of Tesla Industry Framework | 19 Motors.
The teaching that we can extract from the 90s is that size does matters, but
there are no shortcuts. In the following chapters we explain the basics of
the TPS: its origins and concepts such as waste (muda) that stem precisely
from the Zen thinking of Less is More.
Tài liệu liên quan:
-

Ung dung game hoa trong cac chien dich MKT
23 12 -
Bao cao Chi so TMDT Viet Nam 2025
26 13 -
Thông tư quy định về việc phân quyền, phân cấp và phân định thẩm quyền quản lý nhà nước về giáo dục cho chính quyền địa phương
30 15 -
Nghị quyết về phát huy các giá trị di sản văn hóa gắn với phát triên du lịch bền vững tỉnh Khánh Hòa đến năm 2025, định hướng đến năm 2030
25 13 -

Quyết định phê duyệt Chiến lược phát triển du lịch Việt Nam đến năm 2030
16 8