Analysis of Variance (ANOVA) | Bài giảng số 12 chương 7 học phần Applied statistics | Trường Đại học Quốc tế, Đại học Quốc gia Thành phố Hồ Chí Minh
n the other hand, when the null hypothesis is false, then MSTR will tend to be larger than MSE. So the ratio of MSTR and MSE can be used as an indicator of the equality or inequality of the r population means. This ratio (MSTR/MSE) will tend to be near to 1 if the null hypothesis is true, and greater than 1 if the null hypothesis is false. The ANOVA test is a test of whether (MSTR/MSE) is equal to, or greater than, 1. Tài liệu giúp bạn tham khảo, ôn tập và đạt kết quả cao. Mời bạn đón xem.
Môn: Applied statistics (ENEE1006IU) 47 tài liệu
Trường: Trường Đại học Quốc tế, Đại học Quốc gia Thành phố Hồ Chí Minh 1.9 K tài liệu
Tác giả:


Preview text:
APPLIED STATISTICS COURSE CODE: ENEE1006IU Lecture 12:
Chapter 7: Analysis of Variance (ANOVA)
(3 credits: 2 is for lecture, 1 is for lab-work)
Instructor: TRAN THANH TU Email: tttu@hcmiu.edu.vn tttu@hcmiu.edu.vn 1
CHAPTER 7: ANALYSIS OF VARIANCE (ANOVA)
•7.1. Inferences about a population variance
•7.2. Inferences about two population variances
•7.3. Assumptions for analysis of variance •7.4. A conceptual overview •7.5. ANOVA table •7.6. ANOVA procedure
7.3. AN INTRODUCTION TO EXPERIMENTAL DESIGN AND ANALYSIS OF VARIANCE
•completely randomized design •randomized block design •factorial experiment tttu@hcmiu.edu.vn 2
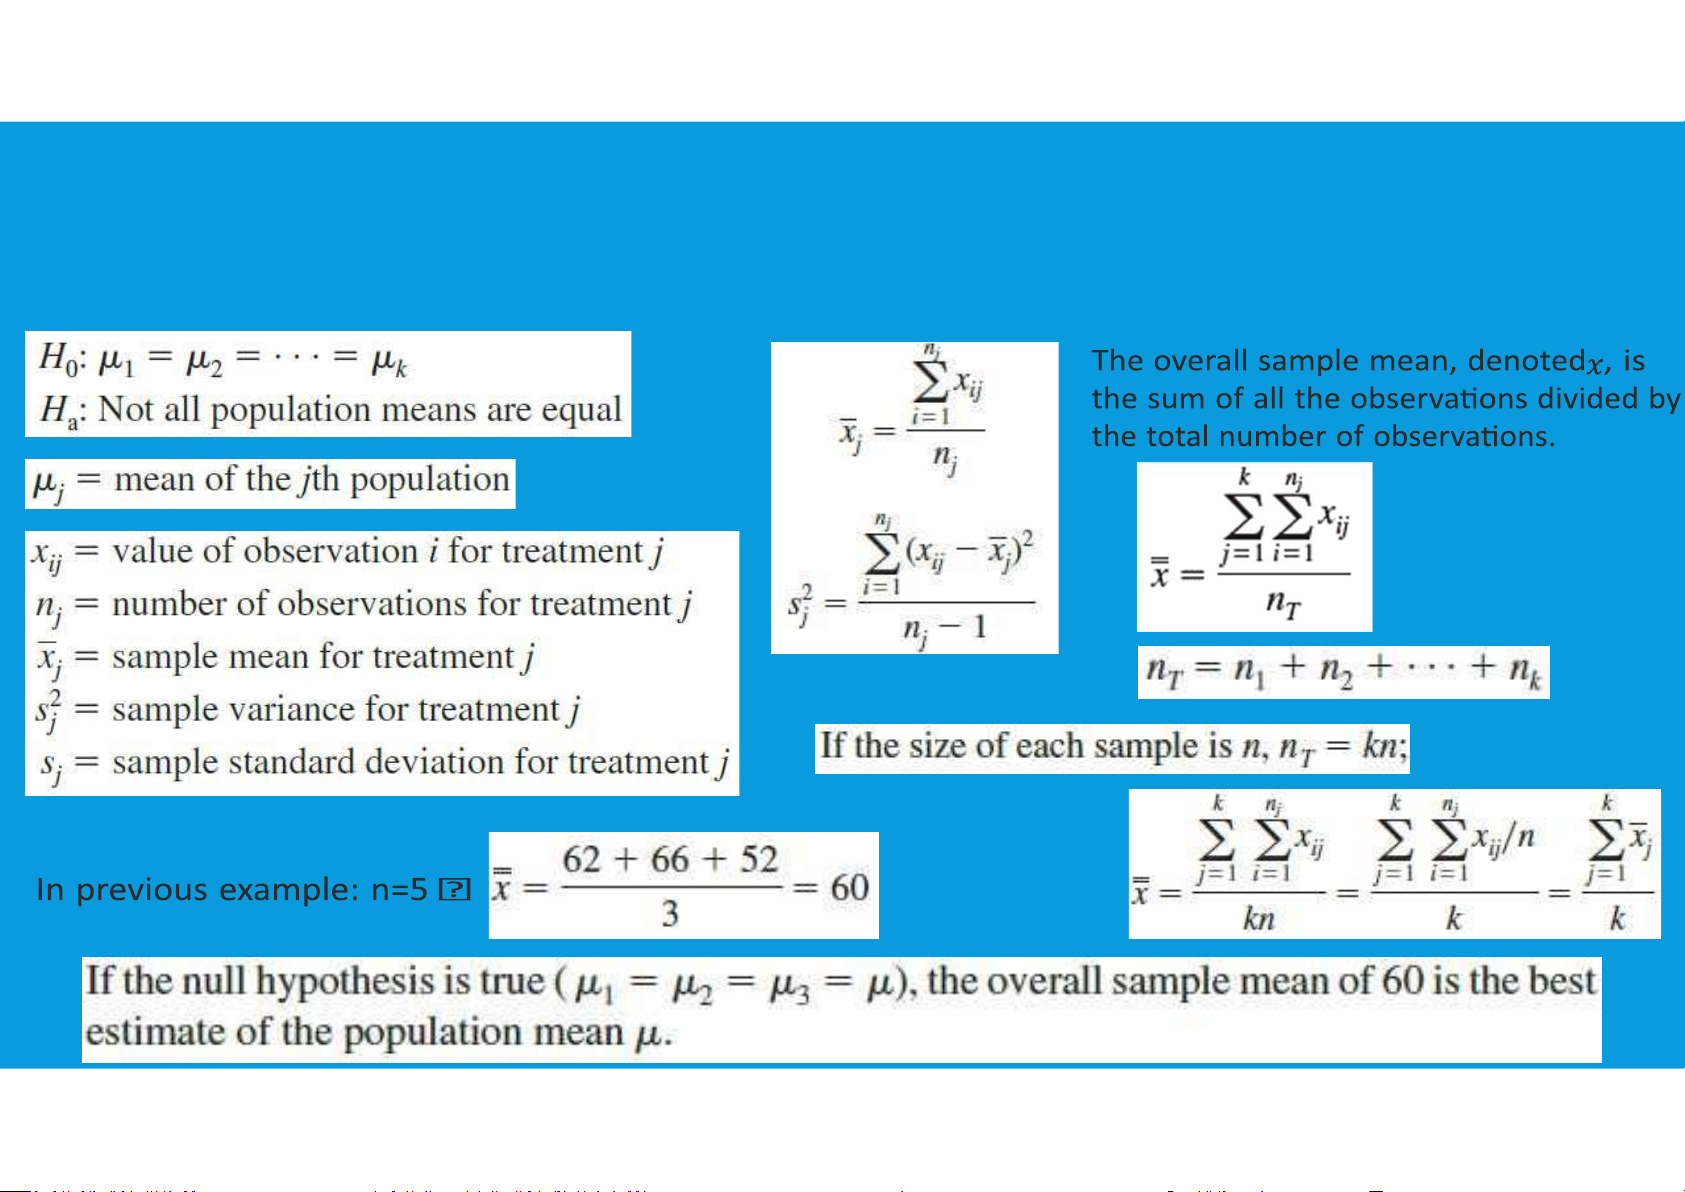
Three assumptions are required to use analysis of variance:
-For each population, the response variable is normally distributed
-The variance of the response variable, denoted σ2, is the same for all of the populations
-The observations must be independent
7.3. AN INTRODUCTION TO EXPERIMENTAL DESIGN AND ANALYSIS tttu@hcmiu.edu.vn 3 OF VARIANCE tttu@hcmiu.edu.vn 4
7.3. AN INTRODUCTION TO EXPERIMENTAL DESIGN AND ANALYSIS OF VARIANCE
7.3. AN INTRODUCTION TO EXPERIMENTAL DESIGN AND ANALYSIS OF VARIANCE tttu@hcmiu.edu.vn 5 - If H0 is true: (between-treatments)
-If H0 is false: between-treatments estimate of σ2 will be overstated (pooled estimate)
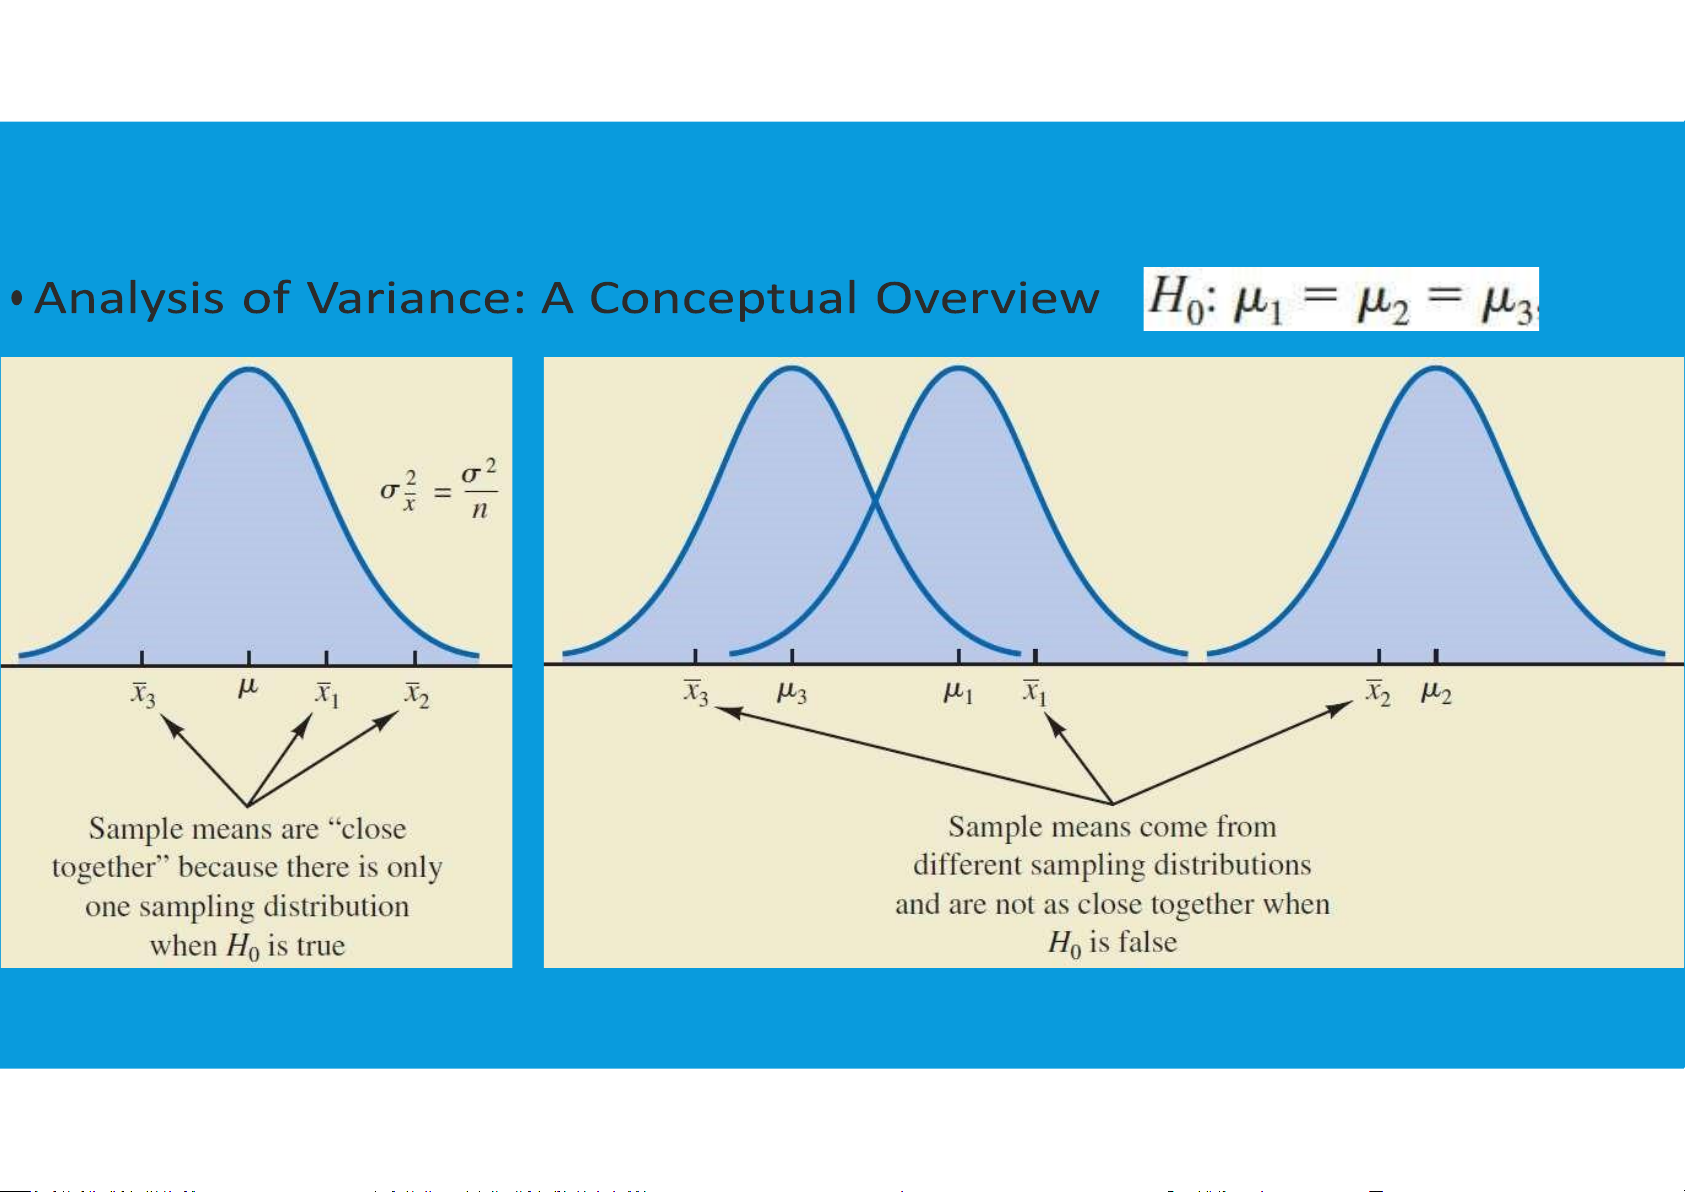
If the null hypothesis is true, the two estimates will be similar and their ratio will be close to 1.
If the null hypothesis is false, the between- treatments estimate will be larger than
the within-treatments estimate, and their ratio will be large.
•By comparing these two estimates of σ2, we will be able to determine whether the
population means are equal. ANOVA tttu@hcmiu.edu.vn 6 7.4. A CONCEPTUAL OVERVIEW
•ANOVA and the Completely Randomized Design tttu@hcmiu.edu.vn 7 7.4. A CONCEPTUAL OVERVIEW
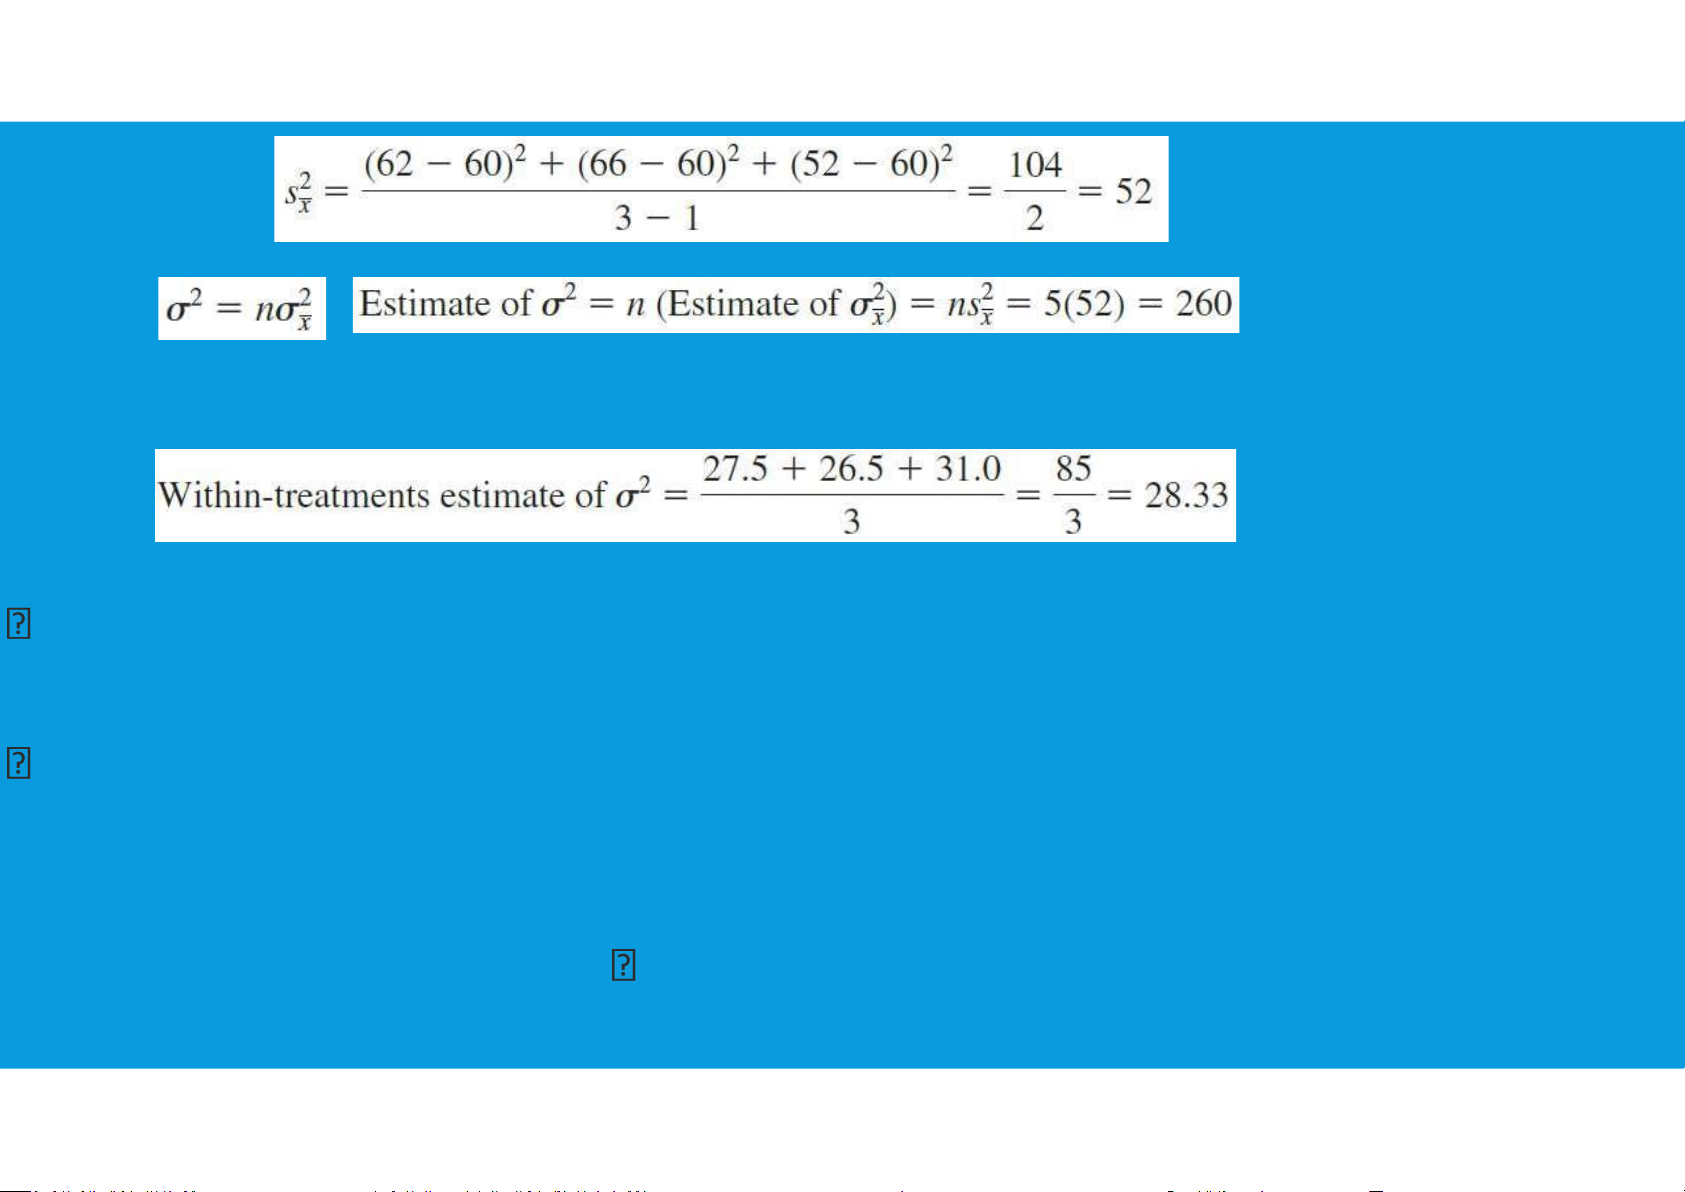
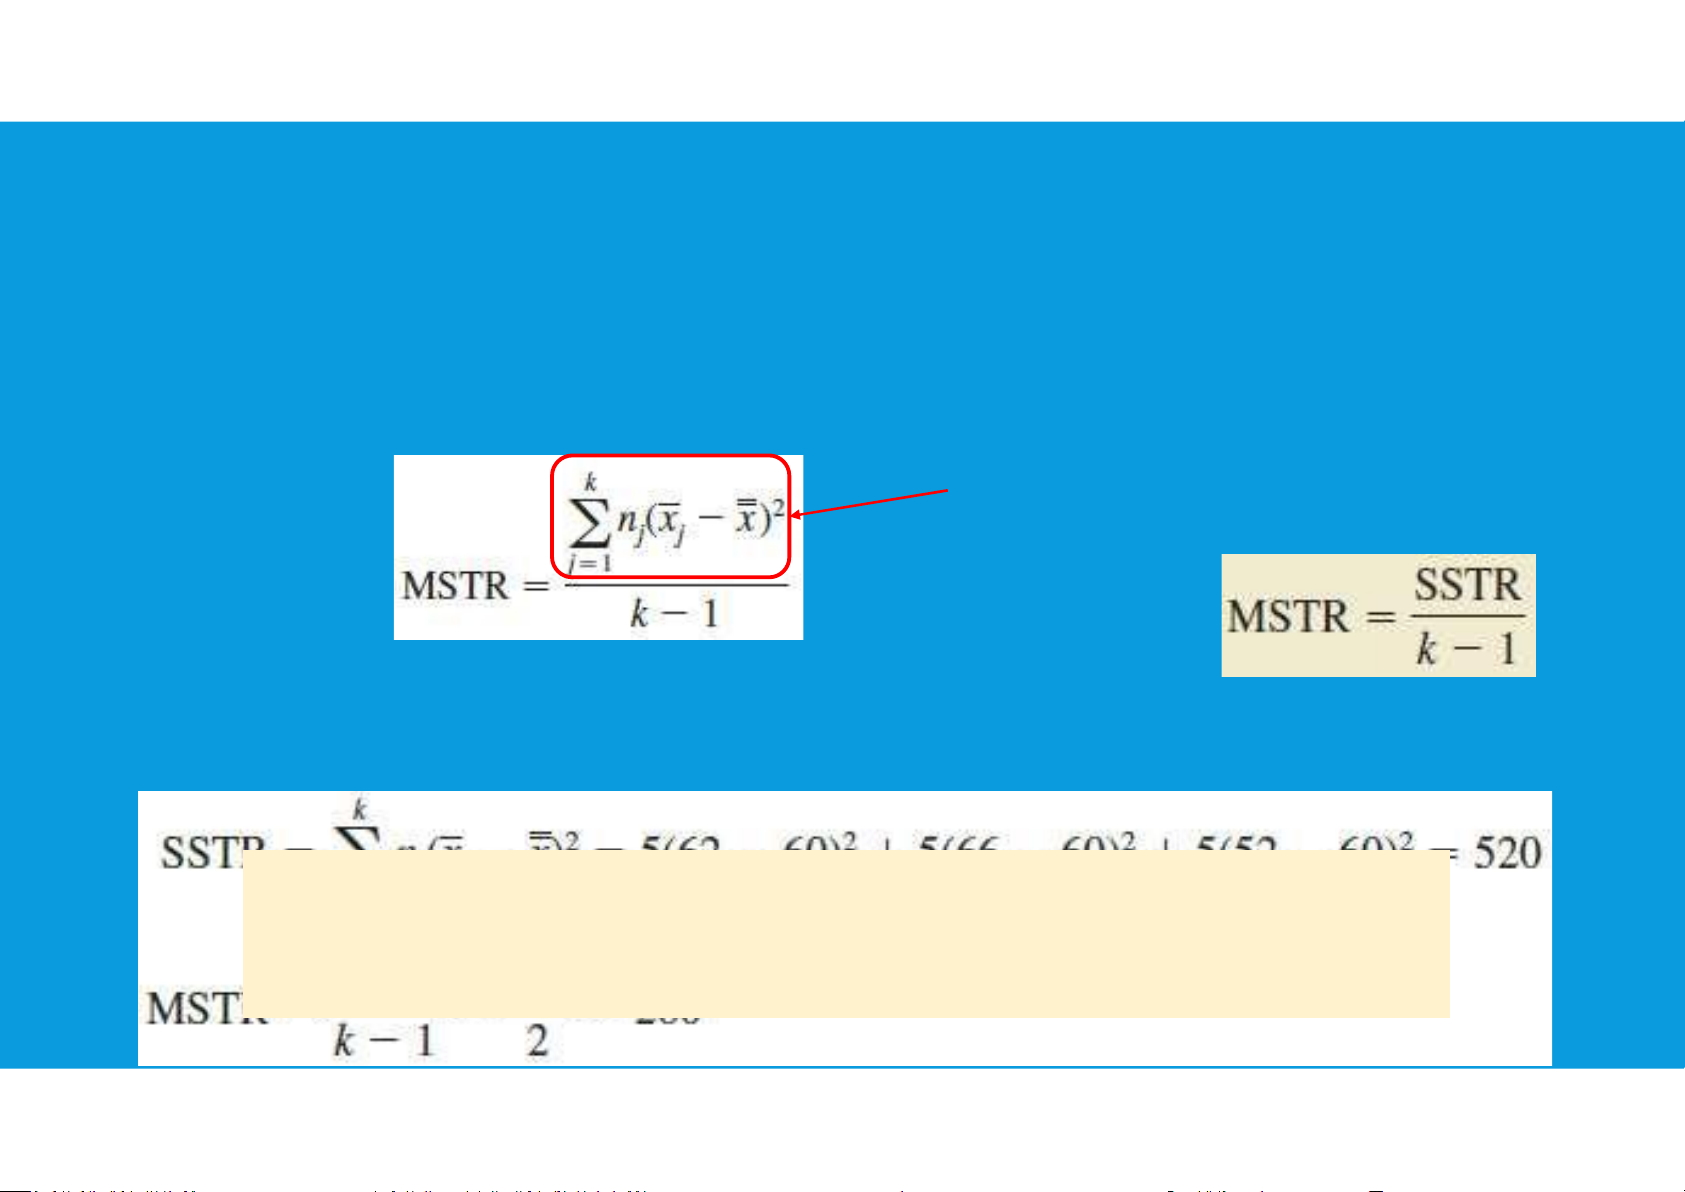
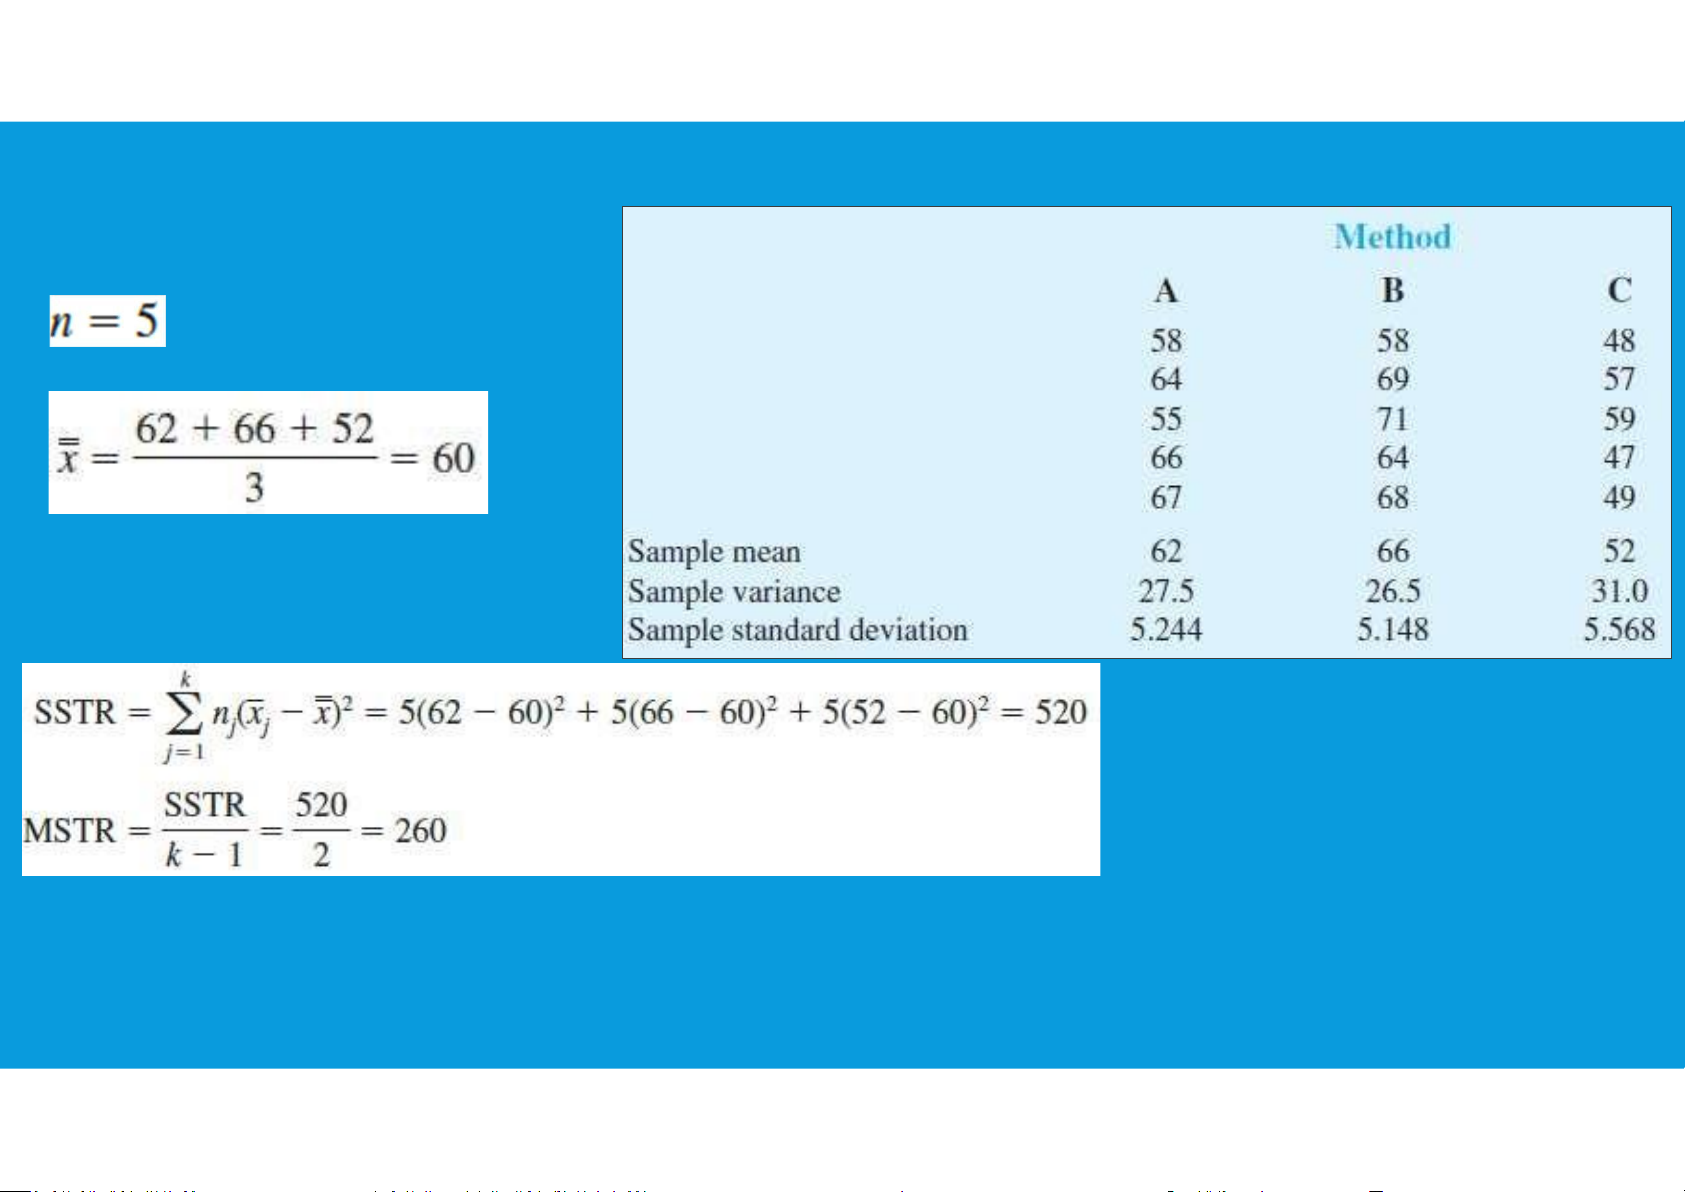
•Between-Treatments Estimate of Population Variance
- In between-treatments, the estimate of σ2 is called the mean square due to
treatments (MSTR):SSTR (sum of squares due to treatments)
If H0 is true, MSTR provides an unbiased estimate of σ2
however, if the means of the k populations are not equal,
MSTR is not an unbiased estimate of σ2 ; in fact, in that case,
MSTR should overestimate σ2 . tttu@hcmiu.edu.vn 8 7.4. A CONCEPTUAL OVERVIEW
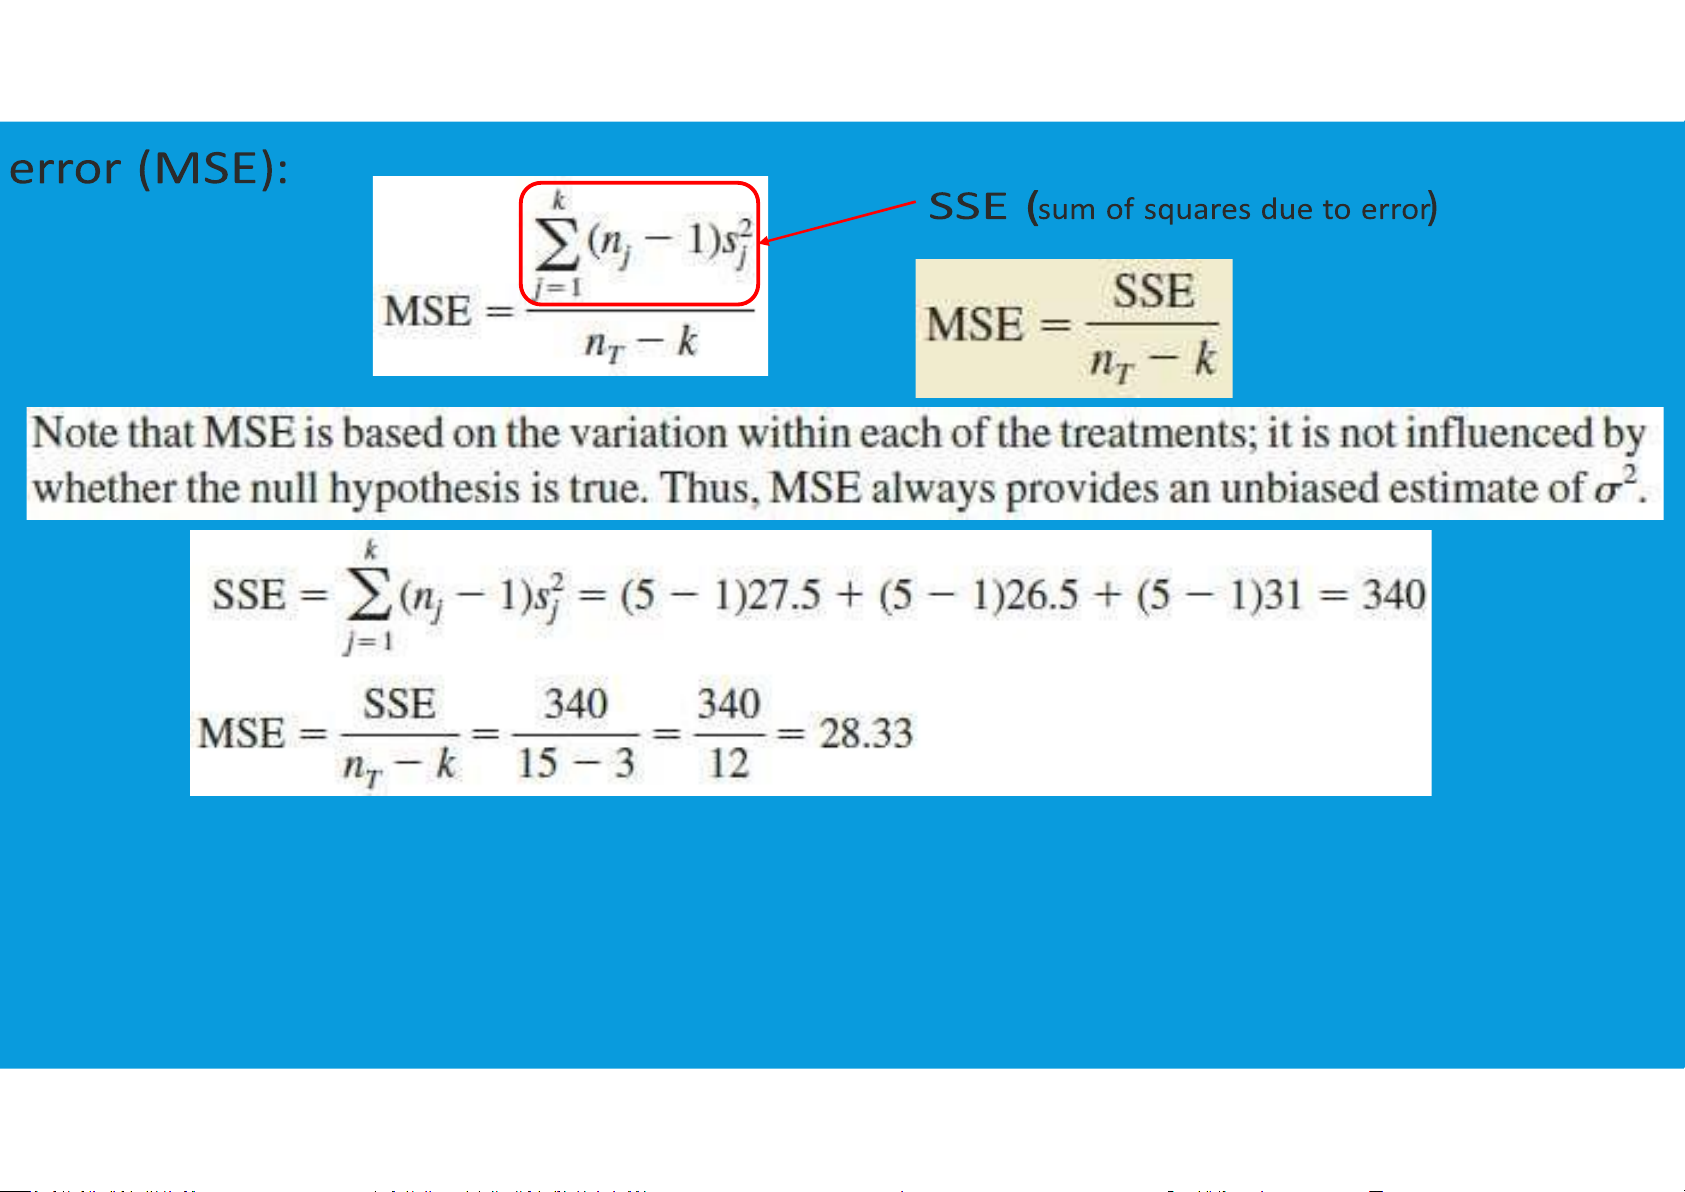
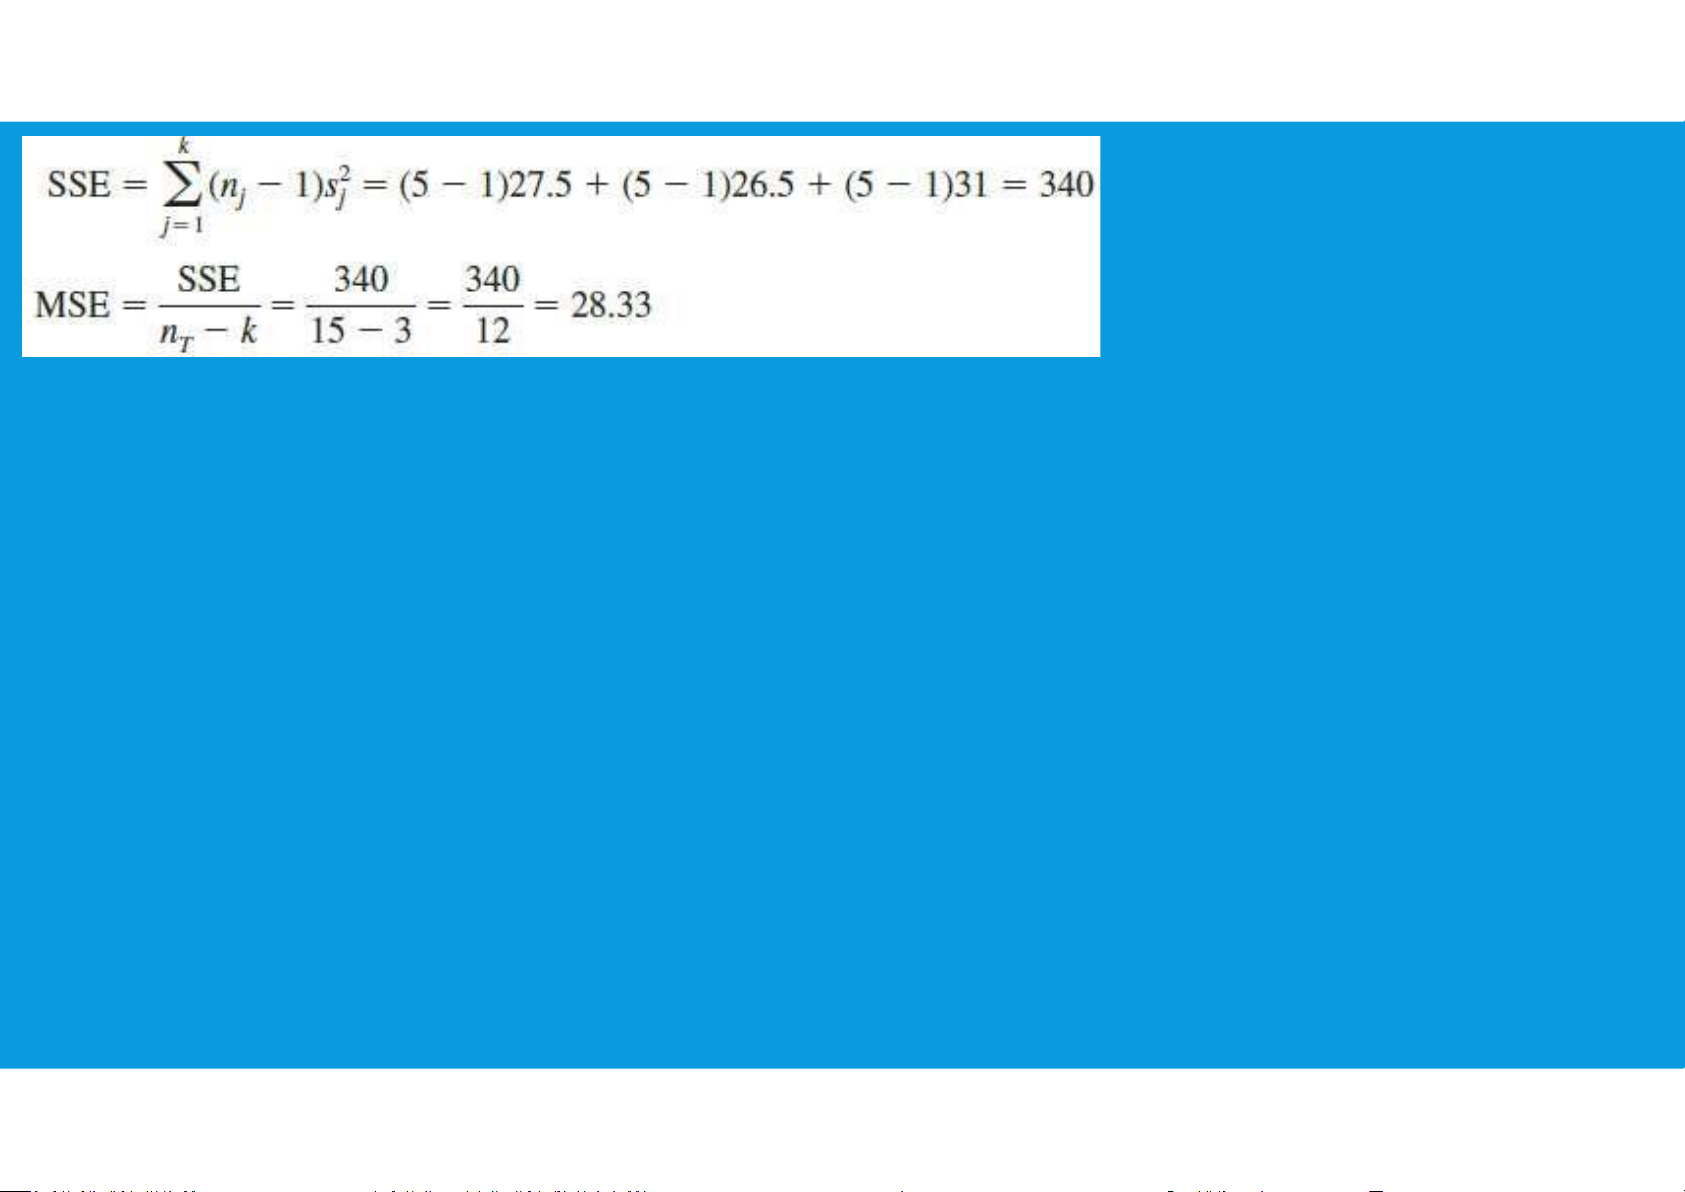
•Within-Treatments Estimate of Population Variance
- In within-treatments, the estimate of σ2 is called the mean square due to tttu@hcmiu.edu.vn 9 7.4. A CONCEPTUAL OVERVIEW
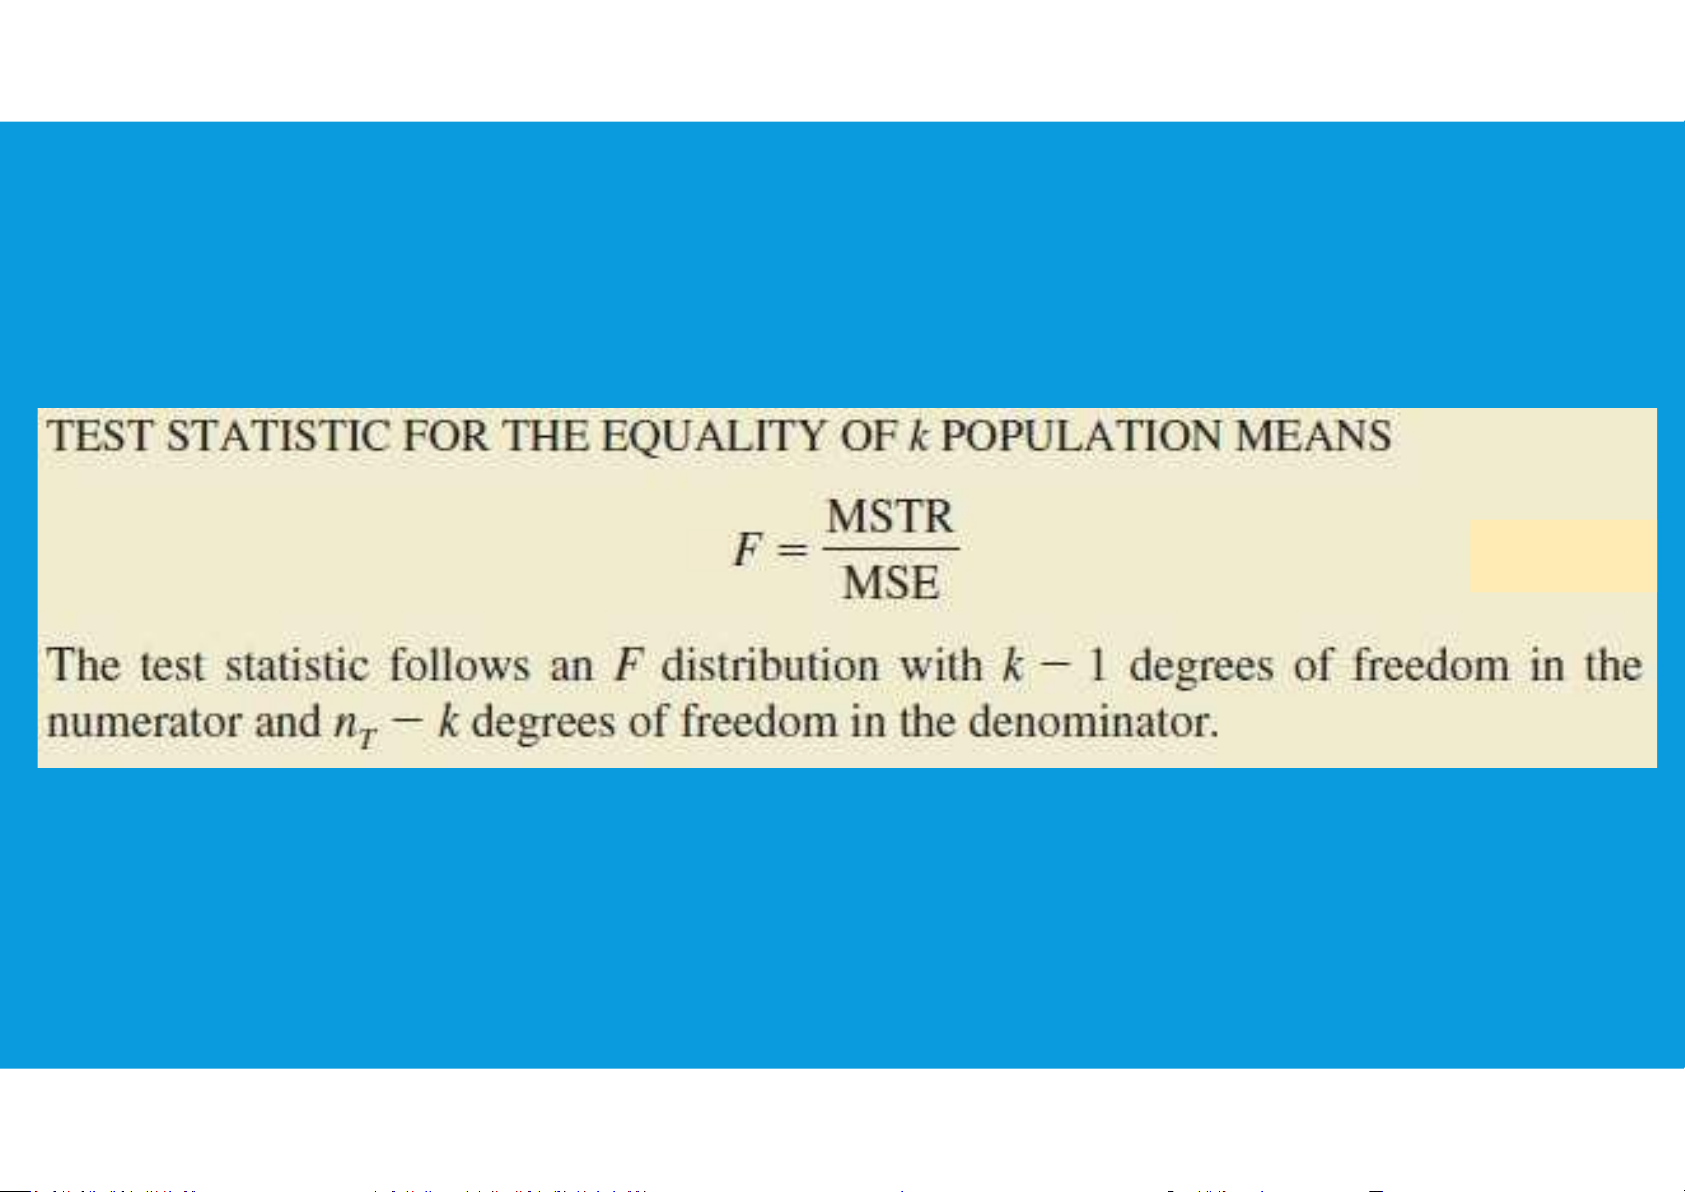
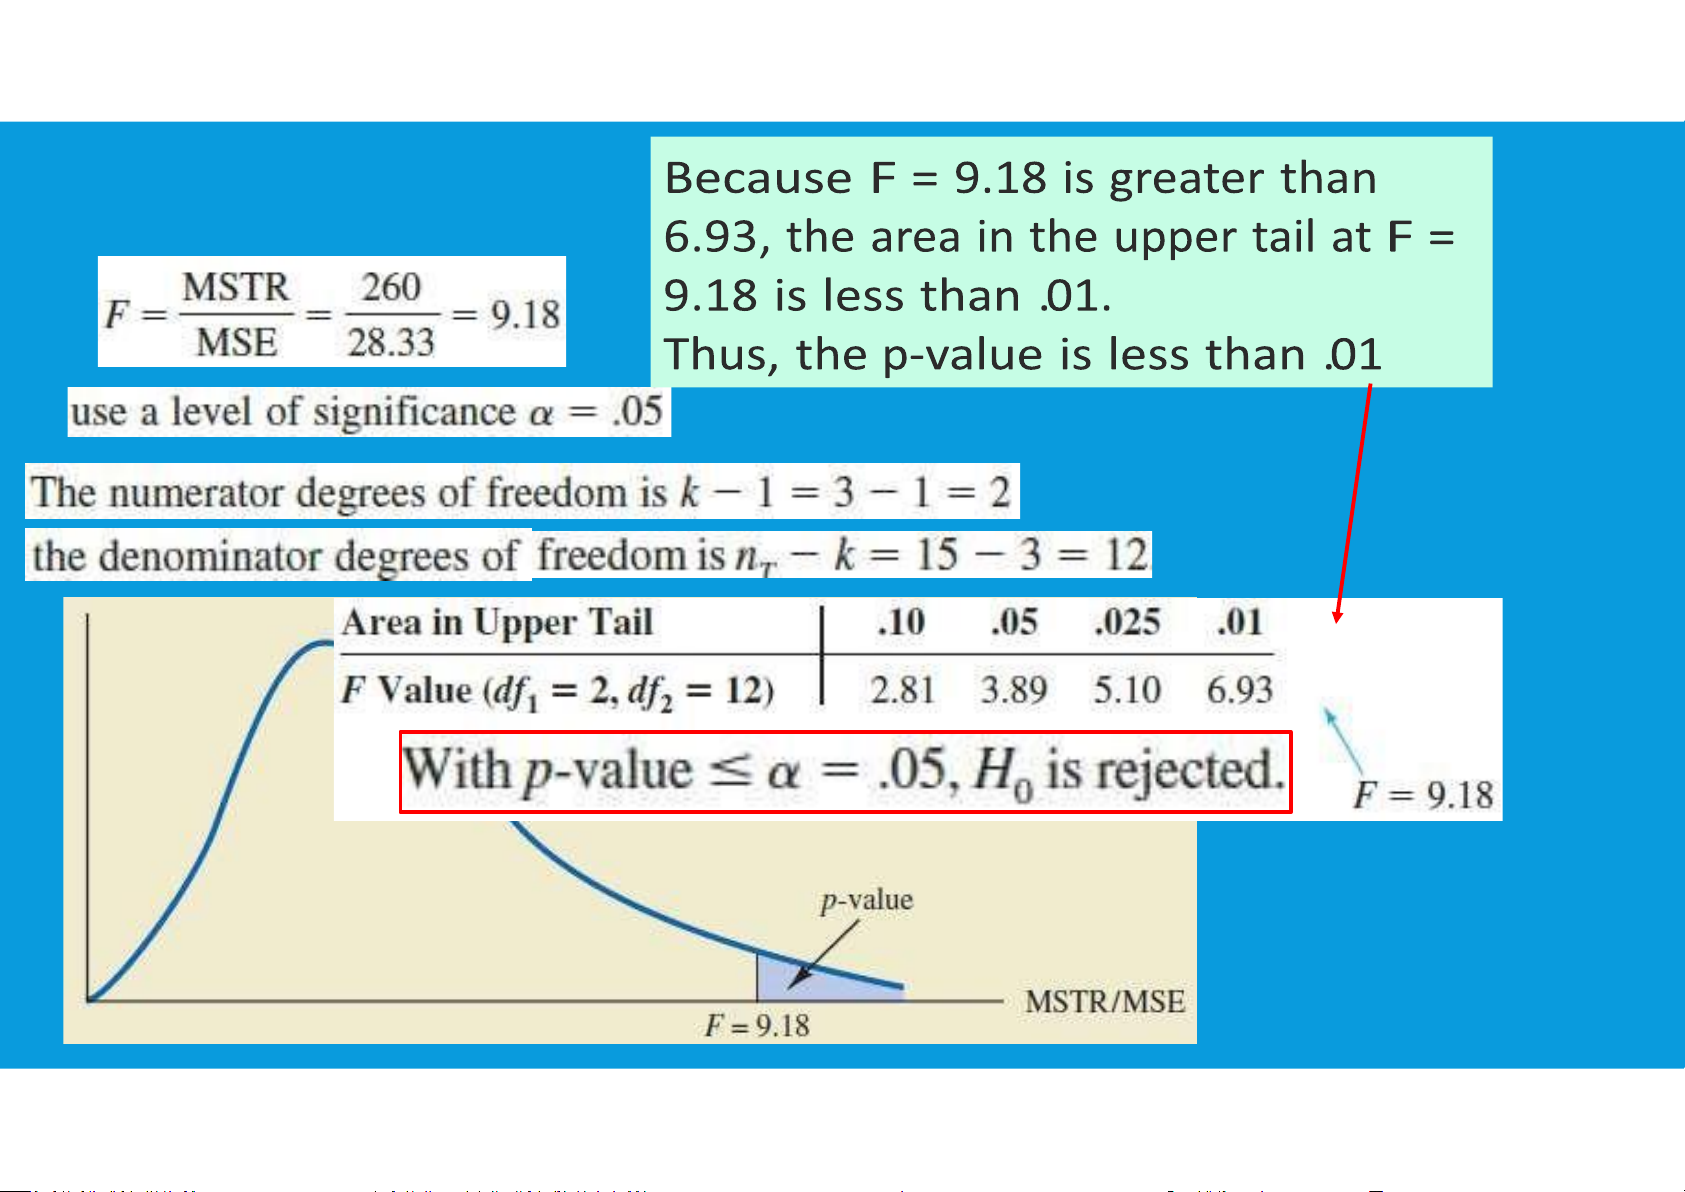
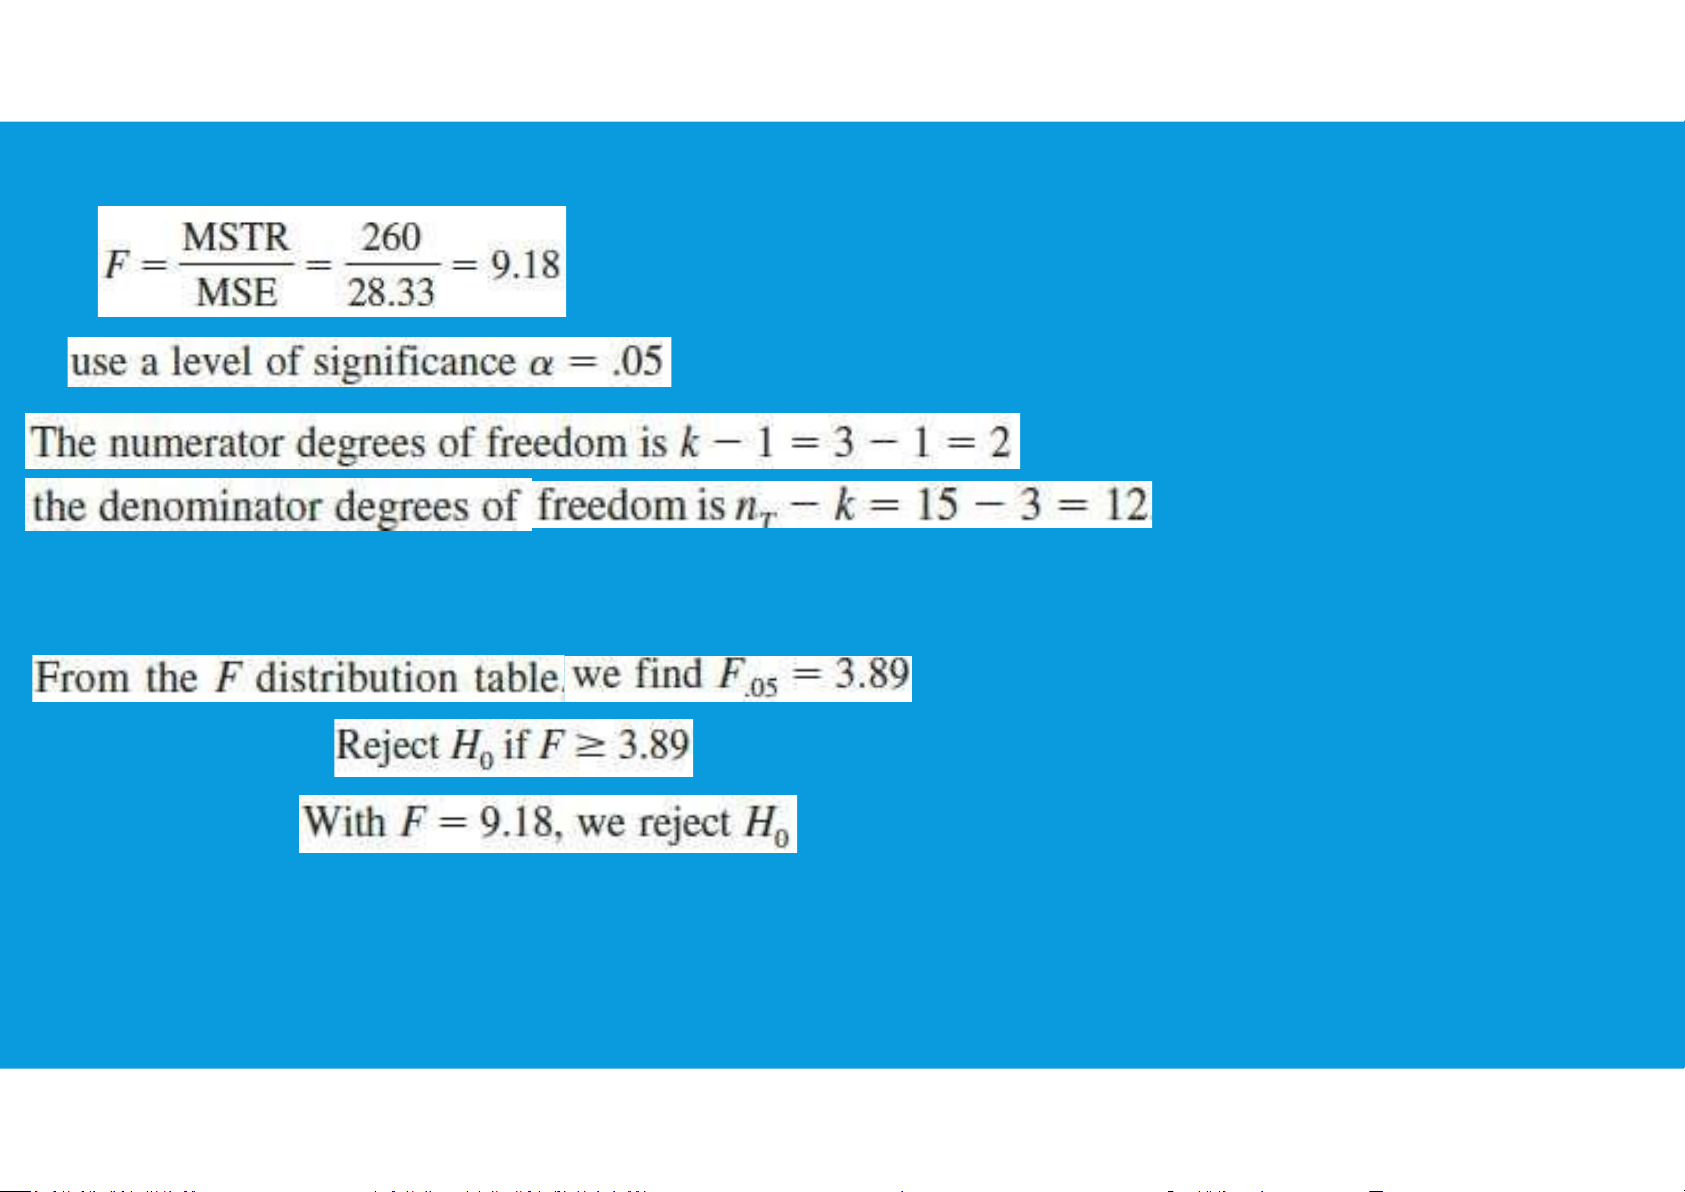
•Comparing the Variance Estimates: The F Test tttu@hcmiu.edu.vn 10
•If the null hypothesis is true, MSTR and MSE provide two independent, unbiased estimates of σ2
•If the null hypothesis is false, the value of MSTR/MSE will be inflated because MSTR overestimates σ2 tttu@hcmiu.edu.vn 11 7.4. A CONCEPTUAL OVERVIEW tttu@hcmiu.edu.vn 12 7.4. A CONCEPTUAL OVERVIEW
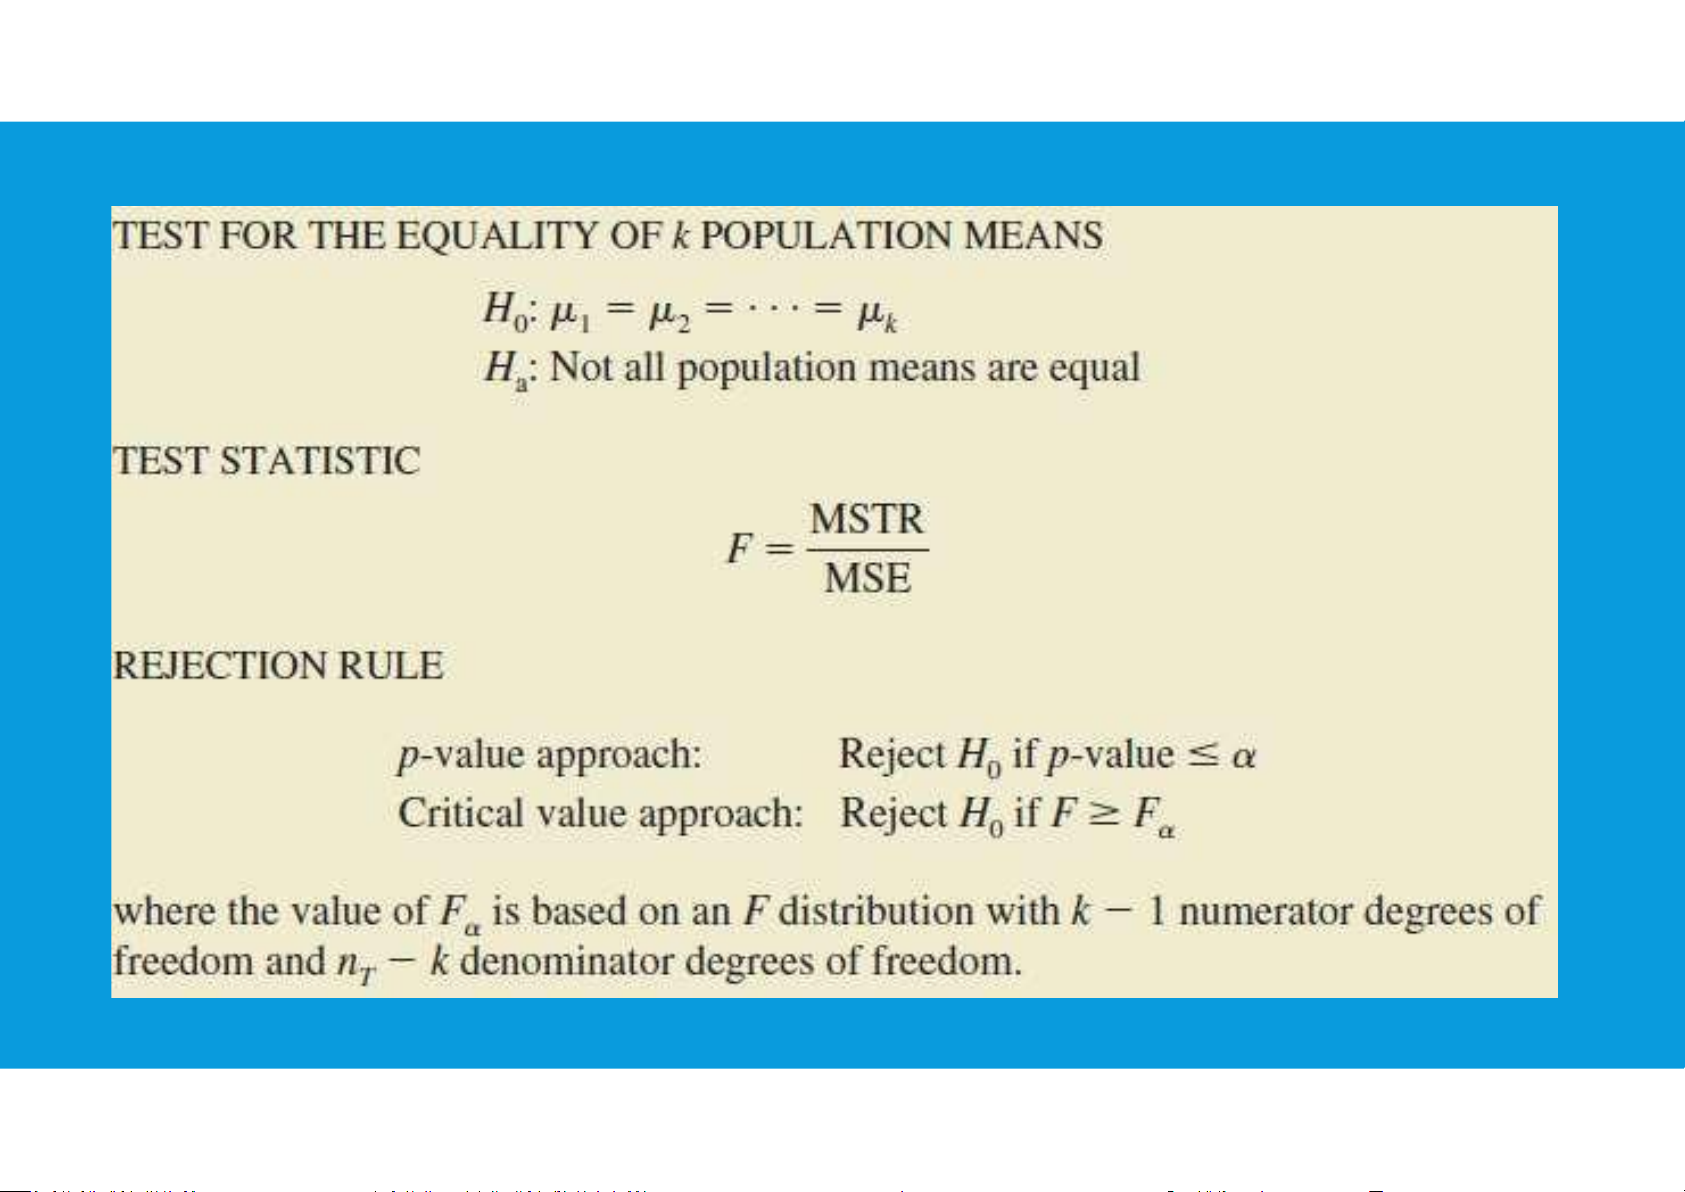
On the other hand, when the null hypothesis is false, then MSTR will tend to be larger than MSE.
So the ratio of MSTR and MSE can be used as an indicator of the equality or
inequality of the r population means.
This ratio (MSTR/MSE) will tend to be near to 1 if the null hypothesis is true, and
greater than 1 if the null hypothesis is false.
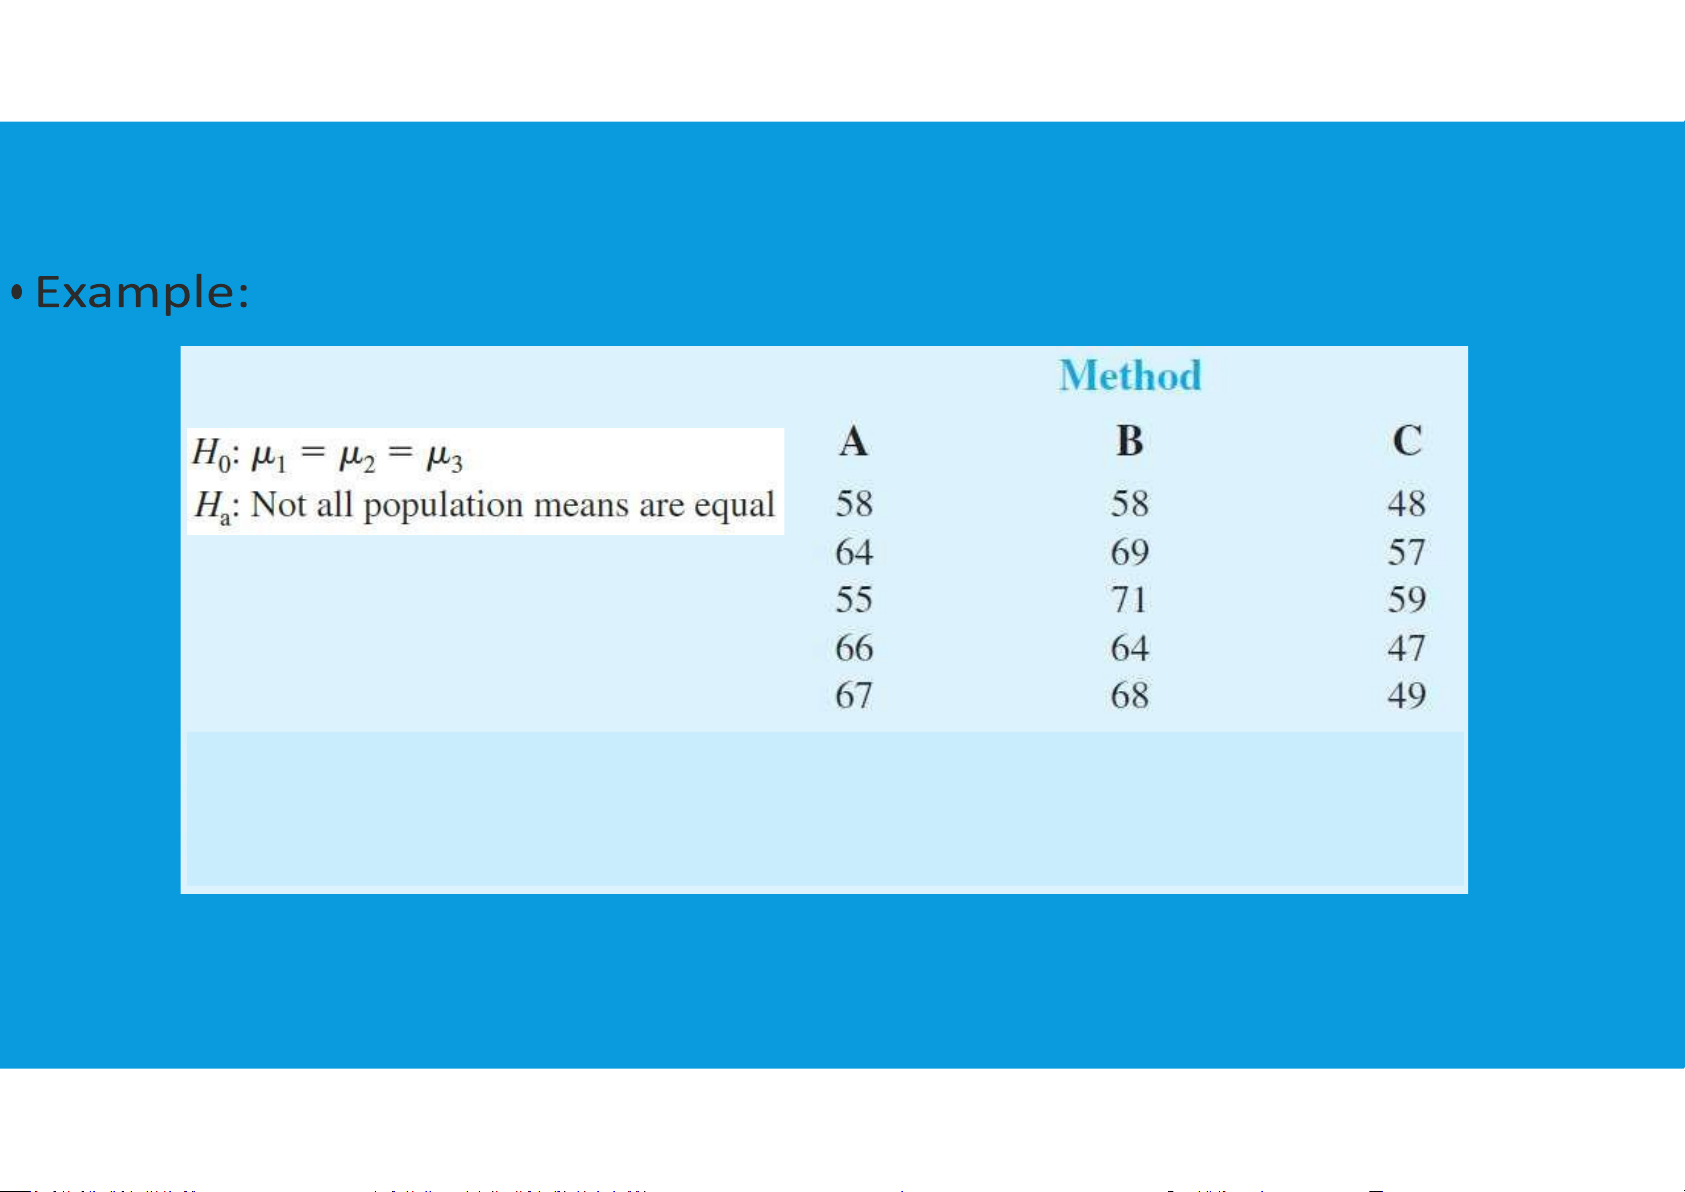
The ANOVA test is a test of whether (MSTR/MSE) is equal to, or greater than, 1. tttu@hcmiu.edu.vn 13 EXAMPLE tttu@hcmiu.edu.vn 14 tttu@hcmiu.edu.vn 15 tttu@hcmi u.edu.vn 16 EXAMPLE tttu@hcmiu.edu.vn 17 REVIEW HOMEWORK – WEEK13 •Group 6 did not submit
•All groups met the requirements, although there are differences in the answers Group Link 1 link 2 link 3 link 5 link 6 7 link tttu@hcmiu.edu.vn 18
Tài liệu liên quan:
-
Data and Statistics | Bài giảng số 1 chương 1 học phần Applied statistics | Trường Đại học Quốc tế, Đại học Quốc gia Thành phố Hồ Chí Minh
266 133 -

Data and Statistics | Bài giảng số 2 chương 1 học phần Applied statistics | Trường Đại học Quốc tế, Đại học Quốc gia Thành phố Hồ Chí Minh
361 181 -

Plotting and Smoothing data | Bài giảng số 3 chương 2 học phần Applied statistics | Trường Đại học Quốc tế, Đại học Quốc gia Thành phố Hồ Chí Minh
203 102 -
Descriptive statistics | Bài giảng số 4 chương 3 học phần Applied statistics | Trường Đại học Quốc tế, Đại học Quốc gia Thành phố Hồ Chí Minh
207 104 -

Descriptive statistics | Bài giảng số 5 chương 3 học phần Applied statistics | Trường Đại học Quốc tế, Đại học Quốc gia Thành phố Hồ Chí Minh
242 121