Bài giảng Xác suất Thống kê: Định nghĩa và Biểu đồ Thống kê môn Xác suất thống kê| Đại học Duy Tân
A variable is a characteristic that changes orvaries over time and/or for different individuals or objects under consideration.Tài liệu giúp bạn tham khảo, ôn tập và đạt kết quả cao. Mời đọc đón xem!
Môn: Xác xuất thống kê (STA 151) 144 tài liệu
Trường: Đại học Duy Tân 2 K tài liệu
Tác giả:


Preview text:
21:05, 10/01/2026
Bài giảng Xác suất Thống kê: Định nghĩa và Biểu đồ Thống kê - Studocu PROBABILITY AND STATISTICS 21:05, 10/01/2026
Bài giảng Xác suất Thống kê: Định nghĩa và Biểu đồ Thống kê - Studocu PROBABILITY AND STATISTICS Lecture 1 Describing Data with Graphs
Some graphic screen captures from Seeing Statistics ®
Some images © 2001-2012 www.arttoday.com 21:05, 10/01/2026
Bài giảng Xác suất Thống kê: Định nghĩa và Biểu đồ Thống kê - Studocu VARIABLES AND DATA
A variable is a characteristic that changes or
varies over time and/or for different individuals or objects under consideration.
Examples: Hair color, white blood cell count, time
to failure of a computer component. 21:05, 10/01/2026
Bài giảng Xác suất Thống kê: Định nghĩa và Biểu đồ Thống kê - Studocu DEFINITIONS
An experimental unit is the individual or object on which a variable is measured.
A measurement results when a variable is actually
measured on an experimental unit.
A set of measurements, called data,can be either a sample or a population. 21:05, 10/01/2026
Bài giảng Xác suất Thống kê: Định nghĩa và Biểu đồ Thống kê - Studocu Example Variable Hair color Experimental unit Person Typical Measurements Brown, black, blonde, etc. 21:05, 10/01/2026
Bài giảng Xác suất Thống kê: Định nghĩa và Biểu đồ Thống kê - Studocu EXAMPLE Variable Time until a light bulb burns out Experimental unit Light bulb Typical Measurements 1500 hours, 1535.5 hours, etc. 21:05, 10/01/2026
Bài giảng Xác suất Thống kê: Định nghĩa và Biểu đồ Thống kê - Studocu HOW MANY VARIABLES HAVE YOU MEASURED?
Univariate data:One variable is measured on a single experimental unit.
Bivariate data:Two variables are measured on a single experimental unit.
Multivariate data:More than two variables are
measured on a single experimental unit. 21:05, 10/01/2026
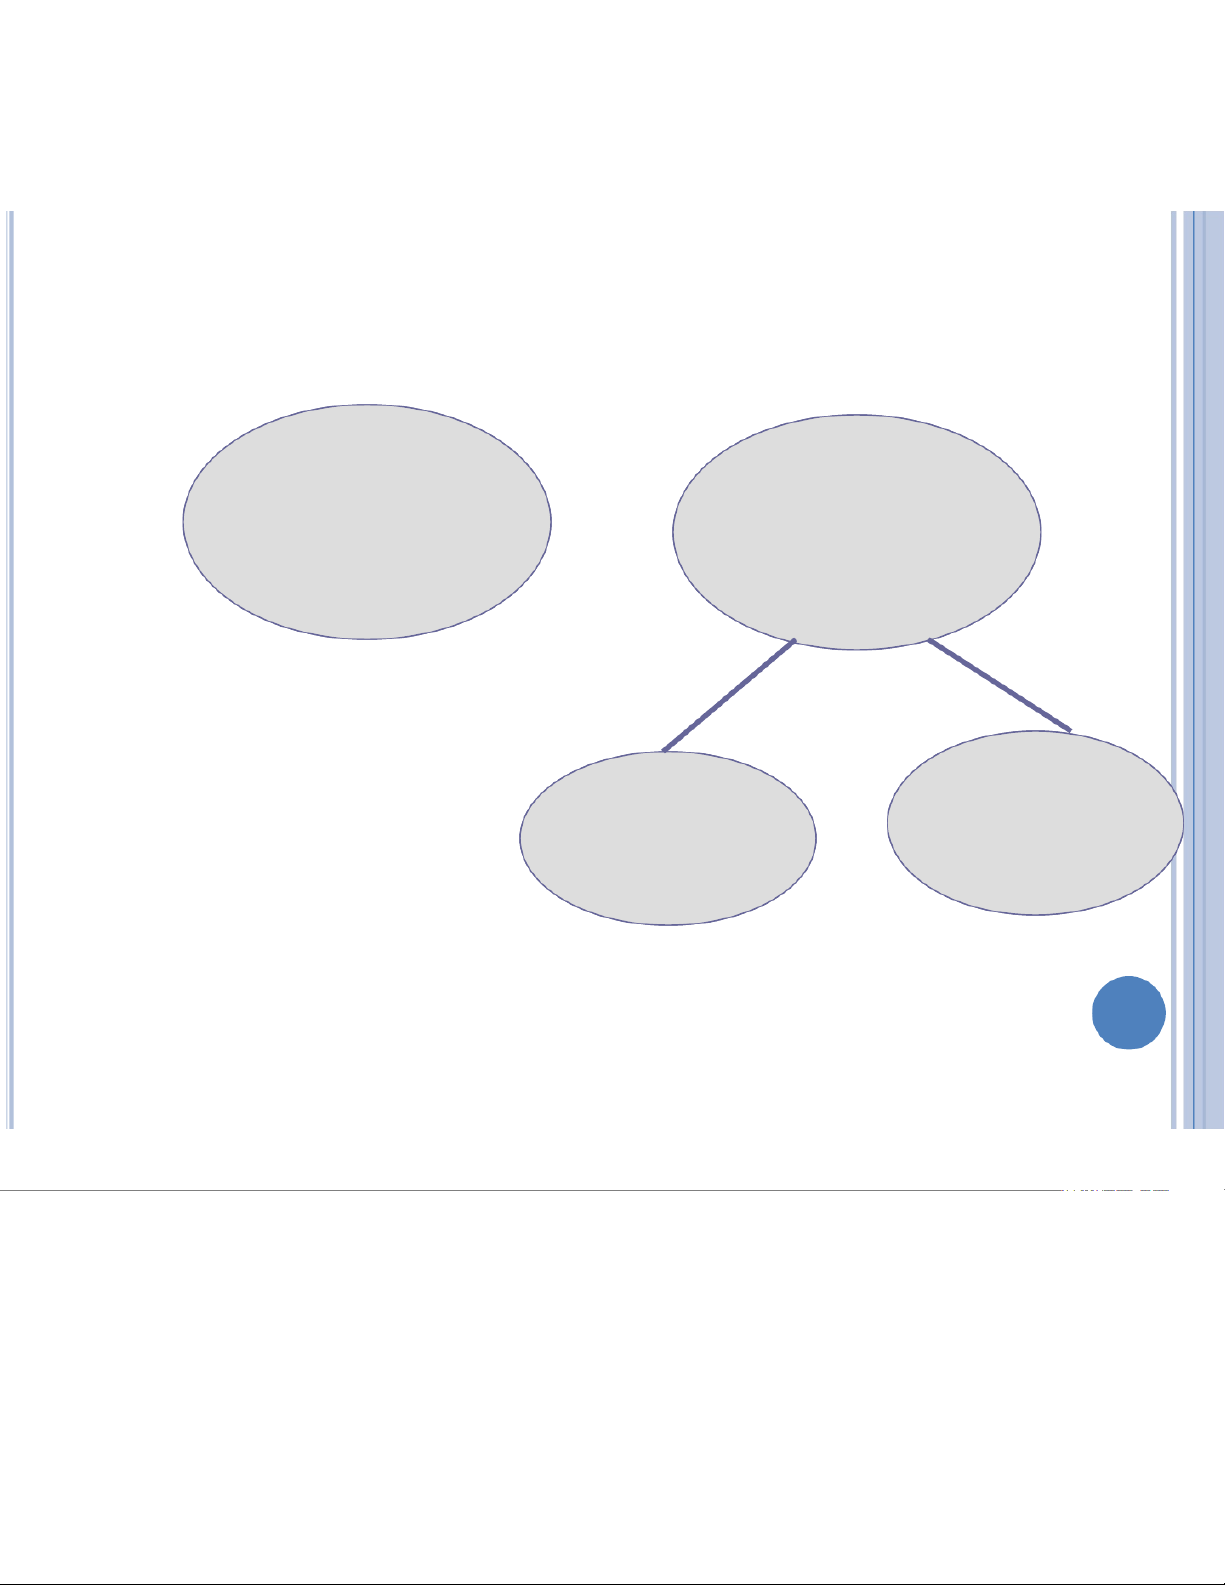
Bài giảng Xác suất Thống kê: Định nghĩa và Biểu đồ Thống kê - Studocu TYPES OF VARIABLES Qualitative Quantitative Discrete Continuous 21:05, 10/01/2026
Bài giảng Xác suất Thống kê: Định nghĩa và Biểu đồ Thống kê - Studocu TYPES OF VARIABLES
•Qualitative variables measure a quality or
characteristic on each experimental unit. •Examples:
•Hair color (black, brown, blonde…)
•Make of car (Dodge, Honda, Ford…) •Gender (male, female)
•State of birth (California, Arizona,….) 21:05, 10/01/2026
Bài giảng Xác suất Thống kê: Định nghĩa và Biểu đồ Thống kê - Studocu TYPES OF VARIABLES
•Quantitative variables measure a
numerical quantity on each experimental unit.
Discrete if it can assume only a finite or countable number of values.
Continuous if it can assume the
infinitely many values corresponding to the points on a line interval. 21:05, 10/01/2026
Bài giảng Xác suất Thống kê: Định nghĩa và Biểu đồ Thống kê - Studocu EXAMPLES
For each orange tree in a grove, the
number of oranges is measured. Quantitative discrete
For a particular day, the number of
cars entering a college campus is measured. Quantitative discrete
Time until a light bulb burns out Quantitative continuous 21:05, 10/01/2026
Bài giảng Xác suất Thống kê: Định nghĩa và Biểu đồ Thống kê - Studocu GRAPHING QUALITATIVE VARIABLES
Use a data distribution to describe:
What values of the variable have been measured
How often each value has occurred
“How often” can be measured 3 ways: Frequency
Relative frequency = Frequency/n
Percent = 100 x Relative frequency 21:05, 10/01/2026
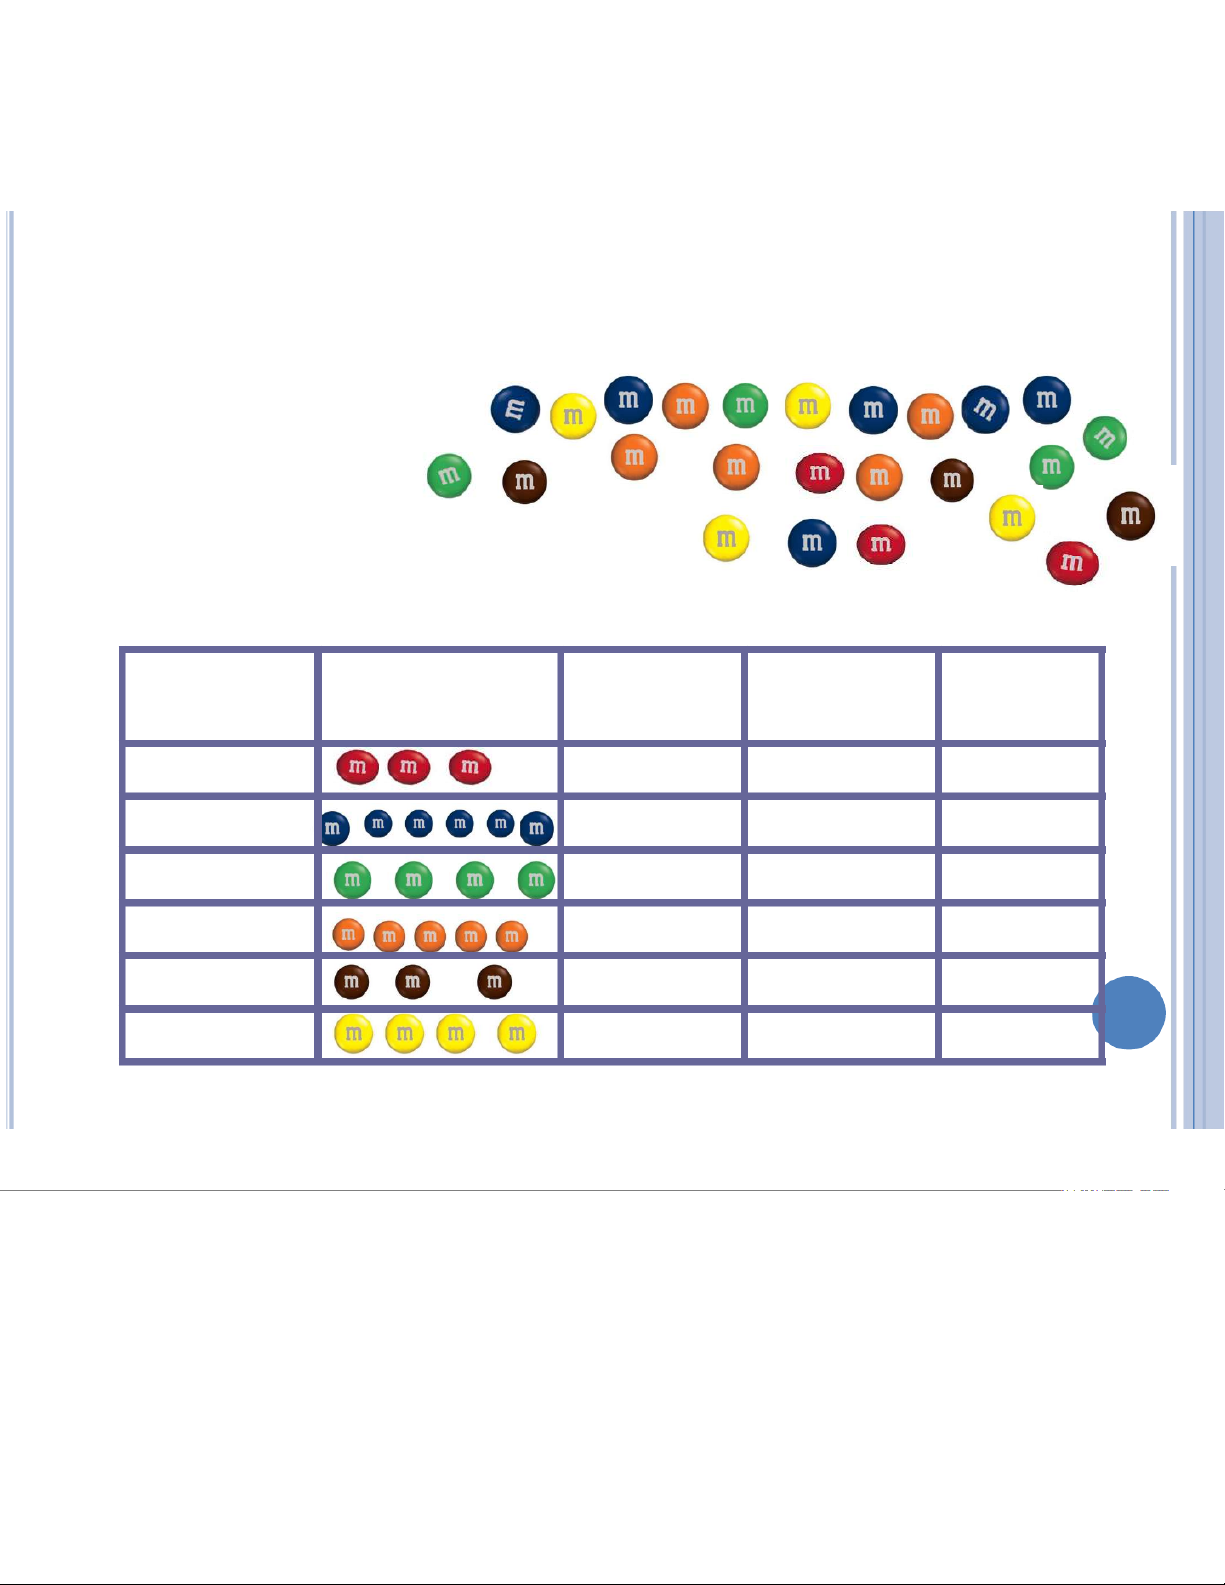
Bài giảng Xác suất Thống kê: Định nghĩa và Biểu đồ Thống kê - Studocu EXAMPLE
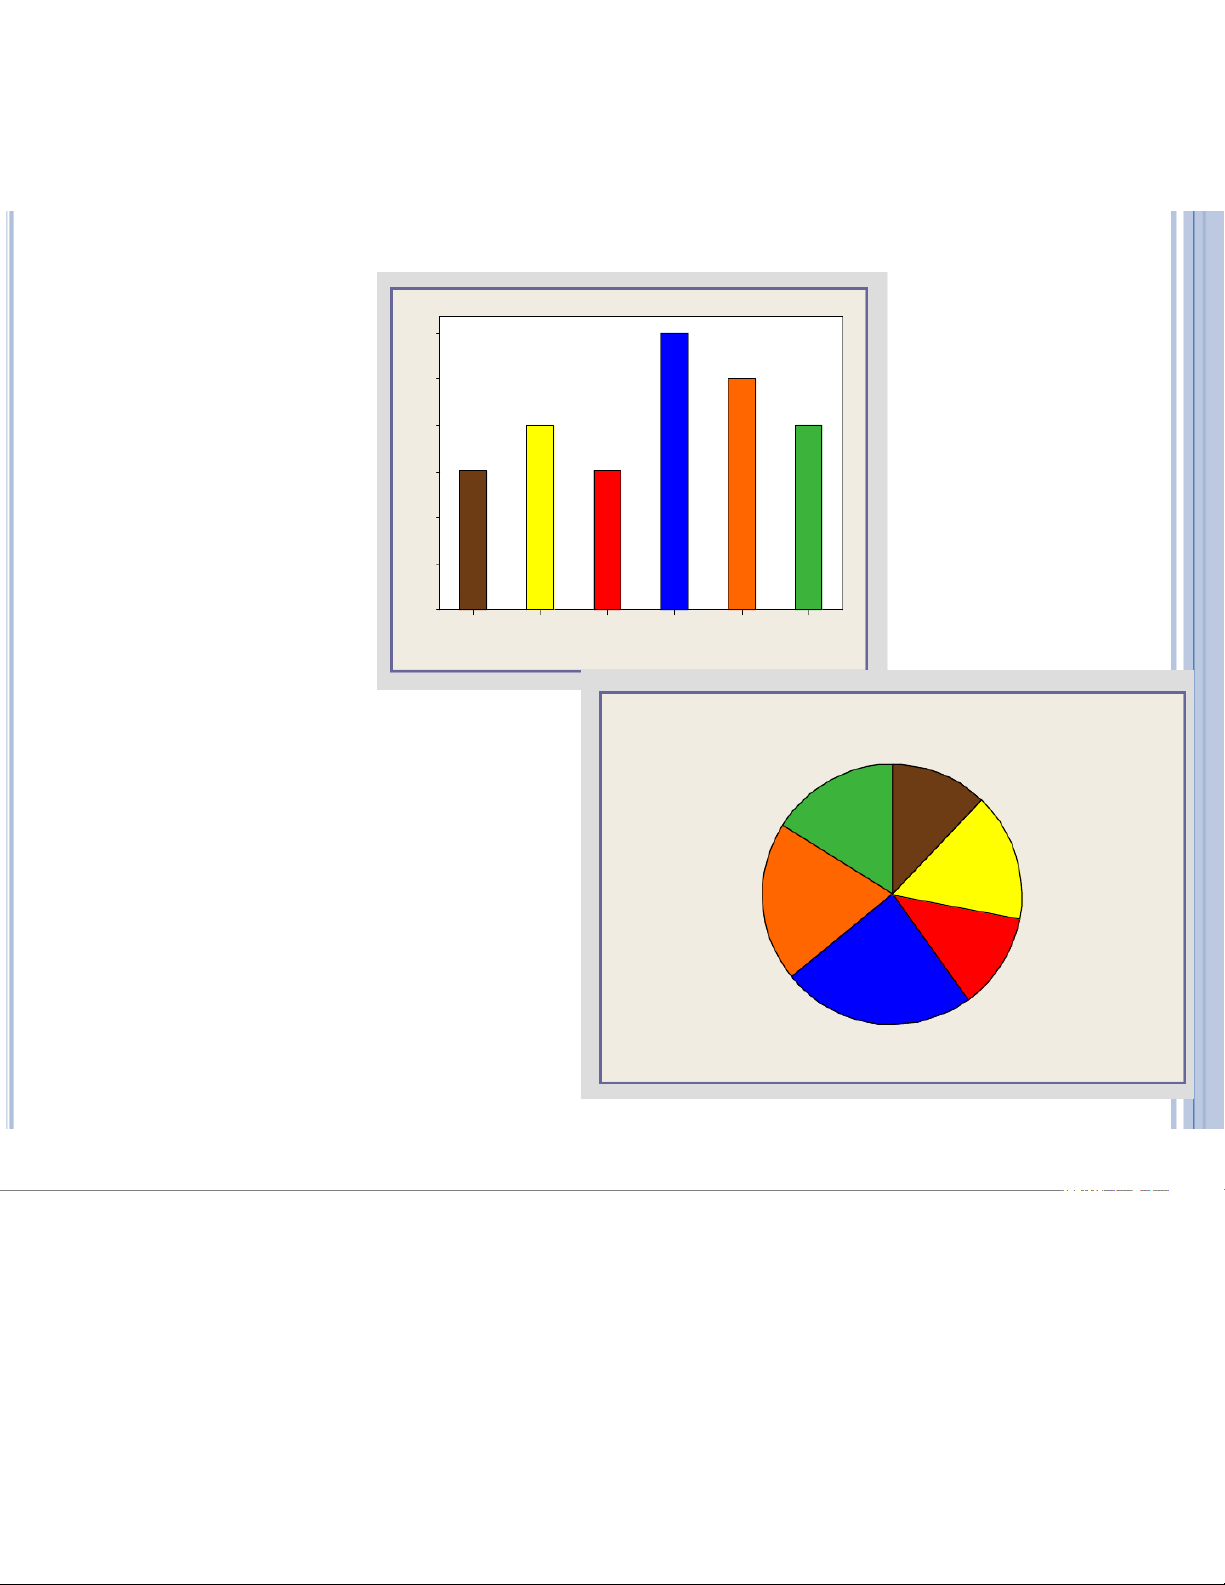
A bag of M&Ms contains 25 candies: Raw Data: Statistical Table: Color Tally Frequency Relative Percent Frequency Red 3 3/25 = .12 12% Blue 6 6/25 = .24 24% Green 4 4/25 = .16 16% Orange 5 5/25 = .20 20% Brown 3 3/25 = .12 12% Yellow 4 4/25 = .16 16% 21:05, 10/01/2026
Bài giảng Xác suất Thống kê: Định nghĩa và Biểu đồ Thống kê - Studocu 6 GRAPHS 5 4 3 Bar Chart Frequency 2 1 0 Brown Yelow Red Blue Orange Green Color Green Brown 16.0% 12.0% Yelow Pie Chart 16.0% Orange 20.0% Red 12.0% Blue 24.0% 21:05, 10/01/2026
Bài giảng Xác suất Thống kê: Định nghĩa và Biểu đồ Thống kê - Studocu GRAPHING QUANTITATIVE VARIABLES
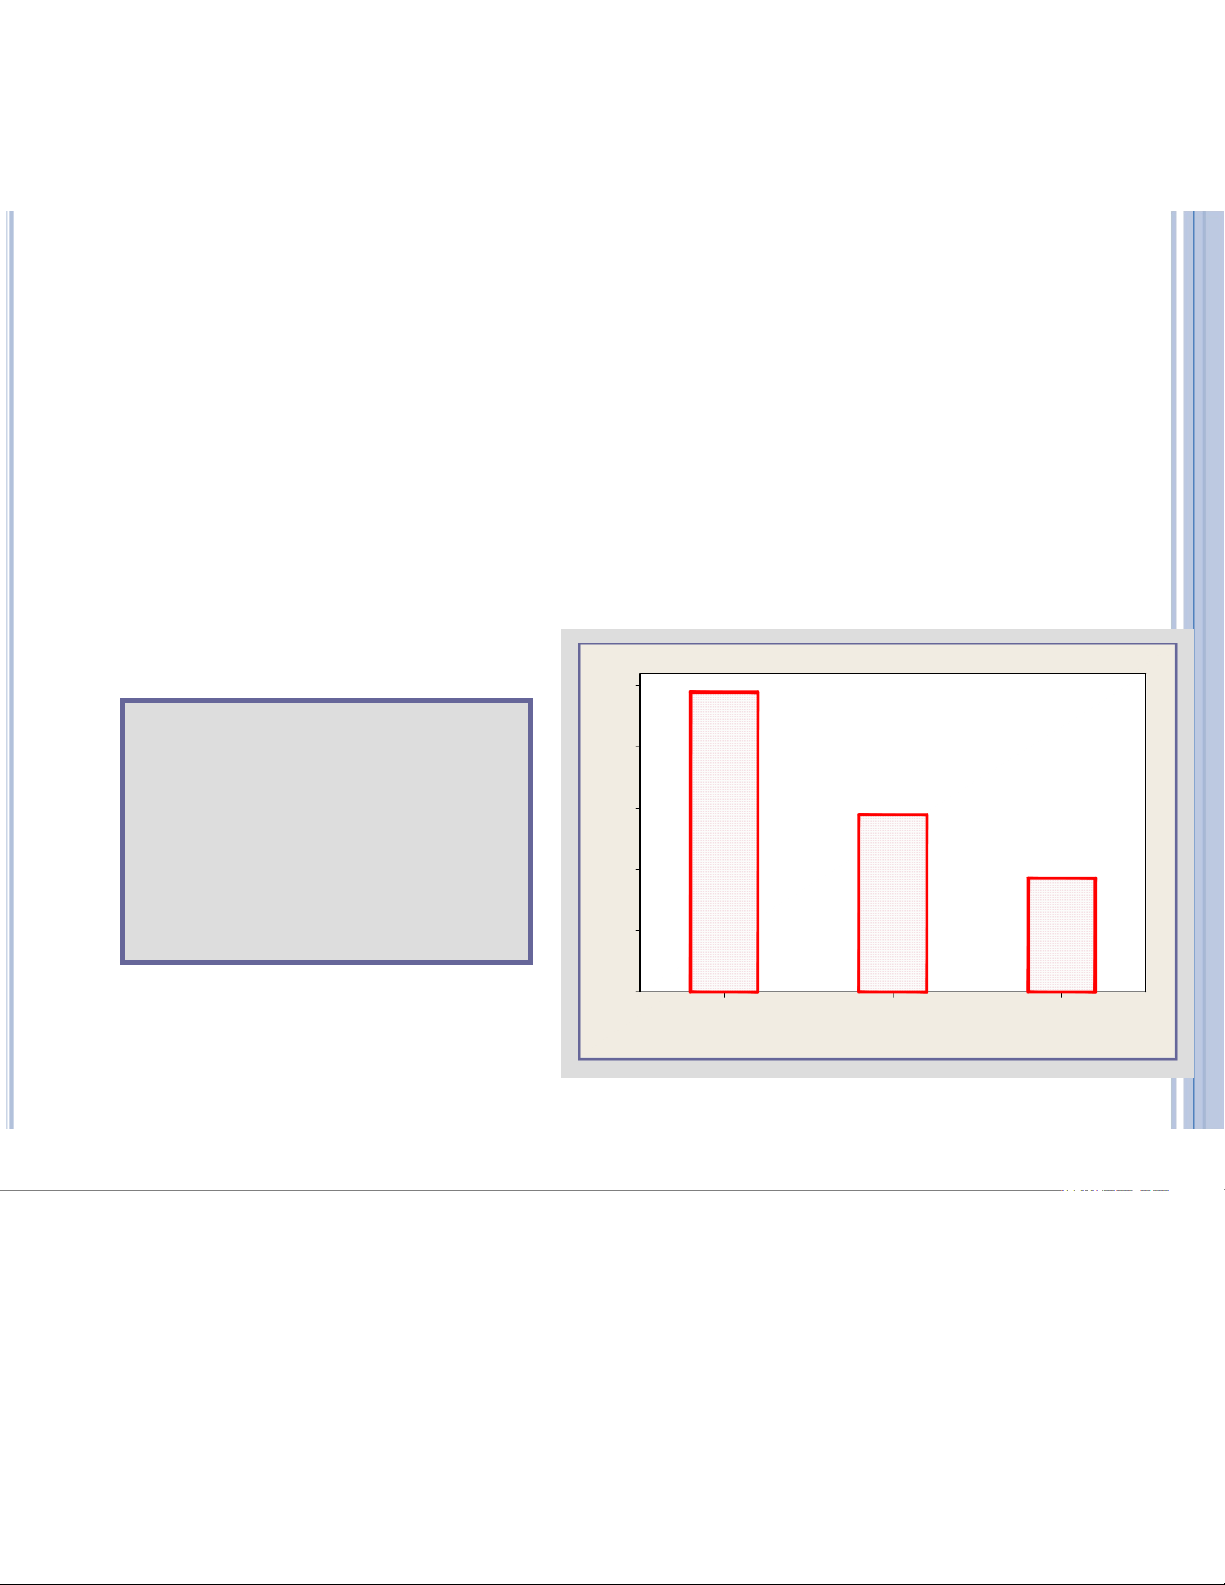
A single quantitative variable measured for
different population segments or for different
categories of classification can be graphed using a pie or bar chart. 5 A Big Mac hamburger 4 costs $4.90 in 3 Switzerland, $2.90 in the U.S. and $1.86 in 2 Cost of a Big Mac ($) South Africa. 1 0 Switzerland U.S. South Africa Country 21:05, 10/01/2026
Bài giảng Xác suất Thống kê: Định nghĩa và Biểu đồ Thống kê - Studocu
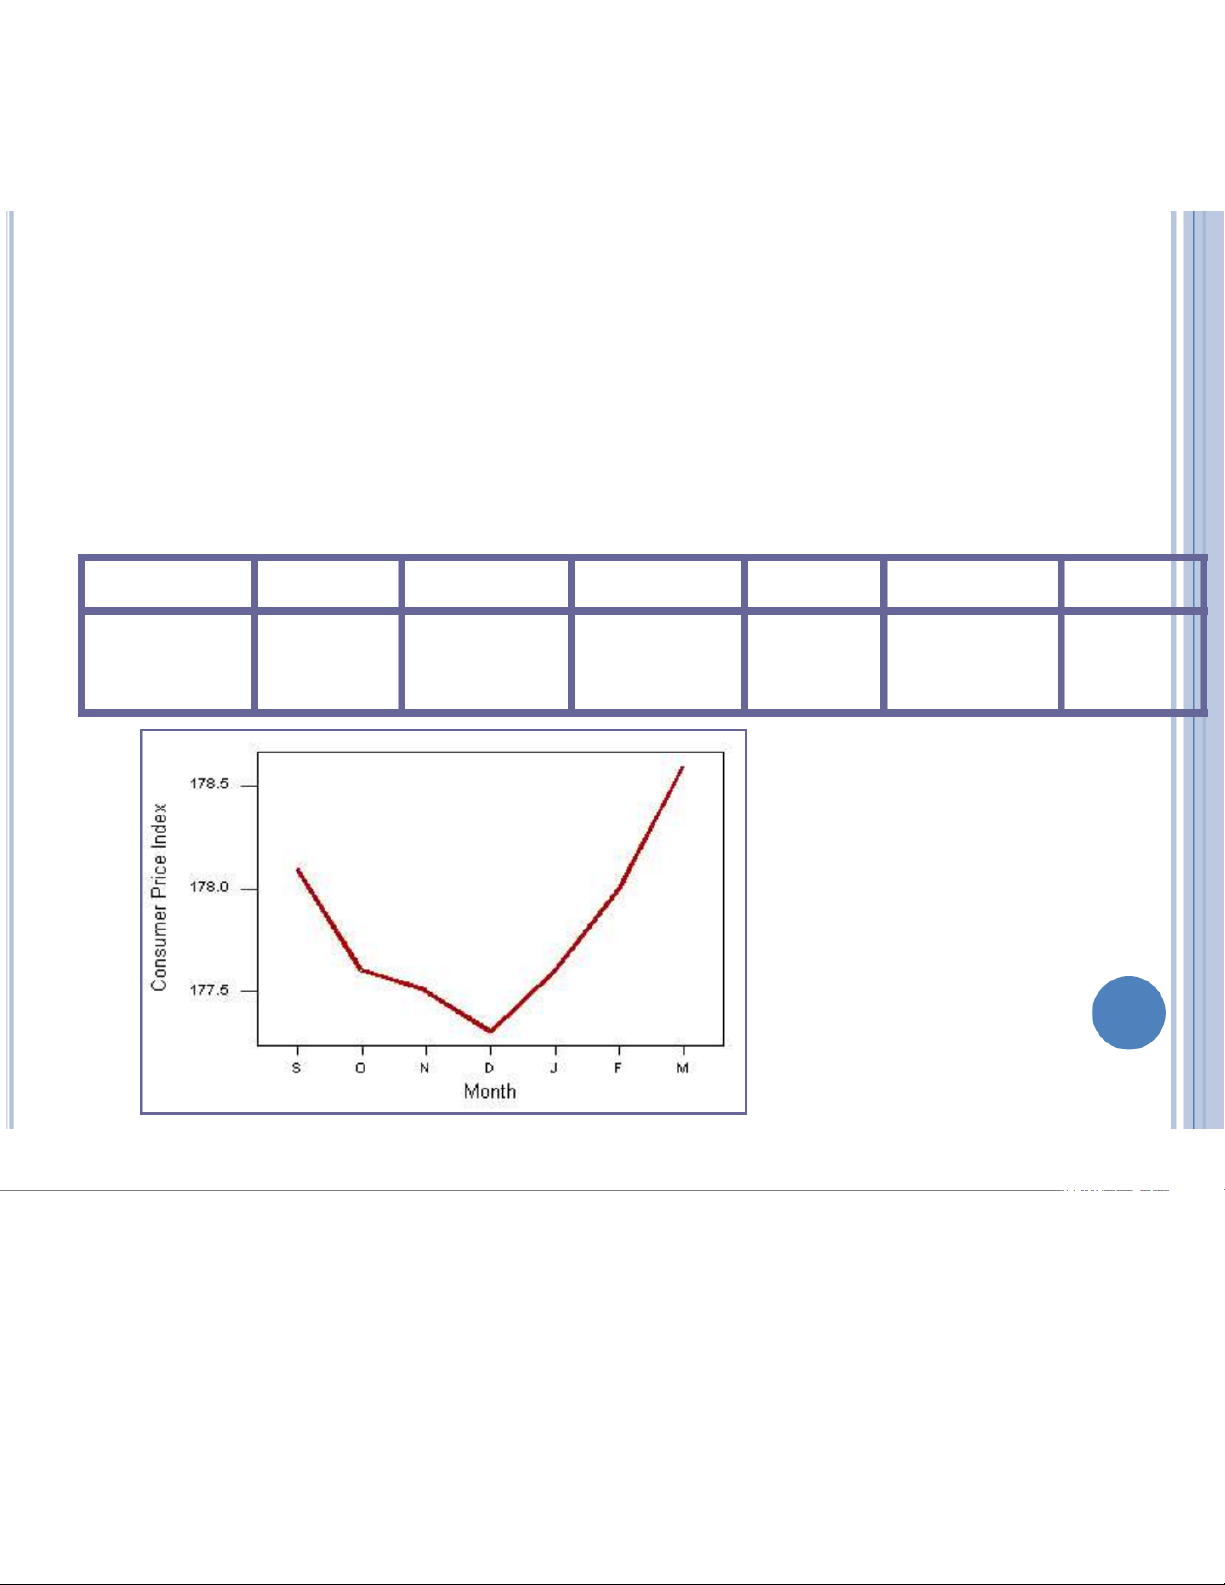
• A single quantitative variable measured
over time is called a time series. It can be
graphed using a line or bar chart.
CPI: All Urban Consumers-Seasonally Adjusted Sept Oct Nov Dec Jan Feb Mar 178.10 177.60 177.50 177.30 177.60 178.00 178.60 BUREAU OF LABOR STATISTICS 21:05, 10/01/2026
Bài giảng Xác suất Thống kê: Định nghĩa và Biểu đồ Thống kê - Studocu DOTPLOTS
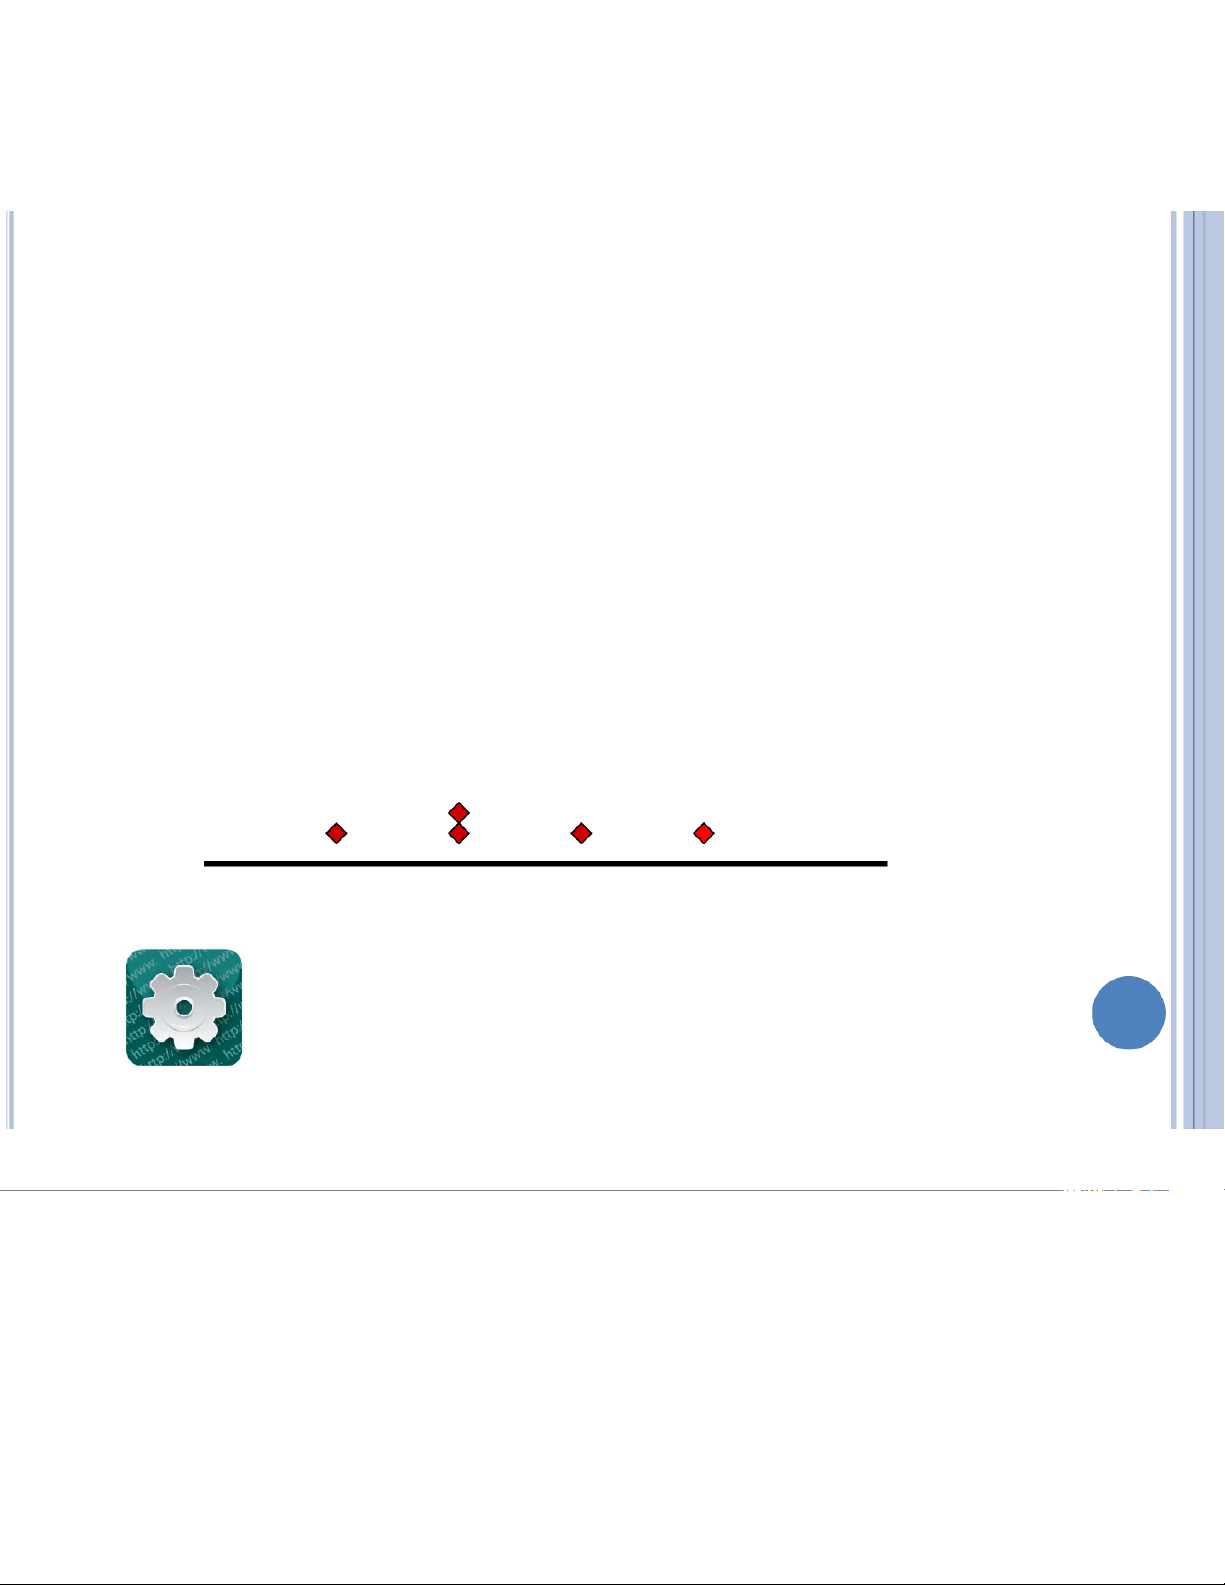
The simplest graph for quantitative data
Plots the measurements as points on a
horizontal axis, stacking the points that duplicate existing points.
Example: The set 4, 5, 5, 7, 6 4567 21:05, 10/01/2026
Bài giảng Xác suất Thống kê: Định nghĩa và Biểu đồ Thống kê - Studocu STEM AND LEAF PLOTS
A simple graph for quantitative data
Uses the actual numerical values of each data point.
–Divide each measurement into two parts: the stem and the leaf.
–List the stems in a column, with a vertical line to their right.
–For each measurement, record the leaf portion in the same row as its matching stem.
–Order the leaves from lowest to highest in each stem.
–Provide a key to your coding. 21:05, 10/01/2026
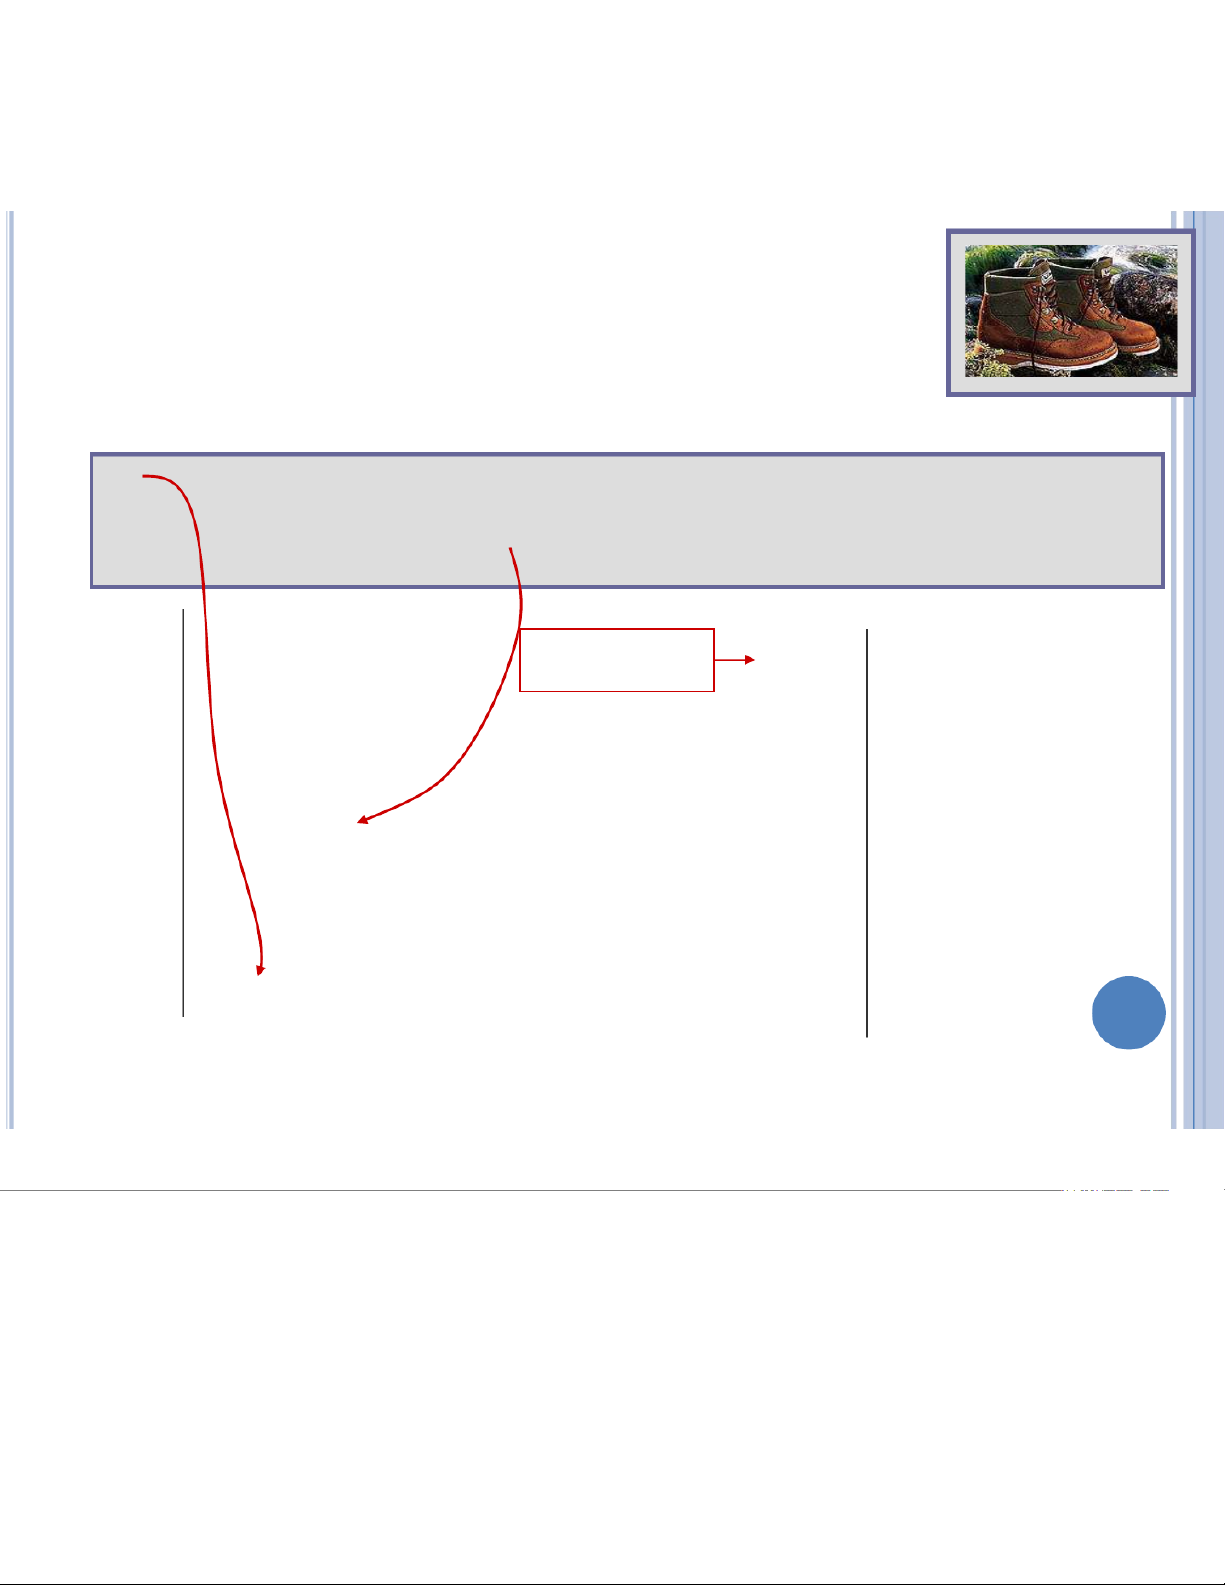
Bài giảng Xác suất Thống kê: Định nghĩa và Biểu đồ Thống kê - Studocu EXAMPLE
The prices ($) of 18 brands of walking shoes: 90 70 70 70 75 70 65 68 60 74 70 95 75 70 68 65 40 65 4 0 4 0 Reorder 5 5 6 5 8 0 8 5 5 6 0 5 5 5 8 8 7 0 0 0 5 0 4 0 5 0 7 0 0 0 0 0 0 4 5 5 8 8 9 0 5 9 0 5 21:05, 10/01/2026
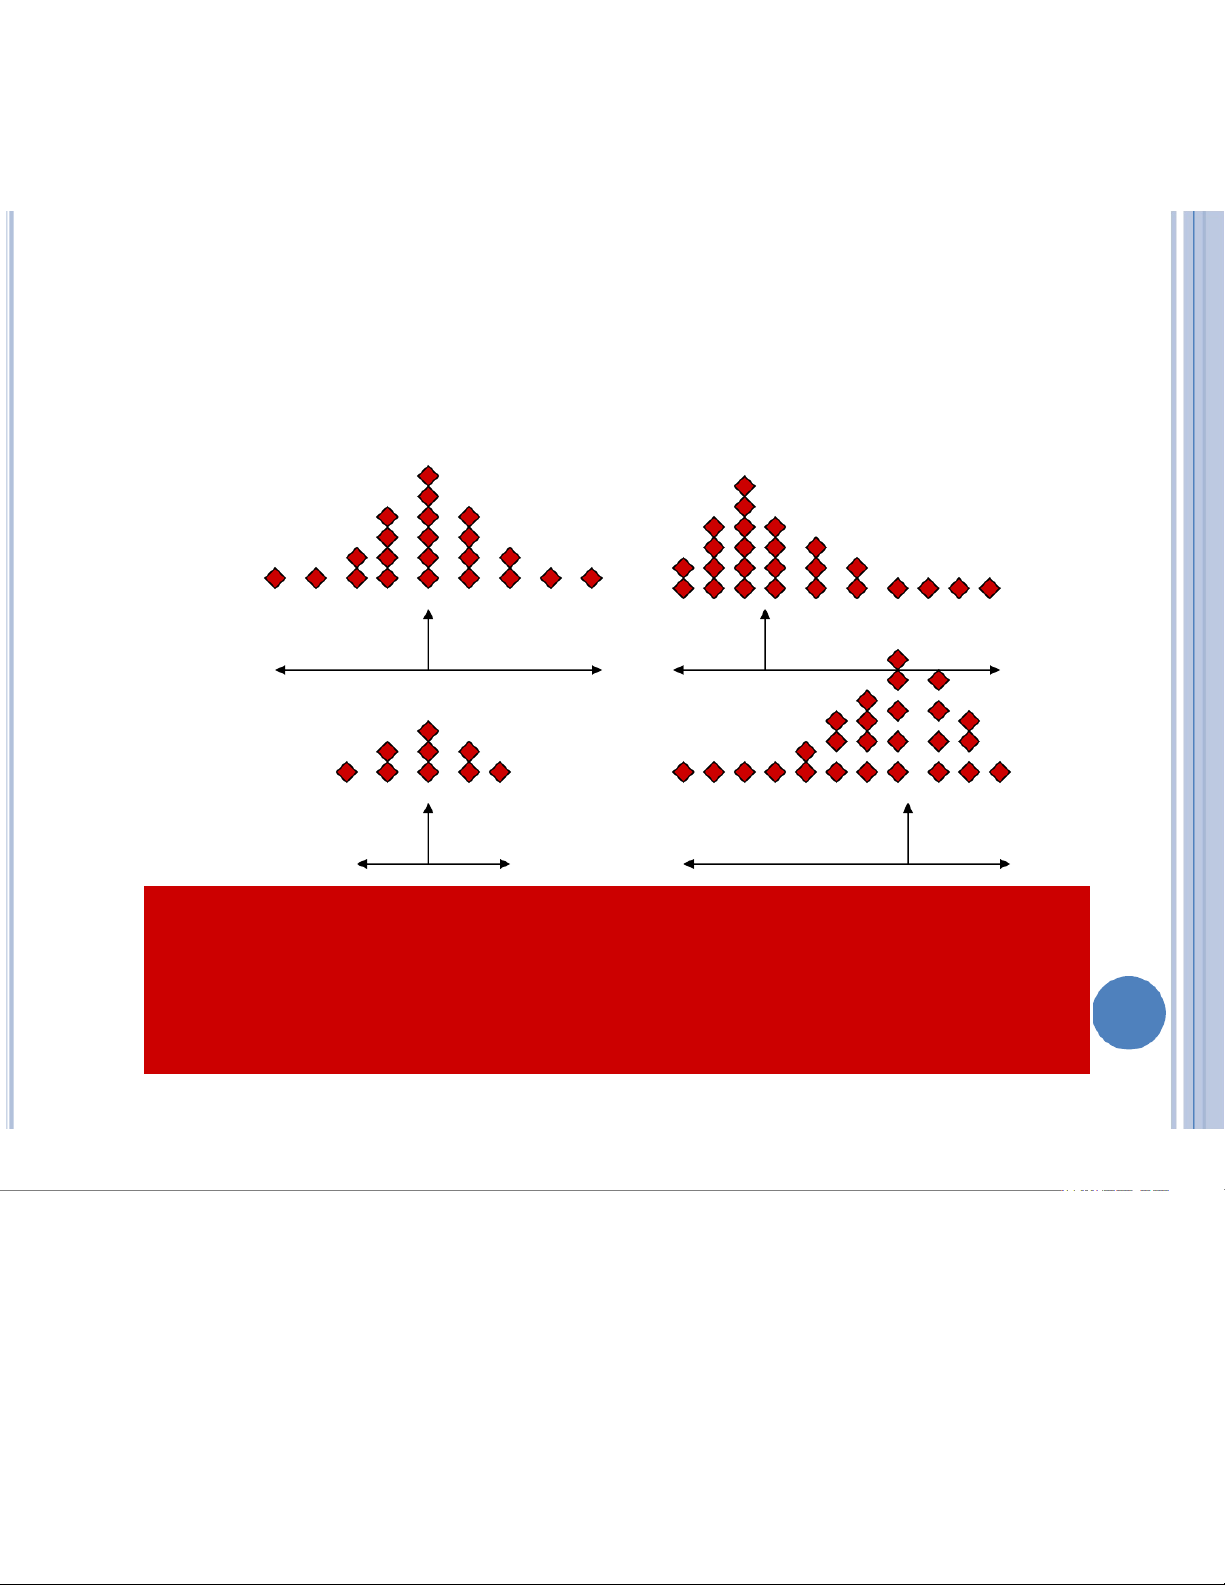
Bài giảng Xác suất Thống kê: Định nghĩa và Biểu đồ Thống kê - Studocu INTERPRETING GRAPHS: LOCATION AND SPREAD
Where is the data centered on the
horizontal axis, and how does it spread out from the center?
Tài liệu liên quan:
-

Bài giảng Chương 6: Kiểm định giả thuyết thống kê môn Xác suất thống kê | Đại học Duy Tân
29 15 -

Bài giảng Chương 5. Ước lượng tham số môn Xác suất thống kê | Đại học Duy Tân
30 15 -

Bài giảng Chương 4: Thống kê mô tả môn Xác suất thống kê | Đại học Duy Tân
27 14 -

Bài giảng Chương 3. Vectơ ngẫu nhiên môn Xác suất thống kê | Đại học Duy Tân
27 14 -

Bài giảng Chương 1: Xác suất môn Xác suất thống kê | Đại học Duy Tân
29 15