Báo cáo thí nghiệm Mạch điện 1 môn Lý thuyết mạch | Đại học Bách Khoa, Đại học Đà Nẵng
Báo cáo thí nghiệm Mạch điện 1 môn Lý thuyết mạch | Đại học Bách Khoa, Đại học Đà Nẵng giúp sinh viên tham khảo, ôn luyện và phục vụ nhu cầu học tập của mình cụ thể là có định hướng, ôn tập, nắm vững kiến thức môn học và làm bài tốt trong những bài kiểm tra, bài tiểu luận, bài tập kết thúc học phần, từ đó học tập tốt và có kết quả cao cũng như có thể vận dụng tốt những kiến thức mình đã học
Môn: Lý thuyết mạnh 16 tài liệu
Trường: Trường Đại học Bách khoa, Đại học Đà Nẵng 1.7 K tài liệu
Tác giả:


Preview text:
Đại học Bách khoa Đà Nẵng Báo cáo thí nghiệm Mạch điện 1 Thành viên nhóm 2: Đào Xuân Hiển Tôn Thất Minh Quân Phan Minh Phương Bùi Hoàng Nguyên Phạm Lê Tuấn Anh
Giảng viên hướng dẫn:
Nguyễn Hữu Lập Trường
Lớp sinh hoạt: 22ECE Table of Contents
I. Laboratory 1 - Introduction to Circuit Analysis
Procedure 1: Continuity Check
Procedure 2: Ohms Law
Procedure 3: Voltage Divider II.
Laboratory 2 – Nodal Analysis and Thévenin Equivalents
Procedure 1: Node and Mesh Analysis, Thévenin Equivalent
Procedure 2: Thévenin Equivalent as Models
Procedure 4: Experiment Design III.
Laboratory 4 – First Order Circuits
Procedure 1: RC Circuit -Laboratory 1- Introduction to Circuit Analysis
Procedure 1: Continuity Check
Set your multimeter on resistance. To find out if any two holes are connected,
measure the resistance between them with the multimeter. This is called a continuity check.
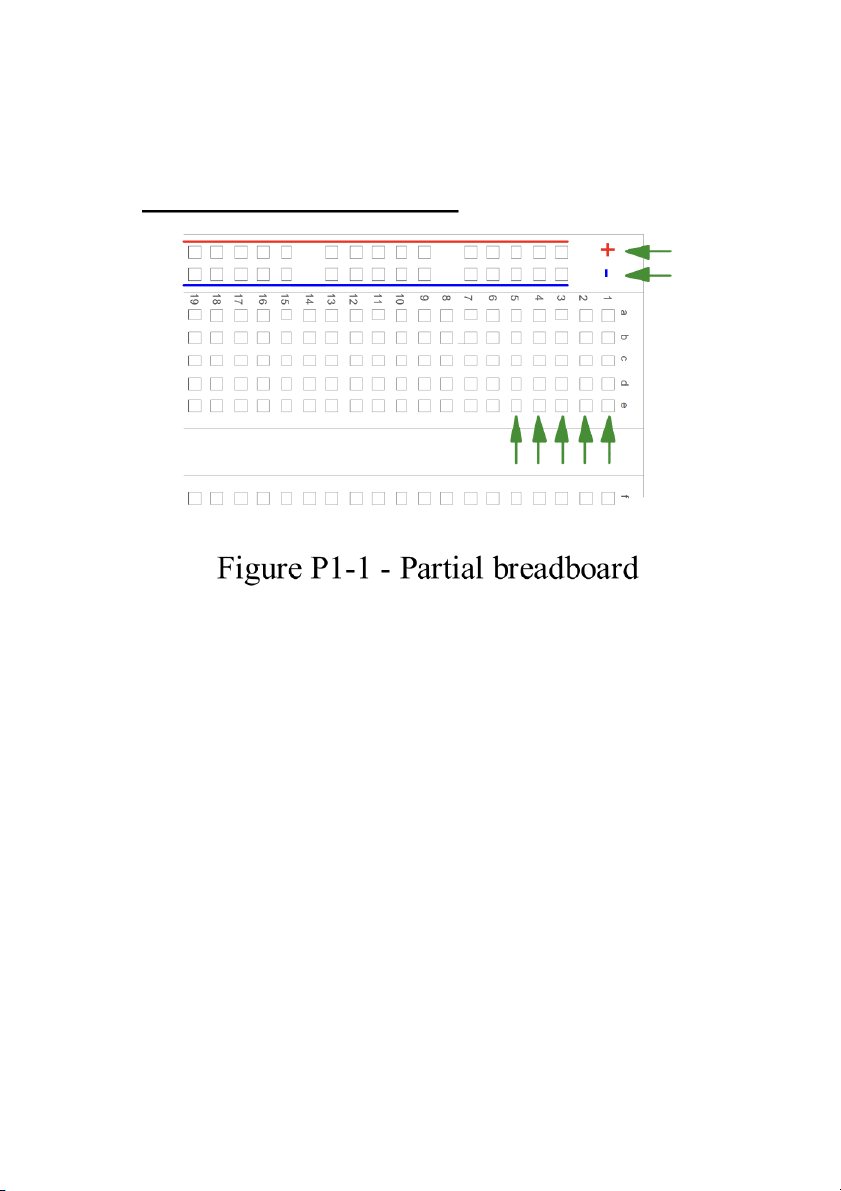
a. Measure and record the resistance between two holes in a row of 5
connected holes. Measure and record the resistance between two holes at
the opposite ends of a long side row (+ or -). Explain the difference (or lack thereof).
The value of the resistance between 2 holes in a row of 5 connected holes is: 0.4121
The value of the resistance between two holes at the opposite ends of a long side row is: 0.4612
The reason for the difference in resistance values can be attributed to the length
of the path the electrical current has to travel.
In the first scenario, where you measured the resistance between two
adjacent holes in a row of 5 connected holes, the current has a relatively
shorter path to travel through the connected holes, resulting in a lower resistance.
In the second scenario, where you measured the resistance between two
holes at the opposite ends of a long side row, the current has to traverse a
longer distance, encountering more resistance along the way. This longer
path contributes to a slightly higher resistance value.
a. What resistance did you measure between unconnected holes? What did your multimeter read?
The resistance that I measured between unconnected holes is: 0.7
My multimeter read: 0.5127
b. Does it make a difference which probe goes in which hole?
No, it does not matter which probe goes in which hole. Procedure 2: Ohms Law
Find the mystery resistor. This is a relatively uncommon metal film resistor
without resistor color code rings, in a clear plastic package. (Note: The appearance
of the mystery resistor may vary. This year it seems to be brown.) The easy way to
determine its resistance would be to measure it with your multimeter. But let's do it the hard way first.
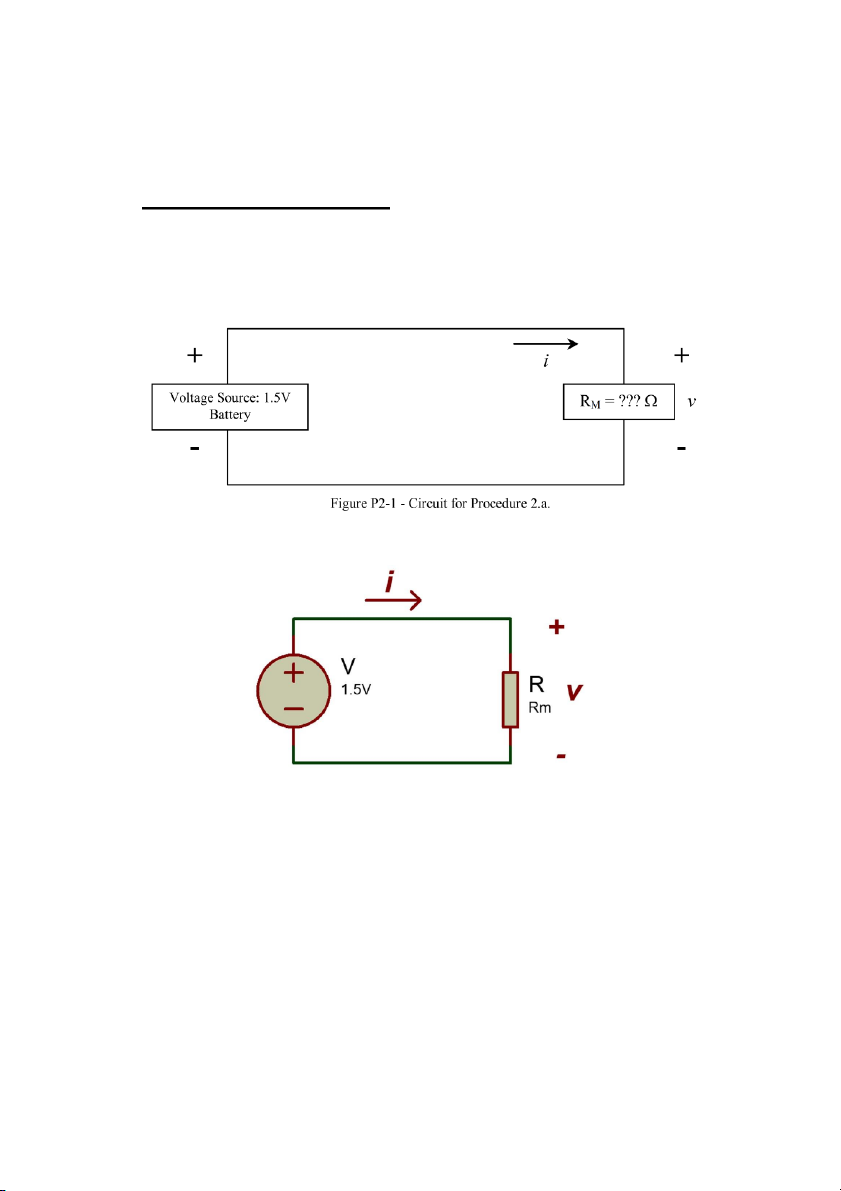
a. (2 points) Draw the circuit schematic diagram for the circuit in Figure P2-1 using
standard symbols for resistor and battery.
b. (1 points) Construct the circuit in Figure P2-1 on your breadboard with RM
being the mystery resistor. See below for construction hints. Measure the voltage
v across RM. Record the value.
The value of the voltage across RM shown on the multimeter is v = 1.5122 V
c. (1 points) Measure the current i
using your multimeter. Record the value. i = 0.0151 A
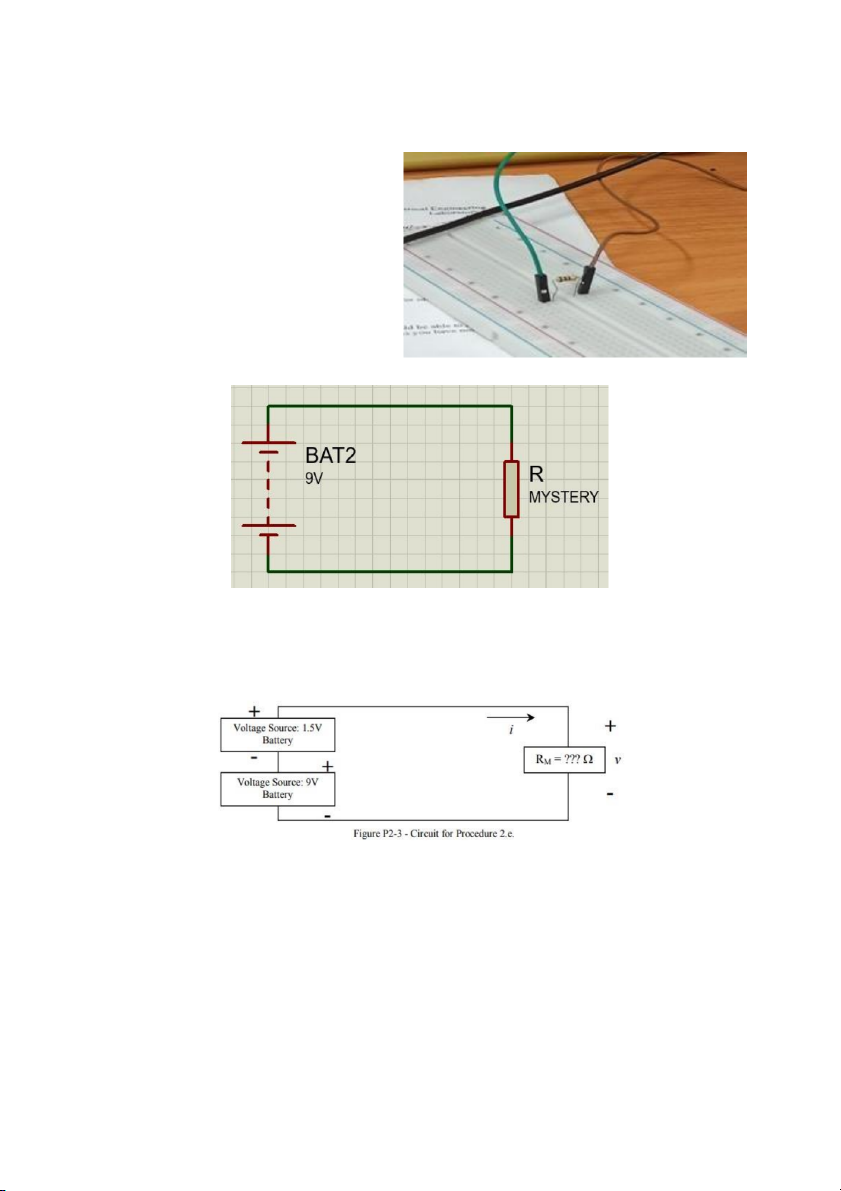
d. (2 points) Replace the 1.5 V battery with a 9 V battery and repeat steps b and c.
Step b: (still that circuit but using different power supply with 9V) -> v across RM = 9.0162 V Step c: i = 0.091 0 A
e. (2 points) Connect the 9V battery and the 1.5 V battery in series across the
mystery resistor RM. See Figure P2-3. Repeat steps b and c Step b: v across RM = 10.512 Step c: i = 0.1051 A
f. (4 points) Plot the three sets of voltage and current values you recorded on a
graph. Do they make a straight line?
Using the information on the table, we can create chart and figure out that It does not make a straigh line. BATTERY VOLTAGE (V) CURRENT (A) 1.5V 1.5122 0.0151 9V 9.0162 0.0910 1.5V and 9V 10.512 0.1051 Chart Title voltage current 12 0,12 10 0,1 8 0,08 6 0,06 4 0,04 2 0,02 0 0 1.5v 9v 1.5v and 9v
g. (4 points) Calculate the value of the mystery resistance RM using
Ohm’s law for each set of data points.
Using the Ohm’s law, which’s formula form is: Resistance = 𝑣𝑜𝑙𝑡𝑎𝑔𝑒 𝑐𝑢𝑟𝑟𝑒𝑛𝑡
Using the given data, which is measured in case use only 1 resistor,
which means the value of the resistor in 3 cases are the same: RESISTANCE BATTERY VOLTAGE (V) CURRENT (A) () 1.5V 1.5122 0.0151 99.7201 9V 9.0162 0.0910 102.2176 1.5V and 9V 10.512 0.1051 107.1788
From that, it is posible to determine the average value of the resistance is 103.0388 .
h. (2 points) Take RM out of the circuit and measure its resistance with your
multimeter. Write down the calculated values and the measured value. Compare to markings on the resistor. Resistance computed ( Resistance measured ( 99.7201 102.2176 100 107.1788
i. (2 points) What is the error between the average of the calculated values and the measured value
Use formula 𝑐𝑎𝑙𝑐𝑢𝑙𝑎𝑡𝑒𝑑 (𝑖
𝑛 𝑎𝑣𝑒𝑟𝑎𝑔𝑒)−𝑚𝑒𝑎𝑠𝑢𝑟𝑒𝑑 𝑥 100% to determine the error.
𝑐𝑎𝑙𝑐𝑢𝑙𝑎𝑡𝑒𝑑 103.0388 −100 𝑥 100% = 2.9491% 103.0388
Procedure 3: Voltage Divider
In this procedure, you will build a voltage divider and compare the measured
voltage to the ideal computed value.
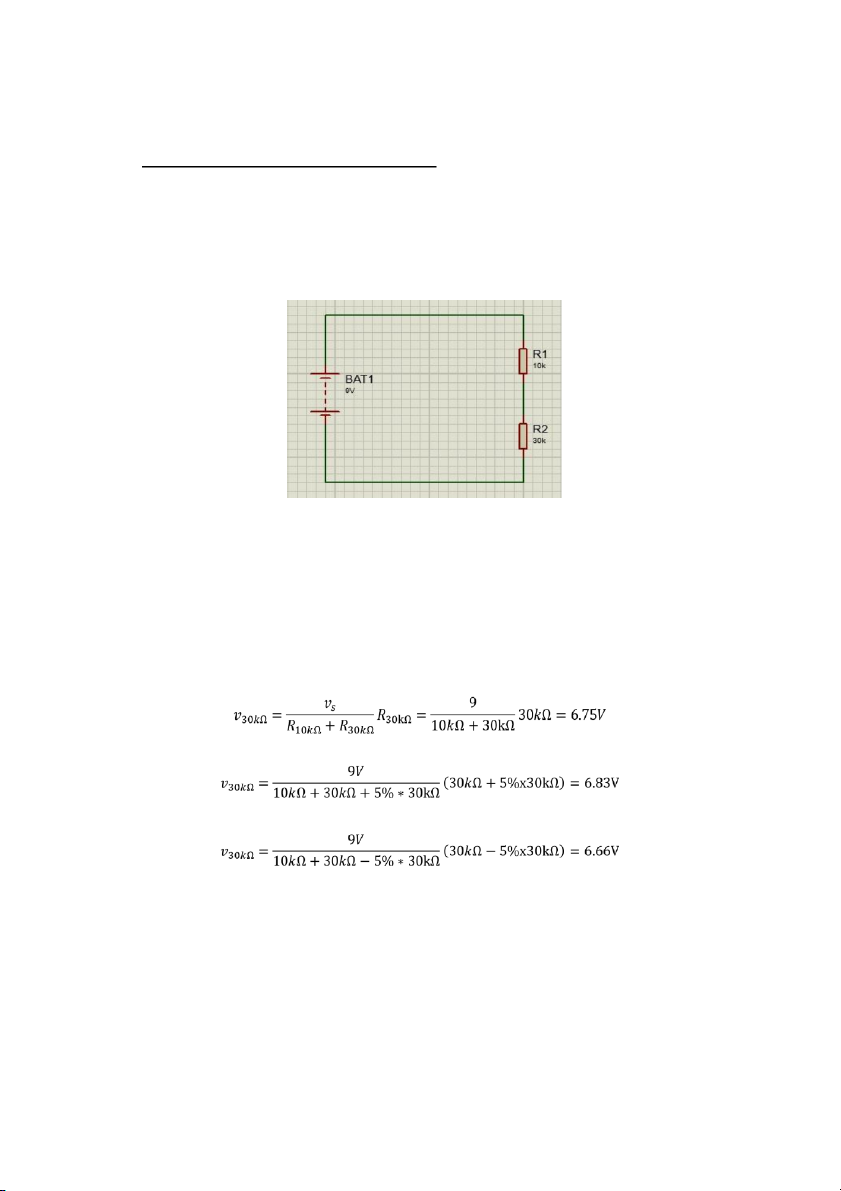
a. (4 points) Draw a circuit diagram for a voltage divider using a 9 V battery, a 10 kΩ
resistor, and a 30 kΩ resistor. For the benefit of the grader, connect one end of the
30 kΩ resistor to the negative battery terminal. A circuit diagram for a voltage
divider using a 9V battery, a 10kΩ resistor, and a 30kΩ resistor:
b. (4 points) Compute the value of the voltage across the 30 kΩ resistor in the circuit
of part a using nominal component values (9 V, 10 kΩ, 30 kΩ). Also compute the
range of voltage using a 5% resistor value tolerance.
According to the upward figure, we can see that 2 resistor are attached in series.
Rtotal = 10k + 30k = 40kΩ
The voltage across the 30kΩ resistor in the circuit using nominal component values (9V, 10kΩ, 30 Ω k ):
Voltage drop across 30𝑘Ω resistor if 30𝑘Ω resistor are +5 %
Voltage drop across 30𝑘Ω resistor if 30𝑘Ω resistor are −5 %
c. (4 points) Measure and record the actual battery voltage and resistor values. Vs = 9.2779V ≈ 9V R1 = 10.0012kΩ ≈ 10k 10k R2 = 31.1201kΩ ≈ 30k 30k
d. (4 points) Compute the value of the voltage across the 30 kΩ resistor in the
circuit of part a using the measured component values from part c. Note whether
this number is within the range computed in part b.
-The voltage passing through the 30k resistor in the circuit using the measured value from c is: 𝑣 9.2779 v 𝑠 30k 𝑅 31.1201 = 7.0214 V 𝑅 30𝑘 = 10𝑘 + 𝑅30𝑘 10.0012+31.1201
-The voltage computed with the measured values of each component is not the
same as its in part b, this could be due to the differences from the power source.
e. (4 points) Build the circuit in part a using the components you measured, and
measure the actual voltage across the 30 kΩ resistor. Discuss any differences with the result from part d.
After built the circuit in part (a) using the components we measured, the actual
voltage across the 30 kΩ resistor is: 𝑣 = 7.0214 𝑉 30𝑘
The difference in value between part d and e could be caused by multiple factors
such as: resistor of the breadboard and the wire, the changing resistance of the
resistor due to the temperature and the environment, the resistive load from the multimeter, etc.
Procedure 4: Current Divider
In this procedure, you will build a current divider and compare the measured
voltage to the ideal computed value. (As an experiment, this is less satisfactory
than the voltage divider because a battery is a voltage source, not a current source.)
a. (4 points) Draw a circuit diagram for a current divider using a 9 V battery, a 1 kΩ
resistor, and a 300 Ω resistor. For the benefit of the grader, draw the 300 Ω resistor
on the right side of the circuit.
b. (4 points) Compute the value of the current through each resistor, and the total
current leaving the battery, in the circuit of part a. using nominal component
values (9 V, 1 kΩ, 300 Ω). Also compute the range of total current using a 5% resistor value tolerance.
- The value of the current through each resistor: For 𝑅1 = 1𝑘𝛺 : 𝑖 = 0.009 A 1𝑘 = 𝑣𝑠 = 9 𝑟1 1000 For 𝑅2 = 300𝛺 : 𝑖300 = 𝑣𝑠 = 9 = 0.03 A 𝑟2 300
- The total current leaving the battery:
𝑖𝑏𝑎𝑡𝑡𝑒𝑟𝑦 = 0.009 + 0.03 = 0.039 A
- Calculation the currents when the resistors are −5 % 𝑖 1𝑘 = 9 = 0.0094 7 A 1000 − 5% 𝑥 1000 𝑖 = 9 300 = 0.03158 A 300 − 5% 𝑥 300
𝑖𝑏𝑎𝑡𝑡𝑒𝑟𝑦 = 0.00947 + 0.03158 = 0.04105 A
- Calculation the currents when the resistors are +5 % 𝑖1𝑘 = 9 = 0.0085 7 A 1000+ 5% 𝑥 1000 𝑖 300 = 9 = 0.0285 7 A 300+ 5% 𝑥 300 𝑖
𝑏𝑎𝑡𝑡𝑒𝑟𝑦 = 0.00857 + 0.02857 = 0 .03714 A
c. (4 points) Measure and record the actual battery voltage and resistor values.
𝑣𝑏𝑎𝑡𝑡𝑒𝑟𝑦 = 8.721 𝑉 𝑅1 = 1003.201Ω 𝑅2 = 302.122 Ω
d. (4 points) Compute the value of the current through each resistor and the total
current leaving the battery in the circuit of part a using the measured component
values from part c. Note whether this number is within the range computed in part b.
- The value of the current passing each resistor within the measured
component values from part (c): 𝑖 =
1𝑘 = 𝑣𝑏𝑎𝑡𝑡𝑒𝑟𝑦 = 8.721 0.00869 A 𝑅1 1003.201 𝑖 =
300 = 𝑣𝑏𝑎𝑡𝑡𝑒𝑟𝑦 = 8.721 0.02887 A 𝑅2 302.122
- The value of the current passing the battery in the circuit using the measured
component values from part (c):
𝑖𝑏𝑎𝑡𝑡𝑒𝑟𝑦 = 0.00869 + 0.02887 = 0.03756 A
- All the calculated values in this part lie in the range of value of 𝑖1𝑘Ω, 𝑖300Ω,
𝑖𝑏𝑎𝑡𝑡𝑒𝑟𝑦 calculated in part (b).
e. (4 points) Build the circuit in part a using the components you measured, and
measure the actual current through each resistor, and the total current leaving the
battery. Discuss any differences with the result from part c.
- After constructing the circuit in part (a) using the components measured,
the actual current through each resistor, and the total current from the power source are: 𝑖1𝑘 = 0.00869 A 𝑖300 =0.02887 A
𝑖𝑏𝑎𝑡𝑡𝑒𝑟𝑦 = 0.03756 A
- The difference in value between part d and e could be caused by multiple
factors such as: resistor of the breadboard and the wire, the changing
resistance of the resistor due to the temperature and the environment, the
resistive load from the multimeter, etc.
f. (5 points) Compute the power dissipated in each resistor. Do you expect either
resistor to be hot? Check by touch - careful, don't get burned.
- We have the power dissipated: 𝑝 = 𝑖2 ∗ 𝑅
The power dissipated in each resistor: Resistors
Resistance (𝛀) Current (𝑨) Power (𝑾) 𝑅1𝑘Ω 1003.201 0.00869 0.0758 𝑅300Ω 302.122 0.02887 0.2518 - Expectation: •
The 𝑅1𝑘Ω would be cold due to value 0 0 . 758 (W) of the power
dissipation, which is such a tiny amount compared to 0.25(W) (The
rated power for the resistor use in this case is 1/4W). •
The 𝑅300Ω would be warm due to the value 0.251 8 (W) the power
dissipation, which is basically higher than 0.25(W) (The rated
power for the resistor use in this case is 1/4W).
- Check by touching: Same as expectation: The 𝑅1𝑘Ω is as normal with room
temperature whereas the 𝑅300Ω is hotter than the room temperature. -Laboratory 2- Nodal Analysis And Thévenin Equivalents
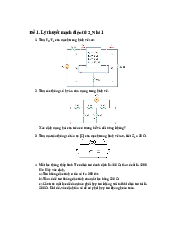
Procedure 1: Node and Mesh Analysis, Thévenin Equivalent
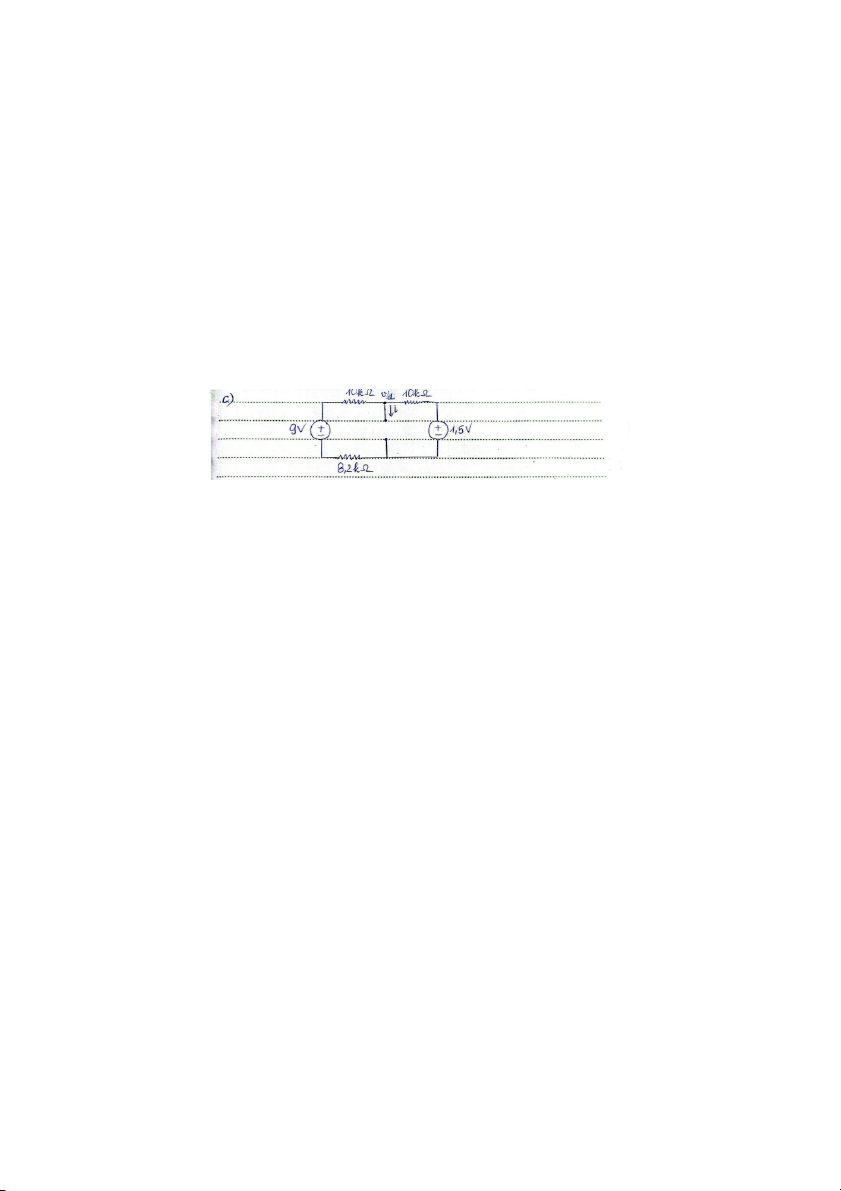
Construct the circuit of Figure P1-1 on your breadboard:
a. (5 points) Calculate the voltage v across the 20 kΩ resistor using node voltage analysis. Applying KLC at node 1:
𝑣1−9 + 𝑣1 + 𝑣1−1.5 = 0 10+8.2 20 10 𝑣1 = 3.144772 V = v
b. (5 points) Calculate the current i through the 20 kΩ resistor using mesh current analysis. Applying KVL at mesh 1:
-9 +10𝑖1 + 20(𝑖1 -𝑖2) + 8.2𝑖1 = 0 𝑖1 – 20𝑖2 = 9 (1) Applying KVL at mesh 2: 1.5 + 20(𝑖 - 2 𝑖1) + 10𝑖2 = 0 𝑖1 + 30𝑖2 = -1.5 (2)
From (1), (2) we can define the value of 𝑖 and 1 𝑖2: 𝑖1 = 0.3217 mA 𝑖2 = 0.1644 mA 𝑖1 = 𝑖
𝑡𝑜𝑡𝑎𝑙 + 𝑖2 => 𝑖𝑡𝑜𝑡𝑎𝑙 = 𝑖1- 𝑖2 = 0.3217 – 0.1644 = 0.1573 mA
c. (5 points) Measure the voltage v across the 20 kΩ resistor. Measure
the current i through the 20 kΩ resistor. Are these values consistent
with your calculations in parts a and b? Explain any differences.
(Remember to return your meter to voltage measurement or off as
soon as you have completed the current measurement.)
Voltage measured across resistor 20 kΩ: v=3,0476V
Current measured through resistor 20 kΩ: i=0,1541mA
These values dier slightly from the calculaons in parts a and b.
Explain: When measuring voltage and current across a resistor, measuring devices
and measurement methods can produce errors. Meters often have certain errors
and do not show absolute accuracy. Actual resistance may have different accuracy,
factors such as material, ambient temperature, other environmental influences
(such as light, humidity) may affect the actual resistance value international. There
are many other factors that can affect the difference between data such as the
errors of the electronic components used, influences from the surrounding
environment (such as temperature, humidity) and effects from other peripheral
factors. The difference in data between measuring voltage and current on the
same resistor is different from the calculations in questions a and b because it
partly depends on technical factors and specific environmental conditions in the
test. measurement and calculation process.
d. (5 points) Compute the values of the Thévenin equivalent seen by the 20 kΩ
resistor using circuit analysis techniques. Draw the equivalent circuit and list the values.
e. (5 points) Remove the 20 kΩ resistor from the circuit you built and measure
the open circuit voltage v. Replace the 20 kΩ resistor with a short circuit (your
multimeter set on current works nicely) and measure the short circuit current
i. Use these values to compute a Thévenin equivalent. Compare to the
Thévenin equivalent from part e.
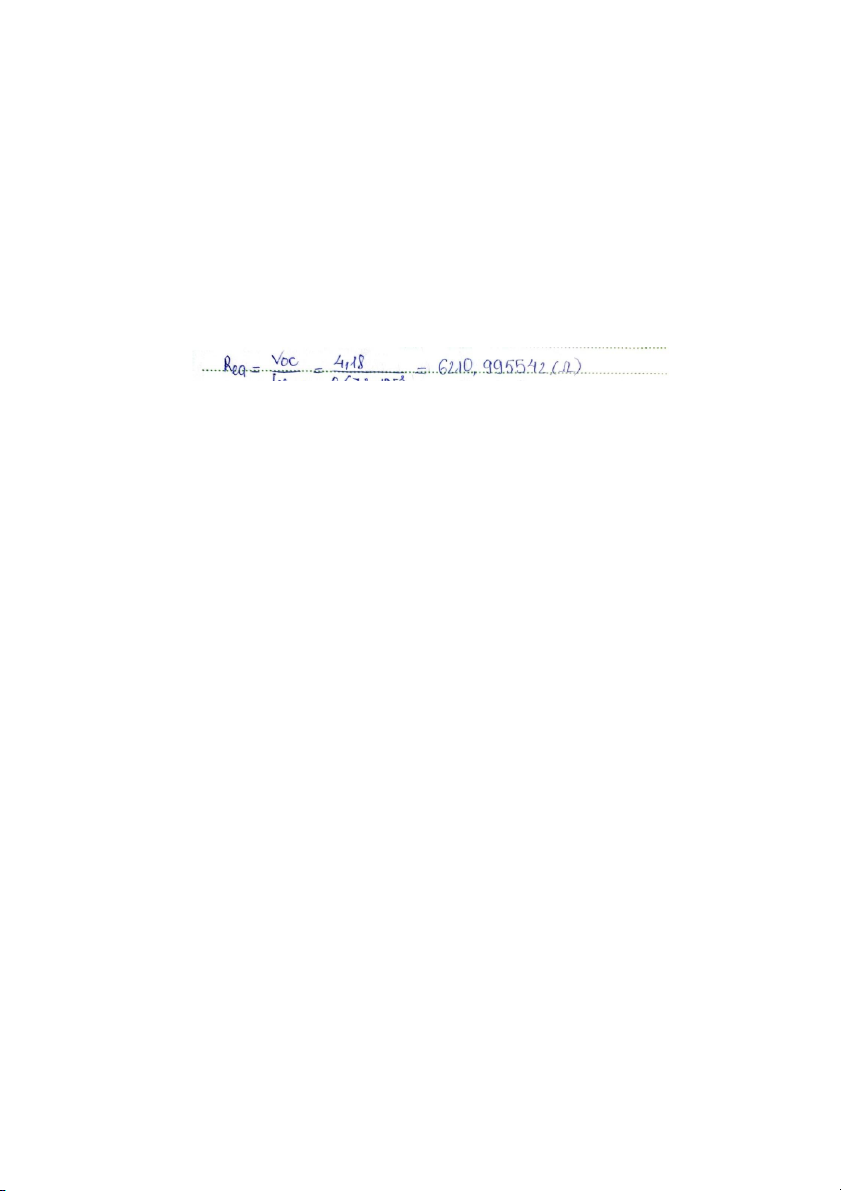
𝑣𝑜𝑐 = 4.1761(𝑉) ≈ 4.18(𝑉) 𝑎𝑛𝑑 𝑖𝑠𝑐=0.673(𝑚𝐴)
- Compute the equivalent resistance of the model 𝑅𝑒𝑞
*The value of Thévenin model in part (e) is a little bit different from the one in
part (d). This could be due to error and extra resistance while measuring in part (e).
Procedure 2: Thévenin Equivalents as Models
a) Connect a 100 Ω resistor and the 1.5 V AA battery as shown in Figure P2-1.
Measure the open circuit voltage and the short circuit current at the circuit
terminals, marked a and b in Figure P21. Do NOT short circuit the battery all
by itself, i.e., always have the 100 Ω resistor in the circuit. If you like, you
can find current by measuring the voltage across the resistor and applying
Ohm's Law. This is a safer way of measuring current than using an ammeter.
If you do this, consider whether you should use the nominal or measured value of the resistance.
b. Using the measurements made in part a, calculate the Thévenin Equivalent
circuit for the battery and series resistor taken together. Then calculate the
internal resistance of the battery. Draw the Thévenin Equivalent of the battery, only. Label values.
-Using the measured values in part (a) to calculate the Thévenin circuit for the
battery and the resistor taken together:
Procedure 4: Experiment Design
a. (20 points) Write an experimental procedure to determine a Thévenin
equivalent model for an LED that is in the On (light emitting) state. Include a
circuit diagram and the steps of your procedure.
b) Execute your procedure and determine the parameters of your model. Draw a
circuit diagram of your model with the parameters. Check your model against
measured values. Check your model when the diode is in the off state. Comment on how good a model you have
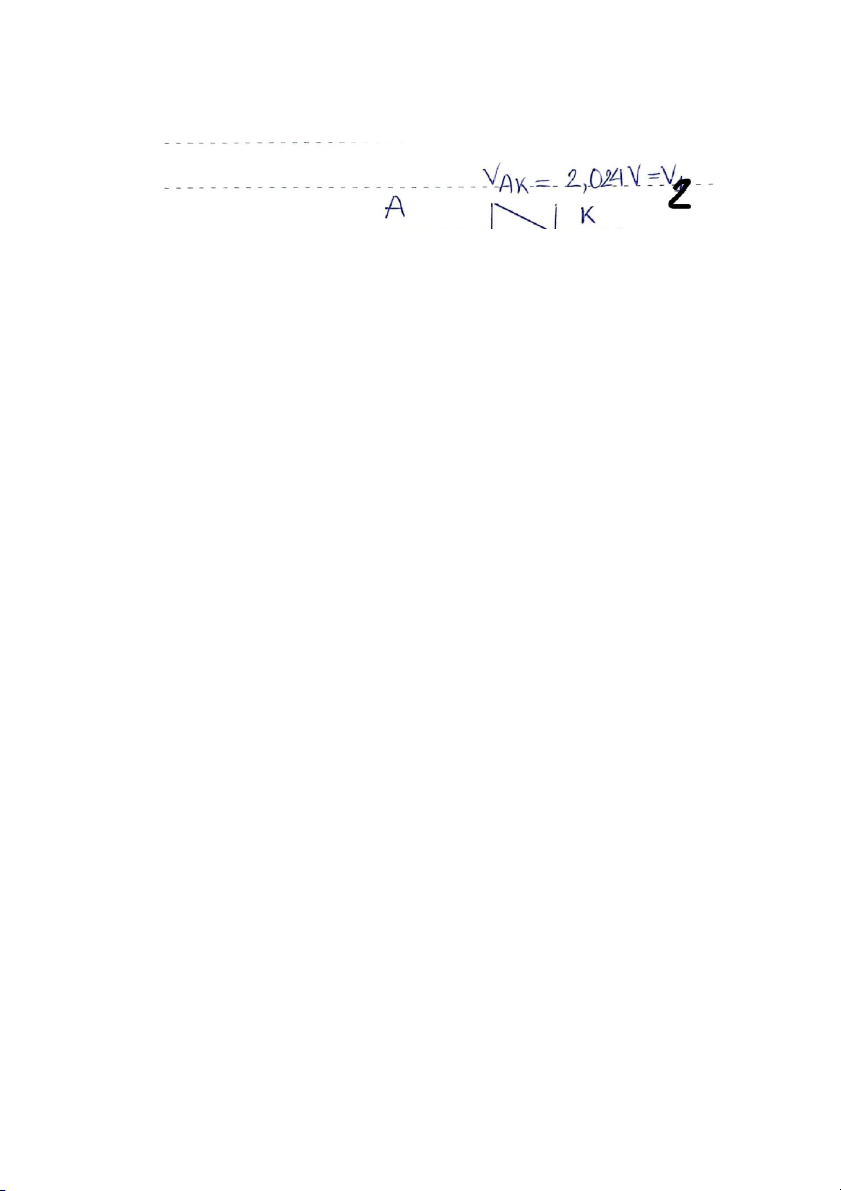
-Use a combined resistor of 1𝑘𝛺 and 51𝛺, whose equivalent resistance is 1.051𝑘𝛺, and a battery of 9𝑉. • 𝑣𝐴𝐾 = 𝑣 2 = 2.024𝑉 •
𝑖 = 𝑖2 = 6,798m𝐴 -
To check, use a case whose voltage is 9V and resistor’s resistance is
1.043𝑘𝛺 by combing a resistor of 1𝑘𝛺 and one of 43𝛺. • 𝑣𝐴𝐾 = 2.024𝑉 • 𝑖 = 6.798𝑚𝐴
If using the equation to get the value of 𝑣𝐴𝐾:
𝑣𝐴𝐾 = 1.857𝑉 + 6.798𝑚𝐴*10^-3 ∗ (4000/163𝛺) ~ 2.024 𝑉, which is not far from the measured value. The calculated value for , which is not far from the measured value.
Then use another resistor whose resistance is 1𝑘𝛺 + 100𝛺 – 1.1𝑘𝛺 𝑣𝐴𝐾 = 2.015𝑉 𝑖 = 6.5𝑚𝐴
The calculated value for 𝑣𝐴𝐾:
which is not far from the measured value. The calculated value for , which is not far from the measured value.
- Check your model when the diode is in the “off state”.
To check the model when the diode is in the “off state,” choose resistor
which causes 𝑣𝐴𝐾 less than 2𝑉.
First, choose a resistor of 1.5𝑘𝛺. 𝑣𝐴𝐾 = 1.975𝑉 and 𝑖 = 4.8𝑚𝐴 The calculated value for ,
which is not far from the measured value. The calculated value for , which is not far from the measured value.
Then, choose a resistor of 4.7 k-ohm. 𝑣𝐴𝐾= 1.884V 𝑖 = 1.6 mA The calculated value for , which is
not far from the measured value. The calculated value for , which is not far from the measured value.
With the four checks, the model should be appropriate, considering the error may
result from the approximations. -Laboratory 4- First Order Circuits Procedure 1: RC Circuit
Construct the circuit of Figure P1-1.
1.a (3 points) Compute the value of capacitor voltage vc if the switch is in the
down position (2) for a long time. Measure vc and compare to your computed
value. How long is "a long time" for this circuit?
When the switch is in the down position for “a long time” • The voltage of capacitor: Where: 𝑣 3 −6 0 =
9𝑉, 𝑅 = 20 × 10 𝛺, 𝐶 = 1000 × 10 •
Initial value of the voltage of capacitor: •
Comparing with the value of measured 𝑣𝑐. •
After measuring, the initial voltage is observed and measured at 𝑣(0) = 9,
the voltage of the capacitor slowly decreased gradually until the value turn to 0.
1.b (2 points) Compute the value of vc if the switch is in the up position (1) for a
long time. Use the measured value of the battery voltage. Measure vc and compare.
When the switch is in up position (1) for a long time, this means the capacitors is
being charged until the voltage of the capacitor reach the voltage of the battery. => 𝑣𝑐 = 9𝑉 -
Measuring: 𝑣𝑐 = 8.7279 𝑉
1.c. (15 points) Prepare to write down the value of vc every 15 seconds. This is
easiest using alligator clips and monitoring voltage continuously. After the switch
has been in the up position (1) for a long time, switch it to the down position (2)
and simultaneously start timing. (For example, throw the switch when the second
hand on a watch is at zero seconds, or at the same time as the stopwatch feature
on a digital watch is started.) Record the value of vc every 15 seconds for three
minutes. Graph the voltage values. Characterize the graph - is it linear, quadratic, or
exponential? Determine the circuit time constant from the graph. Calculate the
ideal time constant using nominal component values. Find the % error between the ideal and measured values. Recording 𝑣𝑐 each 1 s 5 for 3 minutes: second 0 15 30 45 60 75 90 105 120 135 150 165 180 𝑣𝑐 8.7 4.4
2.2 1.09 0.54 0.27 0.14 0.04 0.067 0.033 0.015 0.008 0.004 𝑣 − 𝑡 graph 10 8 6 4 2 0 0 15 30 45 60 75 90 105 120 135 150 165 180 Vc -
The time constant from the exponential graph: Get two points: (15; 4.4) and (30; 2.2) = S
> ubstitute these points to equation: −15 We have: 4.4 = 𝐴𝑒 𝑇 −30 2.02 = 𝐴𝑒 𝑇 𝑇 = 21.6404 s 𝐴 = 8.8 - Ideal time constant: 𝑇 3
𝑐 = 20 × 10 × 1000 × 10−6 = 20𝑠 -
The error percentage: 1 − 𝑇 𝑐 𝑥 100% = 1 − 20 𝑥 100%= 0.076% 𝑇 21.6404
1.d. (10 points) After the switch has been in the down position (2) for a long time,
switch it to the up position (1) and record a value of vc every 15 seconds for three
minutes. Graph the voltage values. Characterize the graph - is it linear, quadratic, or
exponential? Determine the circuit time constant from the graph. Calculate the
ideal time constant using nominal component values. Find the % error between the ideal and measured values. -
After the switch has been in the down position (2) for a long time, switch it to the up position (1) - Recording 𝑣𝑐 each 1 s 5 for 3 minutes: second 15 30 45 60 75 90 105 120 135 150 165 180 𝑣𝑐
4.42 6.72 7.90 8.41 8.77 8.91 8.94 8.95 8.961 8.989 8.997 9.01 Vc 10 9 8 7 6 5 4 3 2 1 0 0 15 30 45 60 75 90 105 120 135 150 165 180 Vc -
The time constant from the exponential graph: Get two points: (15; 4.42) and (30; 6.72) = S
> ubstitute these points to equation: −15 We have: 4.42 = 𝐴𝑒 𝑇 −30 6.72 = 𝐴𝑒 𝑇 𝑇 = -35.8039s 𝐴 = 2.9072 - Ideal time constant: 𝑇 3
𝑐 = 20 × 10 × 1000 × 10−6 = 20𝑠 -
The error percentage: 1 − 𝑇 𝑐 𝑥 100% = 1 − 20 𝑥 100%= 0.441% |𝑇| 35.8039
List of member and their contribution: Full name Work on Brief comment -
Great attitude and contribution. Đào Xuân Hiển Doing lab -
Have inspiration of learning and
discorering to the others member. - Do most of the experiment. -
Great attitude and contribution. - Have good study. Tôn Thất Minh Quân Doing lab -
Do pay attention to the workout. - Give a hand in doing the experiment. -
Great attitude and contribution. Phan Minh Phương Recording figure - Have good study. -
Do pay attention to the workout. -
Good attitude and contribution. -
Have lack of foci sometime, but still Bùi Hoàng Nguyên Doing lab
show sufficient contribution to the workout. -
Good attitude and contribution. -
Have lack of foci sometime, but still Recording
show sufficient contribution to the Phạm Lê Tuấn Anh figure workout. -
Use social media for entertainment on the second day of the lab
Tài liệu liên quan:
-

Báo cáo thực hành cơ sở lý thuyết mạch điện môn Lý thuyết mạch | Đại học Bách Khoa, Đại học Đà Nẵng
1.4 K 679 -
Bài tập ôn tập chương 4 môn Lý thuyết mạch | Đại học Bách Khoa, Đại học Đà Nẵng
368 184 -

Giáo trình Cơ sở kỹ thuật điện 1 môn Lý thuyết mạch | Đại học Bách Khoa, Đại học Đà Nẵng
840 420 -

Chương 3: Đặc tính tần số môn Lý thuyết mạch | Đại học Bách Khoa, Đại học Đà Nẵng
320 160 -
Đề 1. Lý thuyết mạch điện tử 2_Nh4 môn Lý thuyết mạch | Đại học Bách Khoa, Đại học Đà Nẵng
1 K 524