Báo cáo thí nghiệm môn Đa phương tiện và các ứng dụng giải trí | Trường Đại học Bách Khoa Hà Nội
Báo cáo thí nghiệm môn Đa phương tiện và các ứng dụng giải trí. Tài liệu được sưu tầm gồm 33 trang, giúp các bạn ôn luyện và phục vụ cho việc học tập, đạt kết quả tốt. Mời các bạn đón xem!
Môn: Đa phương tiện và các ứng dụng giải trí 10 tài liệu
Trường: Đại học Bách Khoa Hà Nội 5.8 K tài liệu
Tác giả:


Preview text:
ĐẠI HỌC BÁCH KHOA HÀ NỘI
TRƯỜNG ĐIỆN-ĐIỆN TỬ ***
BÁO CÁO THÍ NGHIỆM
MÔN: ĐA PHƯƠNG TIỆN MỤC LỤC
MODULE 1: CÁC THAO TÁC XỬ LÝ ẢNH TRÊN MATLAB ........................................................... 3
MODULE 2. BIẾN ĐỔI DCT ẢNH KHỐI TRƯỚC KHI NÉN ............................................................ 7
MODULE 3. KỸ THUẬT TĂNG CƯỜNG CHẤT LƯỢNG HÌNH ẢNH .......................................... 11
MODULE 4. XỬ LÍ AUDIO VÀVIDEO ................................................................................................ 21
MODULE 5. THIẾT KẾ BỘ MÃ HÓA-GIẢI MÃ TỰA JPEG ........................................................... 27
MODULE 6. MÃ HÓA TIẾNG NÓI BẰNG PHƯƠNG PHÁP DỰ ĐOÁN TUYẾN TÍNH LPC ..... 30
MODULE 1: CÁC THAO TÁC XỬ LÝ ẢNH TRÊN MATLAB
Đọc file ảnh từ MatLab Code: A = imread('bai1.png'); imshow(A); Figure:
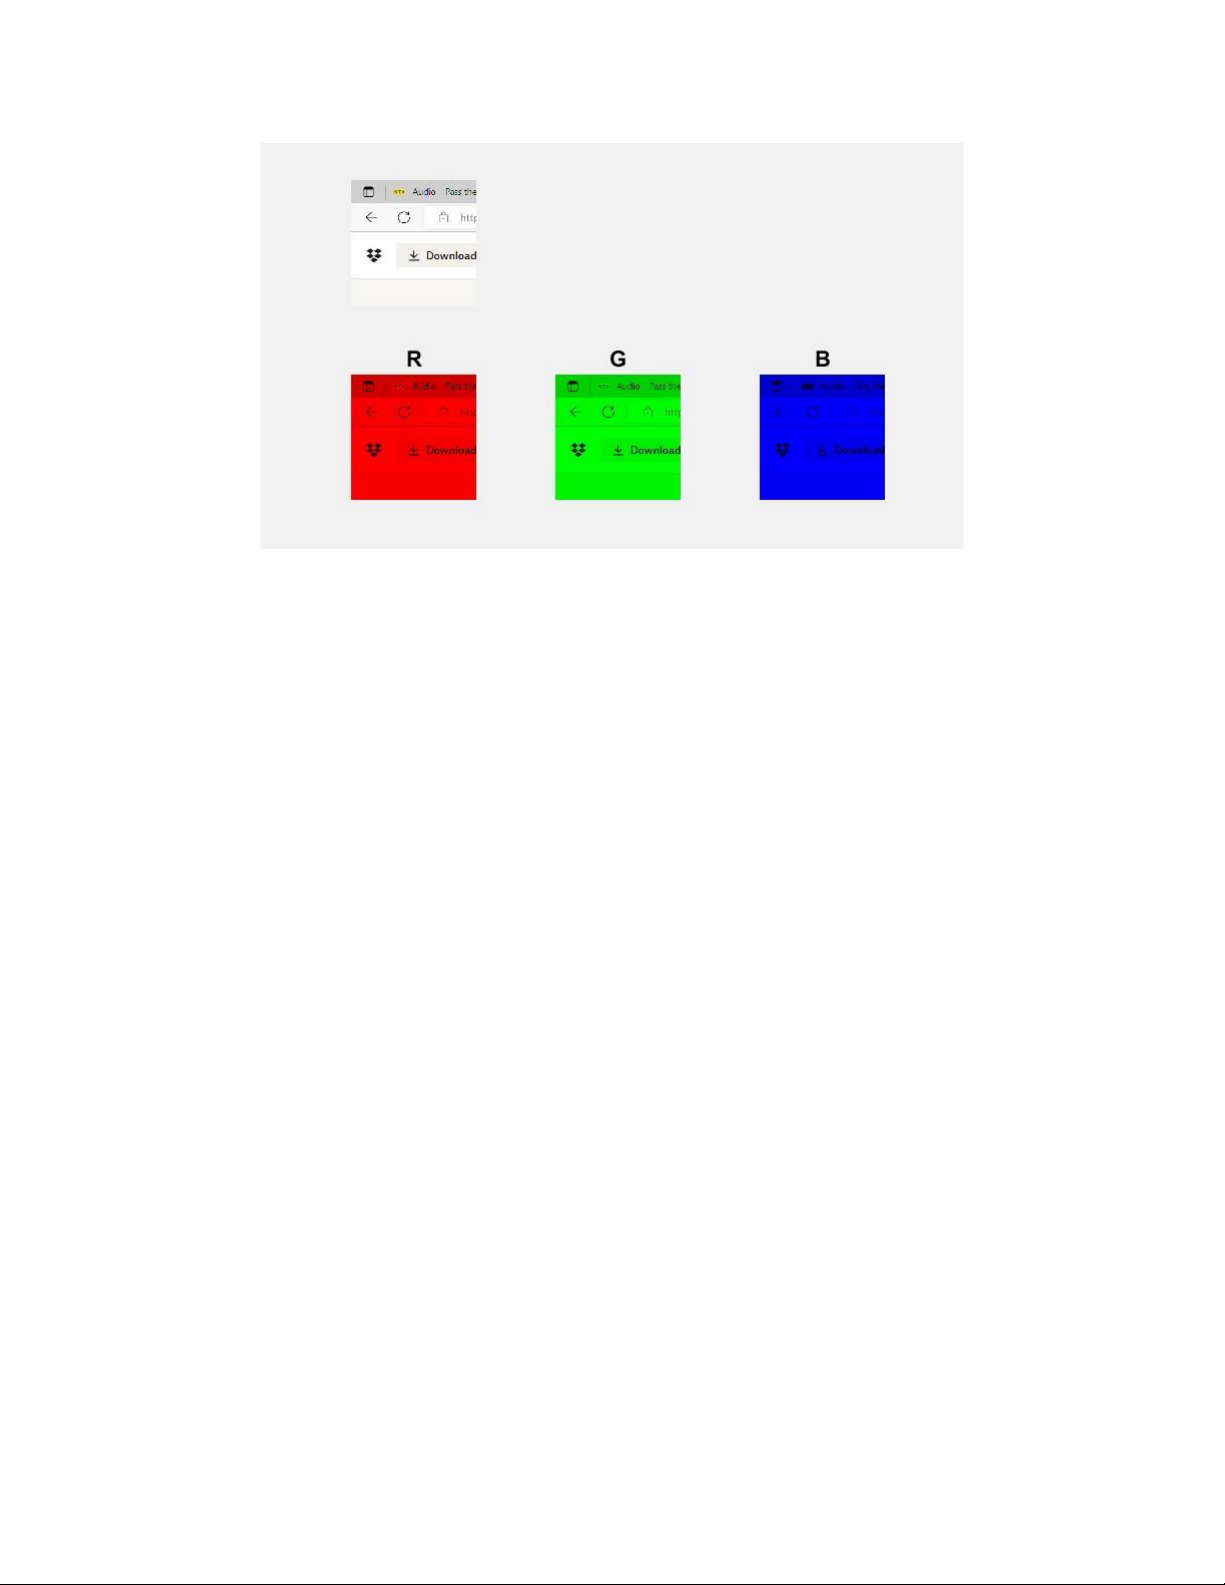
Hiển thị 3 ảnh thành phần của ảnh RGB của ảnh và vẽ histogram của 3 ảnh thành phần này Code: A = imread('bai1.png'); B=A; C=A; D=A; B(:,:,2)=0;B(:,:,3)=0; C(:,:,1)=0;C(:,:,3)=0; D(:,:,1)=0;D(:,:,2)=0; subplot(3,3,1);imshow(A);
subplot(3,3,4); imshow(B); title('R');
subplot(3,3,5); imshow(C); title('G');
subplot(3,3,6); imshow(D); title('B'); Figure:
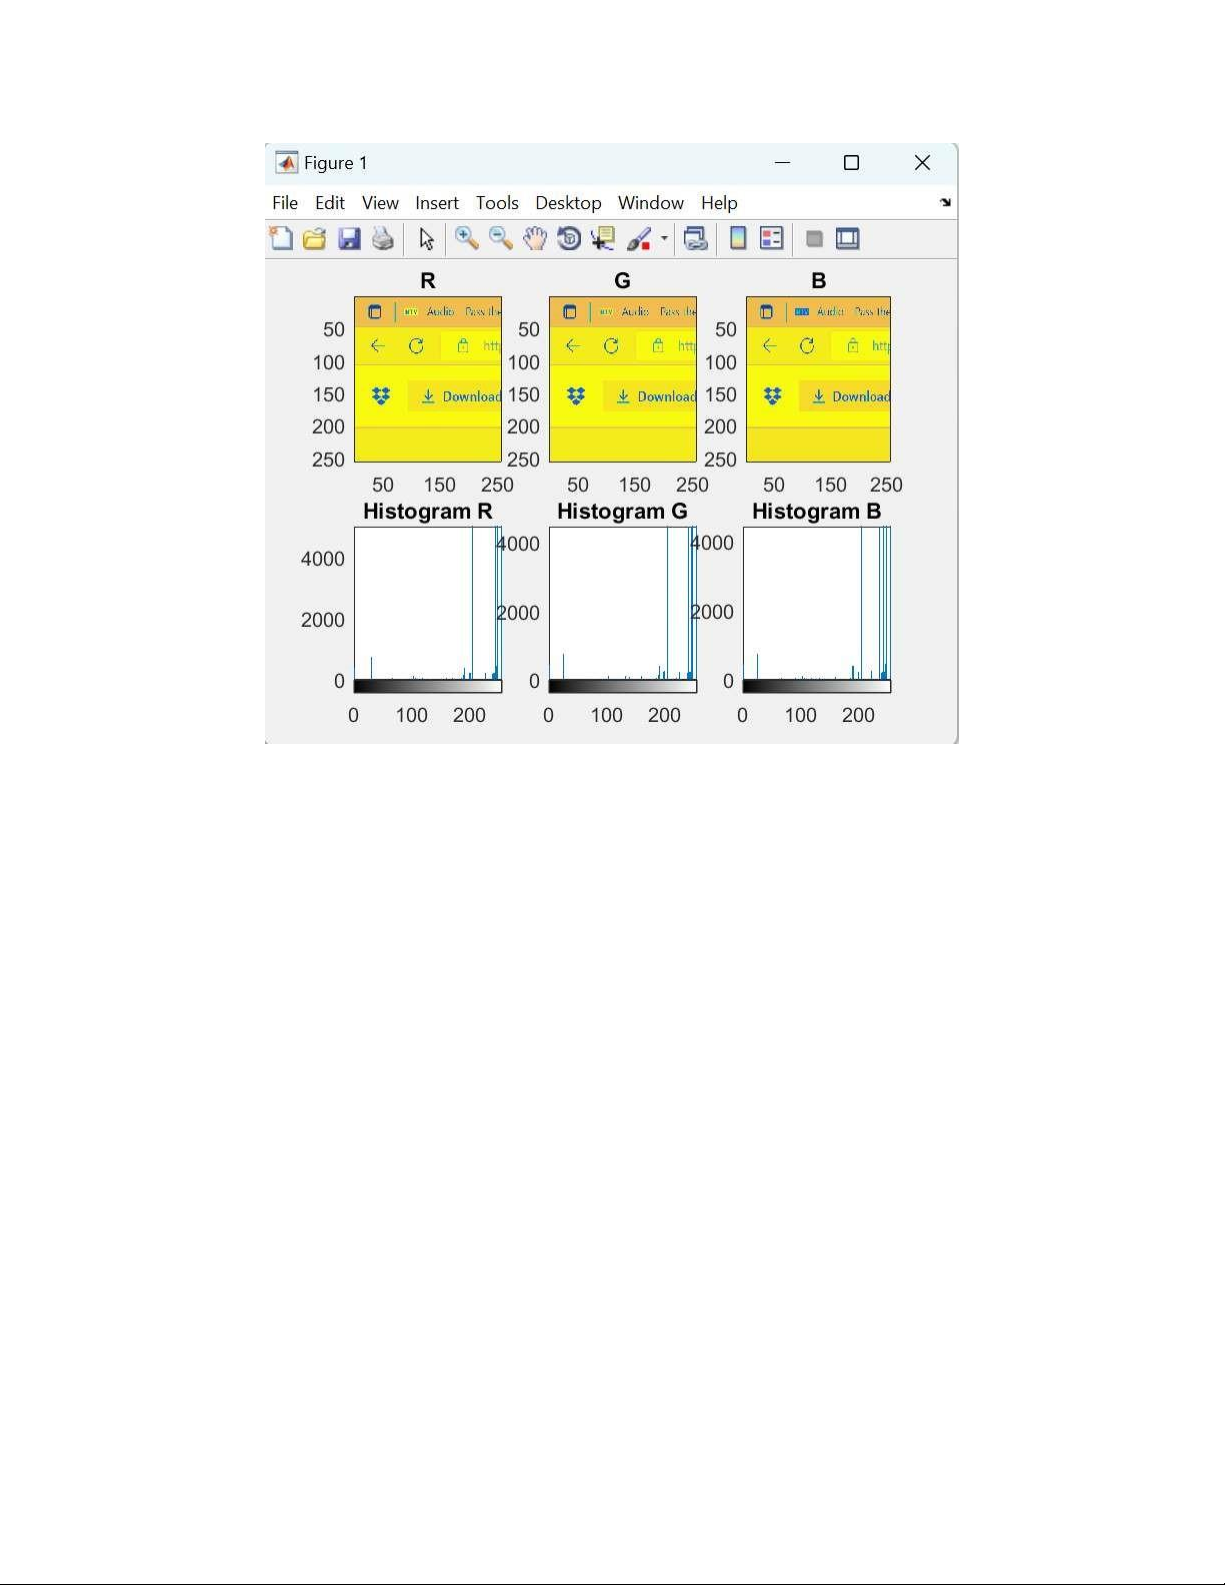
Code: subplot(231); imagesc(A(:,:,1)); title('R');
subplot(232); imagesc(A(:,:,2)); title('G');
subplot(233); imagesc(A(:,:,3)); title('B');
subplot(234); imhist(A(:,:,1)); title('Histogram R');
subplot(235); imhist(A(:,:,2)); title('Histogram G');
subplot(236); imhist(A(:,:,3)); title('Histogram B'); Figure:
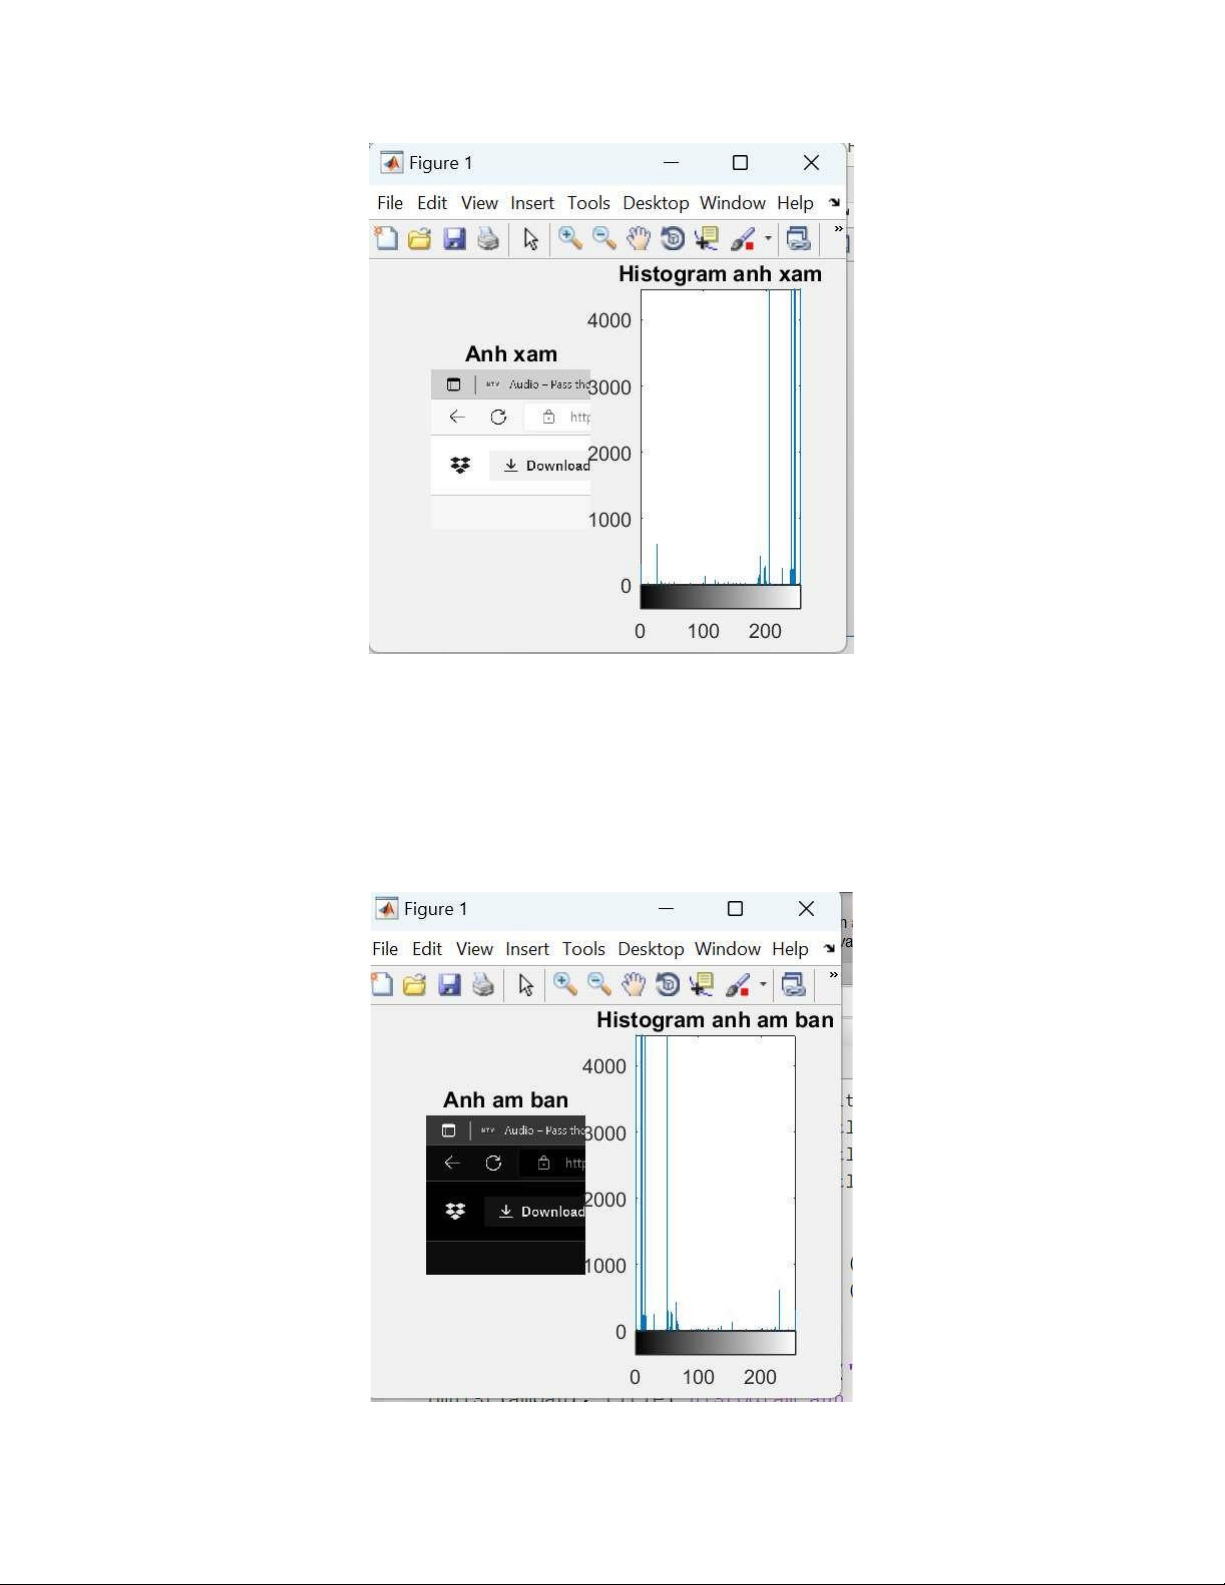
Chuyển đổi ảnh sang màu xám. Vẽ histogram của ảnh xám Code: gray=rgb2gray(A);
subplot (121); imshow(gray); title ('Anh xam'); subplot
(122); imhist(gray); title ('Histogram anh xam'); Figure:
Hiển thị ảnh âm bản của bức ảnh:
Để vẽ âm bản, ta lấy 255 trừ đi giá trị của từng điểm ảnh xám, sau đó vẽ histogram. amban=255.-gray;
subplot(121); imshow(amban); title('Anh am ban'); subplot(122);
imhist(amban); title('Histogram anh am ban');
MODULE 2. BIẾN ĐỔI DCT ẢNH KHỐI TRƯỚC KHI NÉN
Biến đổi DCT ma trận A A = 20 20 20 20 20 20 20 20 40 40 40 40 40 40 40 40 20 20 20 20 20 20 20 20 40 40 40 40 40 40 40 40 20 20 20 20 20 20 20 20 40 40 40 40 40 40 40 40 20 20 20 20 20 20 20 20 40 40 40 40 40 40 40 40
Thực hiện tính DCT trên Matlab: dctA = dct2(A) dctA = 240.0000 0 0 0 0 0 0 0 -14.4192 0 0 0 0 0 0 0 0 0 0 0 0 0 0 0 -17.0086 0 0 0 0 0 0 0 0 0 0 0 0 0 0 0 -25.4552 0 0 0 0 0 0 0 0 0 0 0 0 0 0 0 -72.4902 0 0 0 0 0 0 0 % Buoc 1 %tao ma tran 0 16x16 A = zeros(16); B = zeros(16);
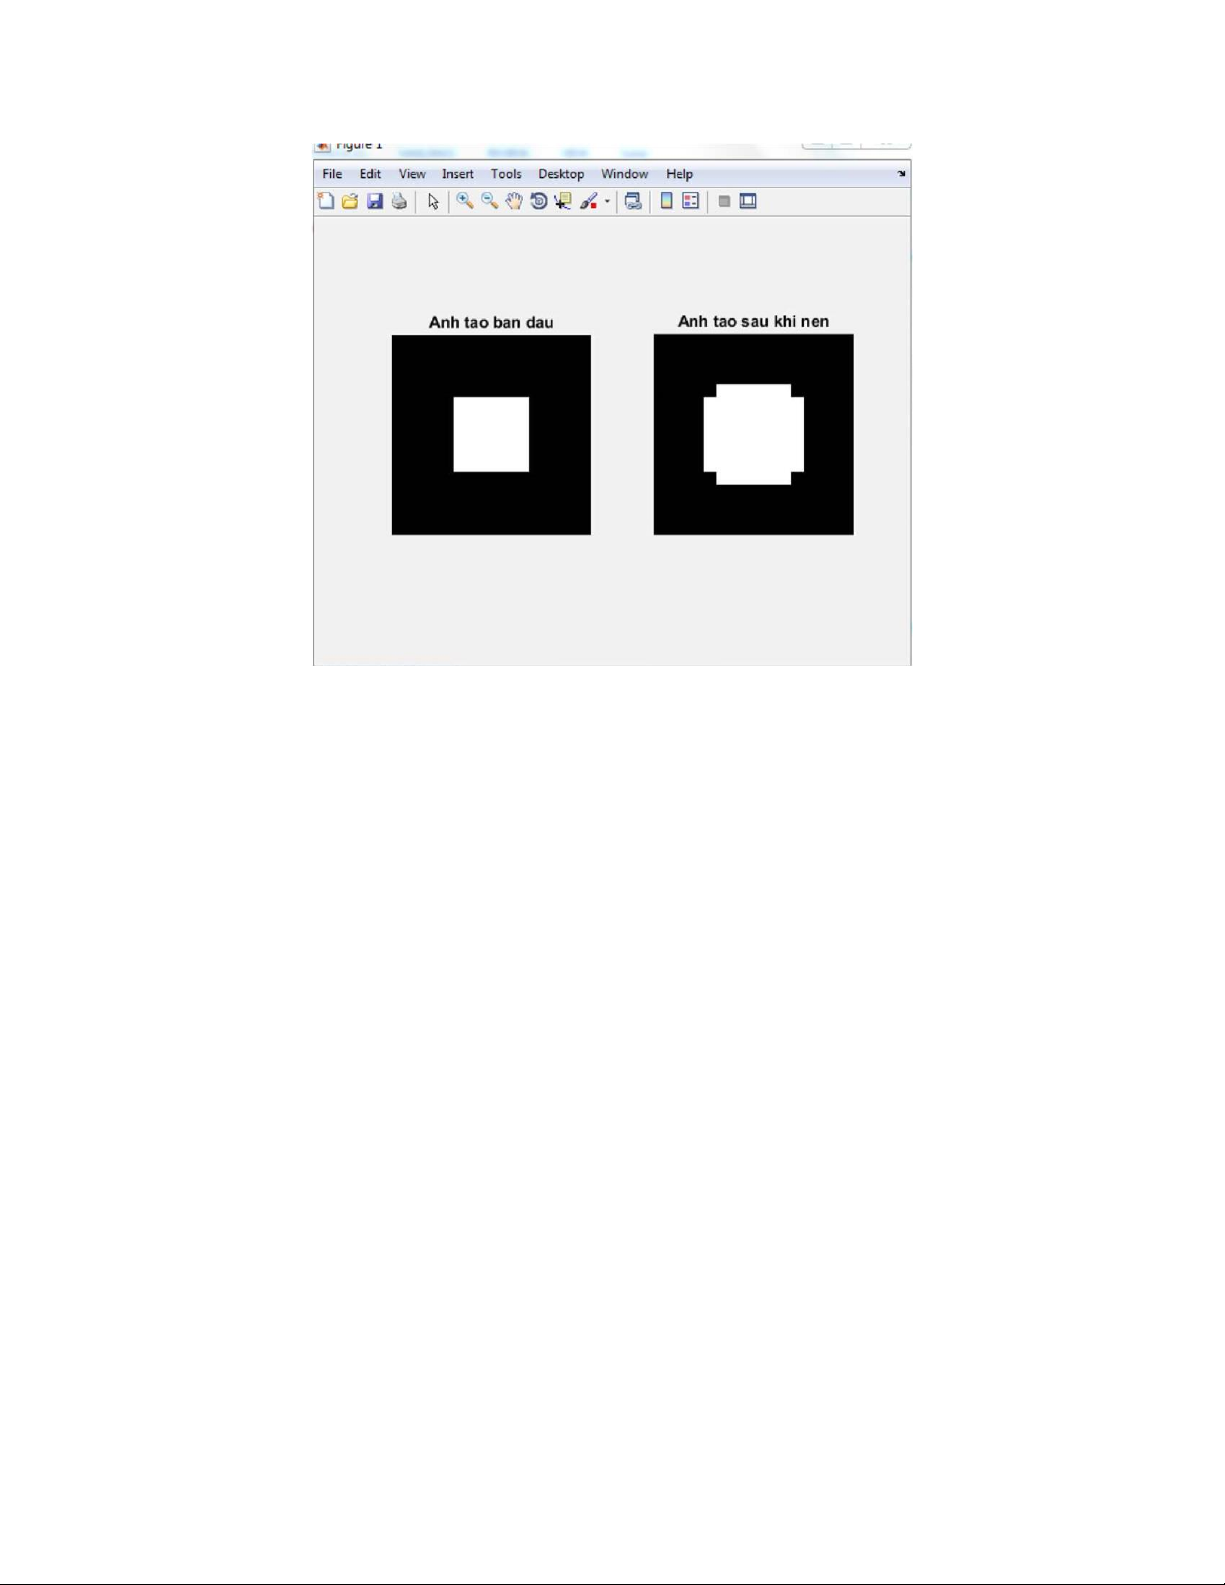
% Buoc 2 %tao ma tran A nhu yeu cau, hinh vuong mau trang A(6:11,6:11) = 255;
Ta thu được ma trận A =
[0,0,0,0,0,0,0,0,0,0,0,0,0,0,0,0;
0,0,0,0,0,0,0,0,0,0,0,0,0,0,0,0;
0,0,0,0,0,0,0,0,0,0,0,0,0,0,0,0;
0,0,0,0,0,0,0,0,0,0,0,0,0,0,0,0;
0,0,0,0,0,0,0,0,0,0,0,0,0,0,0,0;
0,0,0,0,0,0,0,0,0,0,0,0,0,0,0,0;
0,0,0,0,0,0,255,255,255,255,255,255,0,0,0,0;
190,0,0,0,0,0,255,255,255,255,255,255,0,0,0,0;
0,0,0,0,0,0,255,255,255,255,255,255,0,0,0,0;
0,0,0,0,0,0,255,255,255,255,255,255,0,0,0,0;
0,0,0,0,0,0,255,255,255,255,255,255,0,0,0,0;
0,0,0,0,0,0,255,255,255,255,255,255,0,0,0,0;
0,0,0,0,0,0,0,0,0,0,0,0,0,0,0,0;
0,0,0,0,0,0,0,0,0,0,0,0,0,0,0,0;
0,0,0,0,0,0,0,0,0,0,0,0,0,0,0,0;
0,0,0,0,0,0,0,0,0,0,0,0,0,0,0,0]; subplot(121);
imshow(A); title('anh tao ban dau'); A1 = A(1:8,1:8) ; A2 = A(1:8,9:16); A3 = A(9:16,1:8); A4 = A(9:16,9:16); A1_dct = dct2(A1); A2_dct = dct2(A2); A3_dct = dct2(A3); A4_dct = dct2(A4);
Q = [ 16 11 10 16 24 40 51 61; 12 12 14 19 26 58 60 55; 14 13 16 24 40 57 69 56; 14 17 22 29 51 87 80 62; 18 22 37 56 68 109 103 77; 24 35 55 64 81 104 113 92; 49 64 78 87 103 121 120 101; 72 92 95 96 112 100 103 99;]; A1_lt = A1_dct./Q; A2_lt = A2_dct./Q; A3_lt = A3_dct./Q; A4_lt = A4_dct./Q;
A1_I = idct2(A1_lt); A2_I = idct2(A2_lt);
A3_I = idct2(A3_lt); A4_I = idct2(A4_lt); B(1:8,1:8) = A1_I ; B(1:8,9:16) = A2_I; B(9:16,1:8)= A3_I; B(9:16,9:16) = A4_I;
subplot(122); imshow(B); title('anh tao sau khi nen');
MODULE 3. KỸ THUẬT TĂNG CƯỜNG CHẤT LƯỢNG HÌNH ẢNH SMQT
function A = alg_m(RGBimage,l,n)
[row, column, d] = size(RGBimage); if (d==3) HSVimage = rgb2hsv(RGBimage); V = HSVimage(:,:,3); else V
=double(RGBimage)/255; end V=V(:); [Vsorted, ix] = sort(V); s =
(row*column)/n; i=0; h=[]; while (i < n) i = i+1;
z = Vsorted(((floor(s*(i-1))+1)):floor(s*i));
Vstart = (s*(i-1))/(row*column); Vstop =
(s*i)/(row*column); r = z-z(1); f =
(1/n)/(r(size(r,1))); g = r*f;
if(isnan(g(1))) g = r + Vstop; else g = g + Vstart; end h=vertcat(h,g);
end m(ix) = h; m = m(:); if(d == 3)
HSVimage(:,:,3) = reshape(m,row,column);
A = hsv2rgb(HSVimage); else A =
reshape(m,row,column); end return; end
Cân bằng mức xám đồ Matlab function HistogramEqualization = alg_hm(OriginalImage) [row, column, d] =
size(OriginalImage); i = 0; while(iHistogramEqualization(:,:,i) = histeq(OriginalImage(:,:,i)); end end
Chức năng cần bằng mức xám đồ function Output = alg_h(Input) [row,
column, d] = size(Input); i = 0; while(i < d) i = i + 1;
histo = imhist(Input(:,:,i)); Input(:,:,i)
= double (Input(:,:,i)); probability =
histo./(row*column); equalizer =
cumsum(probability)*256; Output(:,:,i) =
equalizer(Input(:,:,i)+1); end Input = uint8(Input); Output = uint8(Output); End Biến đổi V
function A = alg_a(RGBimage, n)
[row, column, d] = size(RGBimage); if (d==3) HSVimage = rgb2hsv(RGBimage); V = HSVimage(:,:,3); else V
=double(RGBimage)/255; end V=V(:); [Vsorted, ix] = sort(V); s =
(row*column)/n; i=0; h=[]; while
(iint = Vsorted(((floor(s*(i-1))+1)):floor(s*i));
Vstart = (s*(i-1))/(row*column); Vstop = (s*i)/(row*column);
r=int-int(1); f = (1/n)/(r(size(r,1)));
g = r*f; if(isnan(g(1))) g = r + Vstop;
else g = g + Vstart; end h=vertcat(h,g);
end m(ix)=h; if(d==3) HSVimage(:,:,3) = reshape(m,row,column); A=hsv2rgb(HSVimage); else
A=reshape(m,row,column); end return; end Các hàm khác Chương trình chính function ImageEnhancement()
OriginalImage = imread('vegeta.jpg');
OriginalImage = uint8(OriginalImage);
img_m=alg_m(OriginalImage,1,8); img_h=alg_h(OriginalImage); img_hm=alg_hm(OriginalImage);
img_a1=alg_a(OriginalImage,1);
img_a10=alg_a(OriginalImage,10);
generalComp(OriginalImage,img_m,img_h,img_hm,img_a1,img_a10);
individualComp(OriginalImage,img_m,img_h,img_hm,img_a1,img_a10); end Chia thành phần RGB function
[yRed,xr,yGreen,xg,yBlue,xb]=splitRGB(image) Green = image(:,:,2); Blue = image(:,:,3); [yRed, xr] = imhist(Red); [yGreen, xg] = imhist(Green); [yBlue, xb] = imhist(Blue); End In lên màn hình
So sánh riêng giữa hình ảnh gốc và hình ảnh biến đổi function
individualComp(OriginalImage,img_m,img_h,img_hm,img_a1,img_a10)
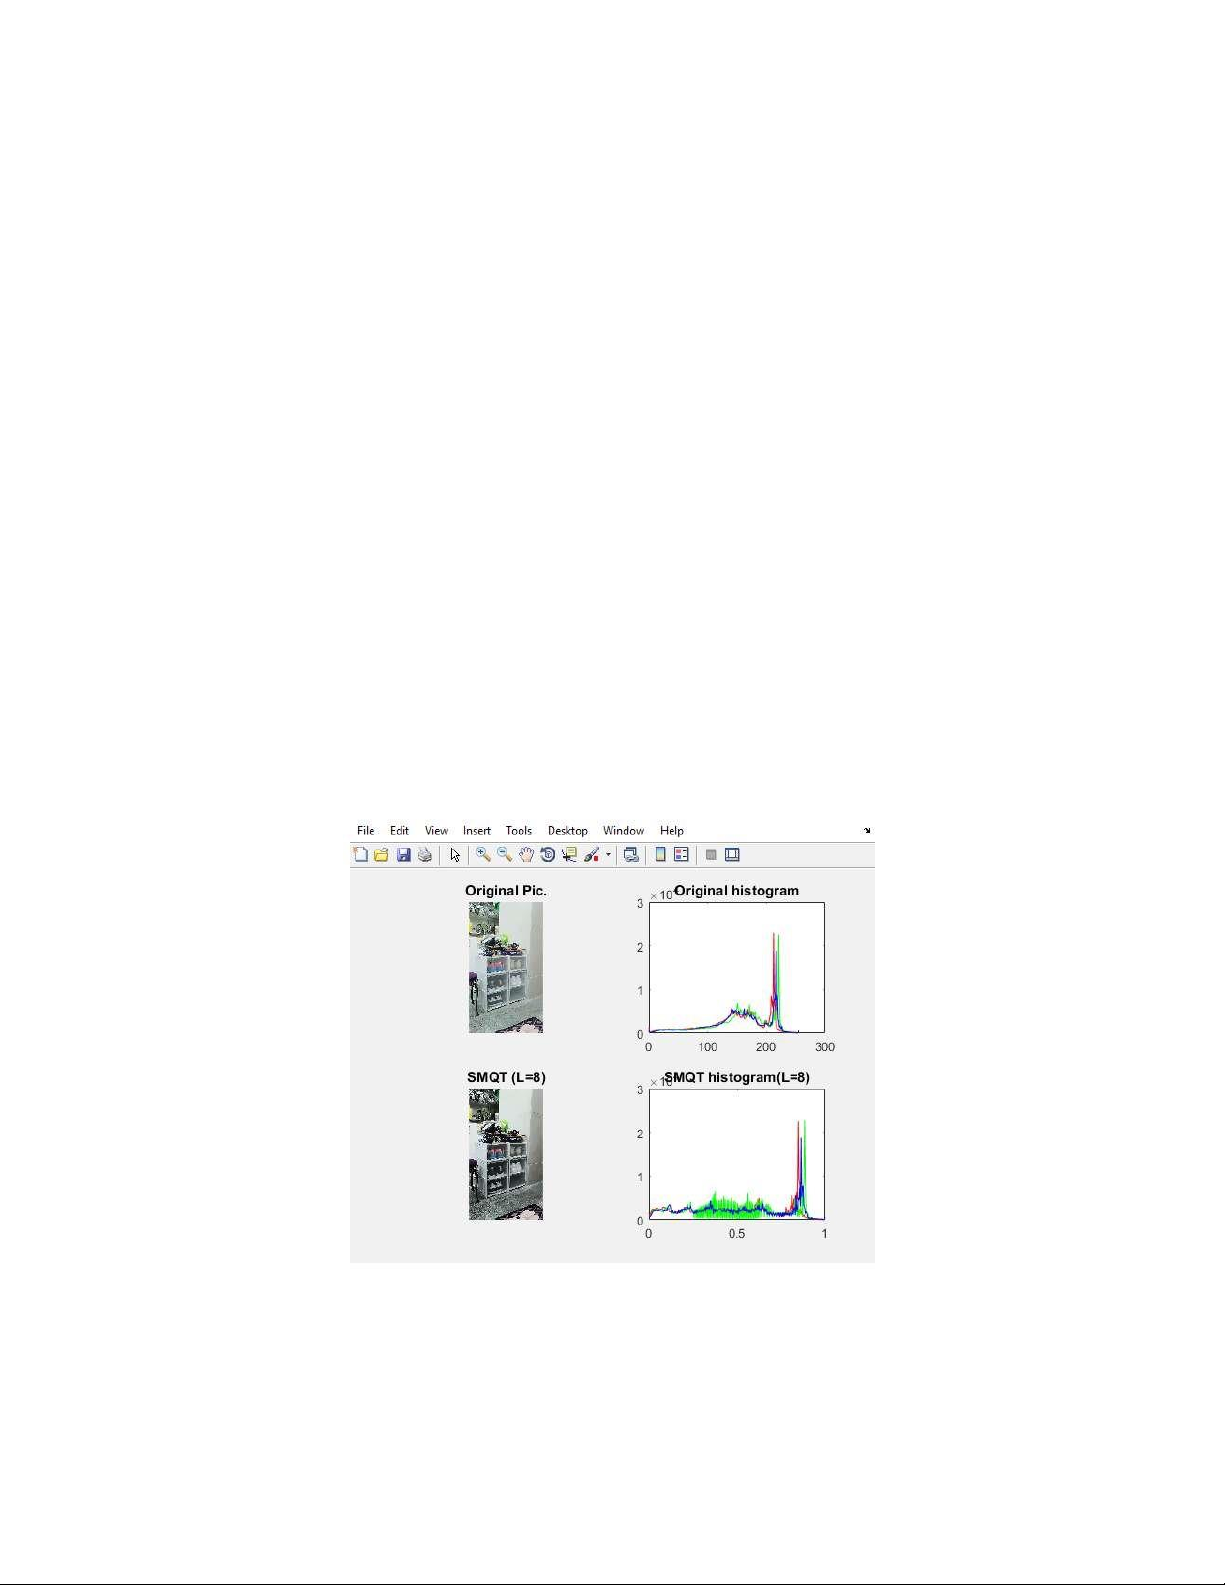
figure; subplot(2,2,1); imshow(OriginalImage); title('Original
Pic.'); subplot(2,2,3); imshow(img_m); title('SMQT (L=8)'); if
(size(OriginalImage,3)<=1) subplot(2,2,2);
imhist(OriginalImage); title('Original histogram');
subplot(2,2,4); imhist(img_m);
title('SMQT histogram(L=8)'); else
[yRed,xr,yGreen,xg,yBlue,xb]=splitRGB(OriginalImage); subplot(2,2,2);
plot(xr, yRed, 'r', xg, yGreen, 'g', xb, yBlue, 'b'); title('Original histogram');
[yRed,xr,yGreen,xg,yBlue,xb]=splitRGB(img_m); subplot(2,2,4);
plot(xr, yRed, 'Red', xg, yGreen, 'Green', xb, yBlue, 'Blue');
title('SMQT histogram(L=8)'); end figure; subplot(2,2,1);
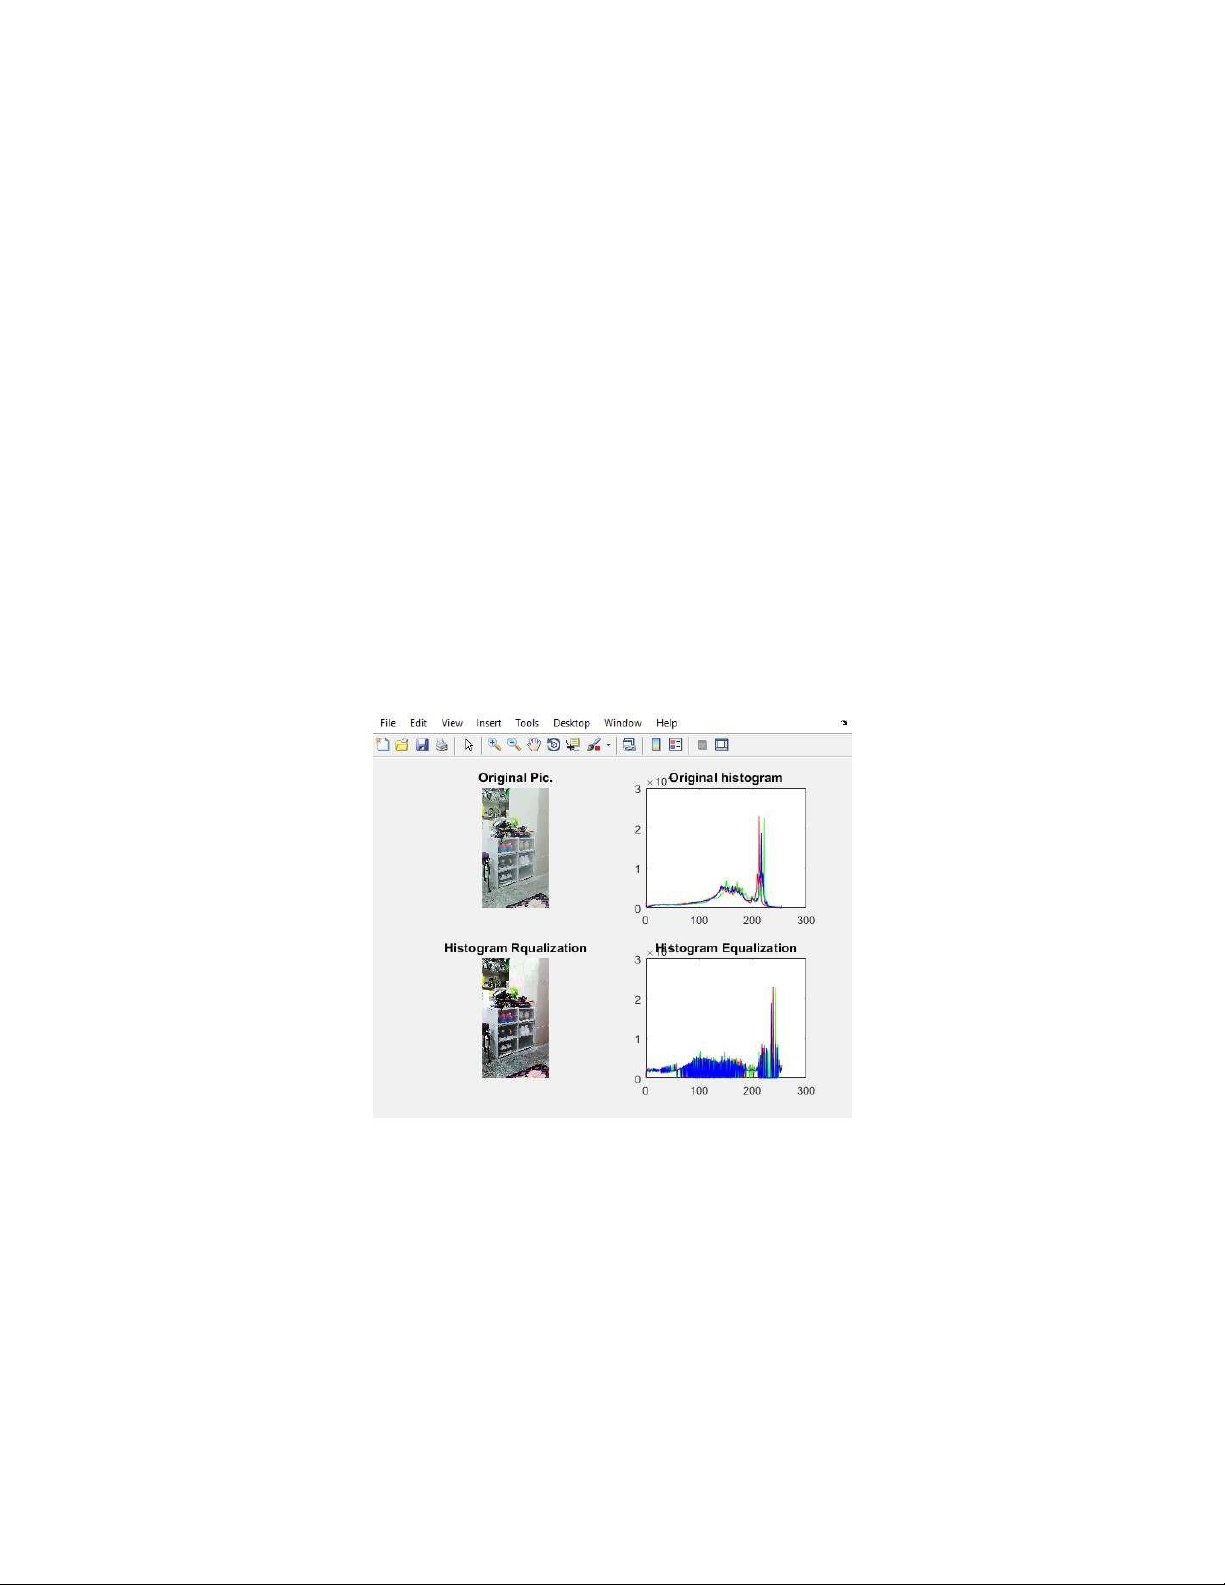
imshow(OriginalImage); title('Original Pic.'); subplot(2,2,3); imshow(img_h);
title('Histogram Equalization');
if (size(OriginalImage,3)<=1) subplot(2,2,2); imhist(OriginalImage); title('Original histogram');
subplot(2,2,4); imhist(img_h);
title('Histogram Equalization'); else
[yRed,xr,yGreen,xg,yBlue,xb]=splitRGB(OriginalImage); subplot(2,2,2);
plot(xr, yRed, 'r', xg, yGreen, 'g', xb, yBlue, 'b'); title('Original histogram');
[yRed,xr,yGreen,xg,yBlue,xb]=splitRGB(img_h); subplot(2,2,4);
plot(xr, yRed, 'Red', xg, yGreen, 'Green', xb, yBlue, 'Blue');
title('Histogram Equalization'); end figure; subplot(2,2,1);
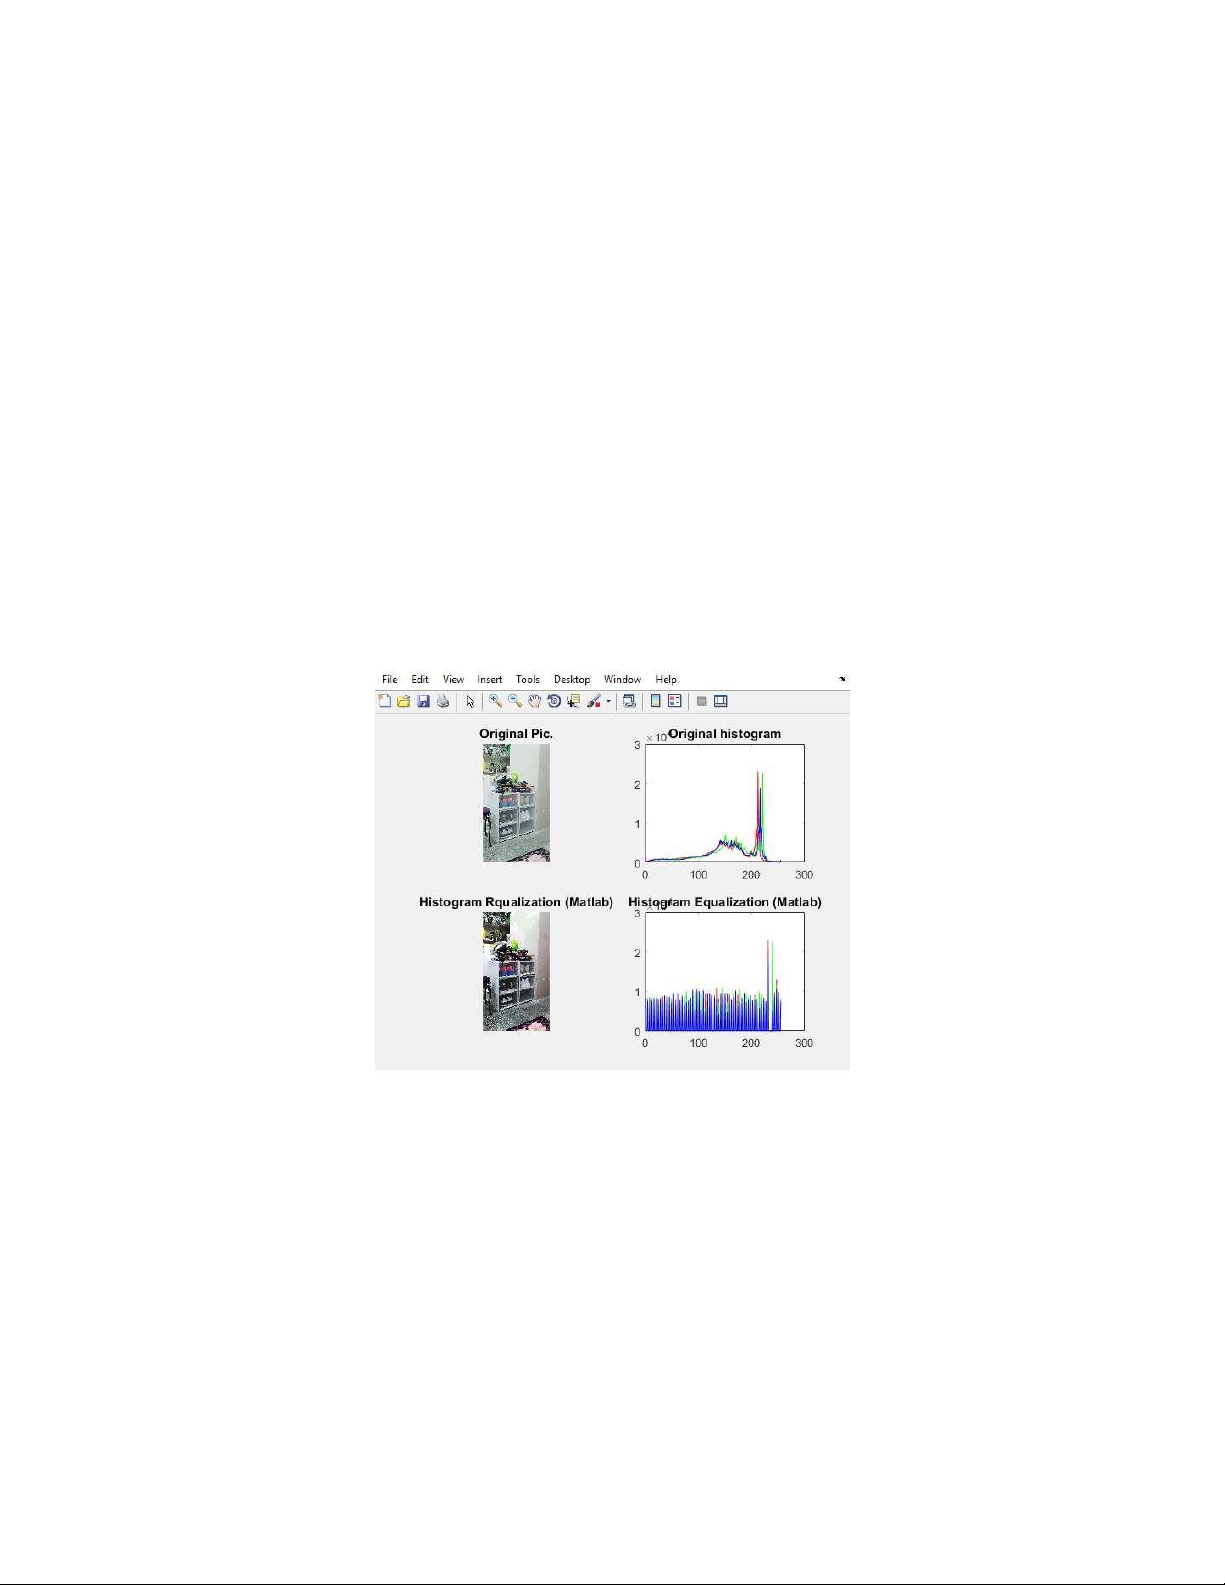
imshow(OriginalImage); title('Original Pic.'); subplot(2,2,3); imshow(img_hm);
title('Histogram Equalization (Matlab)');
if (size(OriginalImage,3)<=1)
subplot(2,2,2); imhist(OriginalImage); title('Original histogram');
subplot(2,2,4); imhist(img_hm);
title('Histogram Equalization (Matlab)'); else
[yRed,xr,yGreen,xg,yBlue,xb]=splitRGB(OriginalImage); subplot(2,2,2);
plot(xr, yRed, 'r', xg, yGreen, 'g', xb, yBlue, 'b'); title('Original histogram');
[yRed,xr,yGreen,xg,yBlue,xb]=splitRGB(img_hm); subplot(2,2,4);
plot(xr, yRed, 'Red', xg, yGreen, 'Green', xb, yBlue, 'Blue');
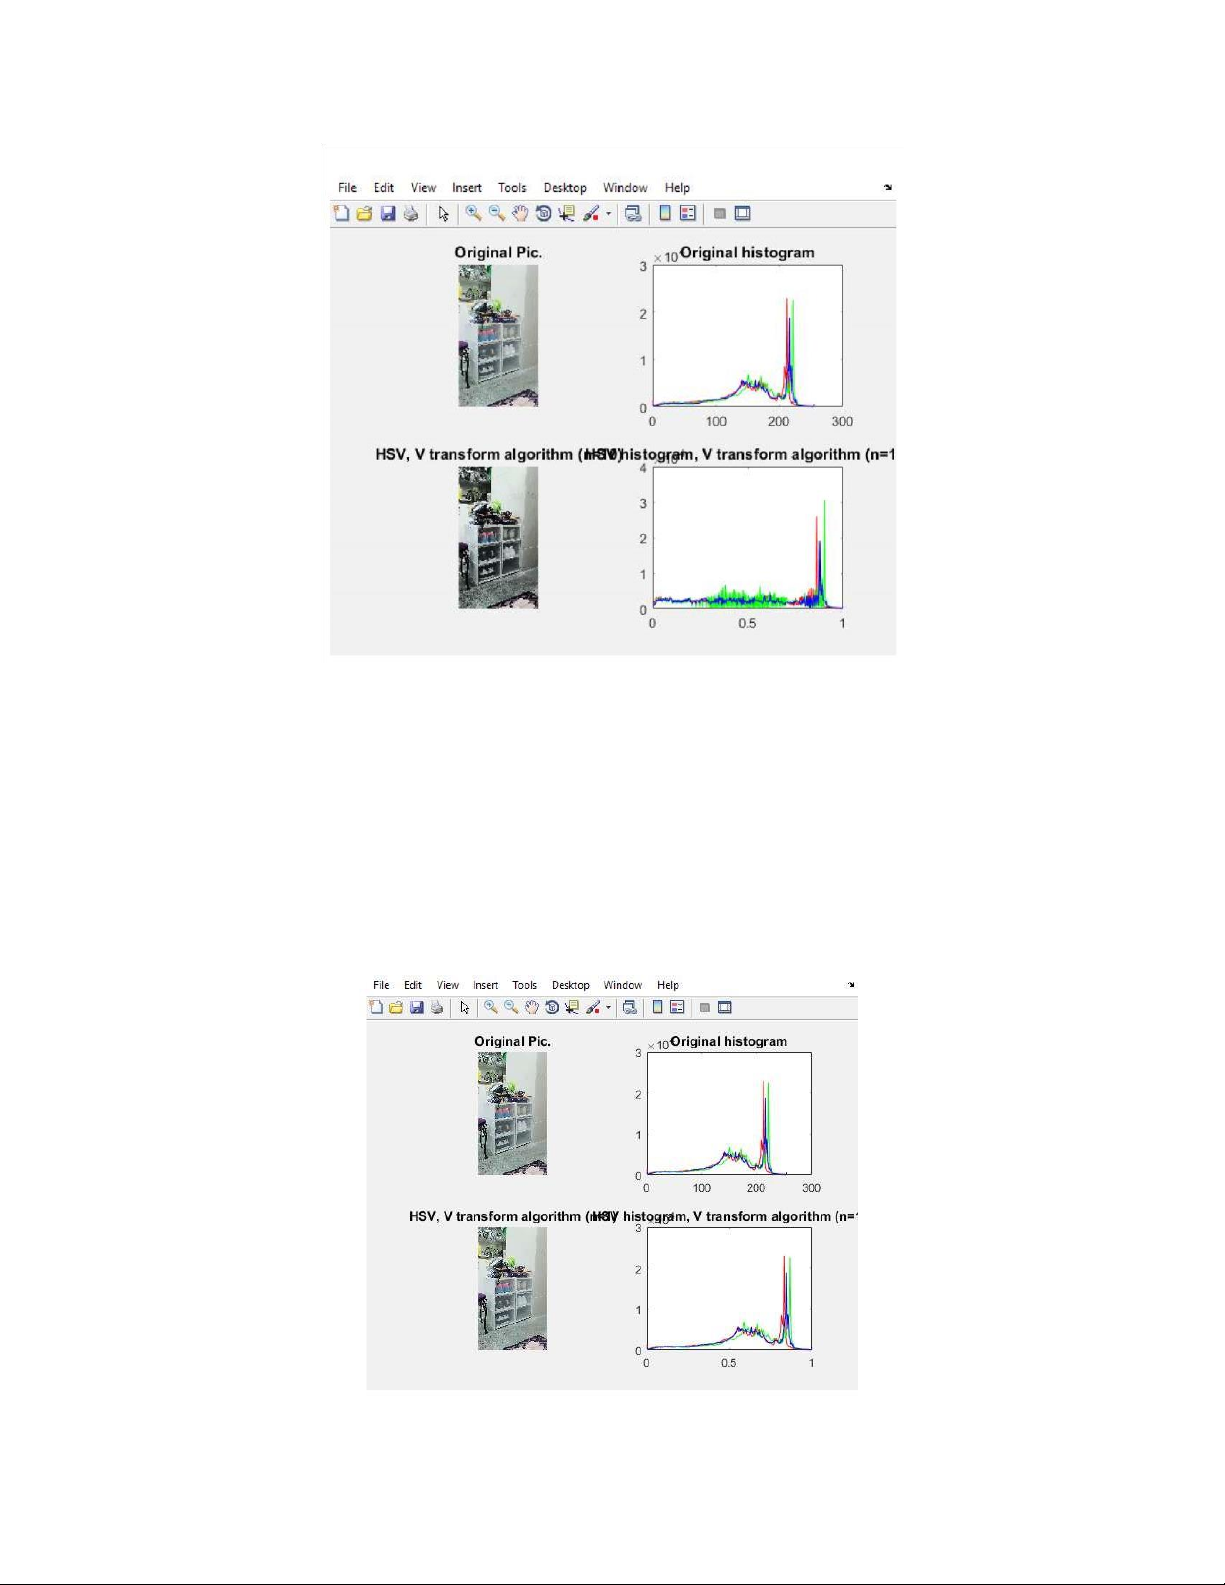
title('Histogram Equalization (Matlab)'); end figure; subplot(2,2,1); imshow(OriginalImage); title('Original Pic.'); subplot(2,2,3); imshow(img_a1);
title('HSV, V transform algorithm (n=1)');
if (size(OriginalImage,3)<=1)
subplot(2,2,2); imhist(OriginalImage); title('Original histogram');
subplot(2,2,4); imhist(img_a1);
title('HSV histogram, V transform algorithm (n=1)'); else
[yRed,xr,yGreen,xg,yBlue,xb]=splitRGB(OriginalImage); subplot(2,2,2);
plot(xr, yRed, 'r', xg, yGreen, 'g', xb, yBlue, 'b'); title('Original histogram');
[yRed,xr,yGreen,xg,yBlue,xb]=splitRGB(img_a1); subplot(2,2,4);
plot(xr, yRed, 'Red', xg, yGreen, 'Green', xb, yBlue, 'Blue');
title('HSV histogram, V transform algorithm (n=1)'); end figure; subplot(2,2,1); imshow(OriginalImage); title('Original Pic.'); subplot(2,2,3); imshow(img_a10);
title('HSV, V transform algorithm (n=10)');
if (size(OriginalImage,3)<=1) subplot(2,2,2); imhist(OriginalImage); title('Original histogram');
subplot(2,2,4); imhist(img_a10);
title('HSV histogram, V transform algorithm (n=10)'); else
[yRed,xr,yGreen,xg,yBlue,xb]=splitRGB(OriginalImage); subplot(2,2,2);
plot(xr, yRed, 'r', xg, yGreen, 'g', xb, yBlue, 'b'); title('Original histogram');
[yRed,xr,yGreen,xg,yBlue,xb]=splitRGB(img_a10); subplot(2,2,4);
plot(xr, yRed, 'Red', xg, yGreen, 'Green', xb, yBlue, 'Blue');
title('HSV histogram, V transform algorithm (n=10)'); end end
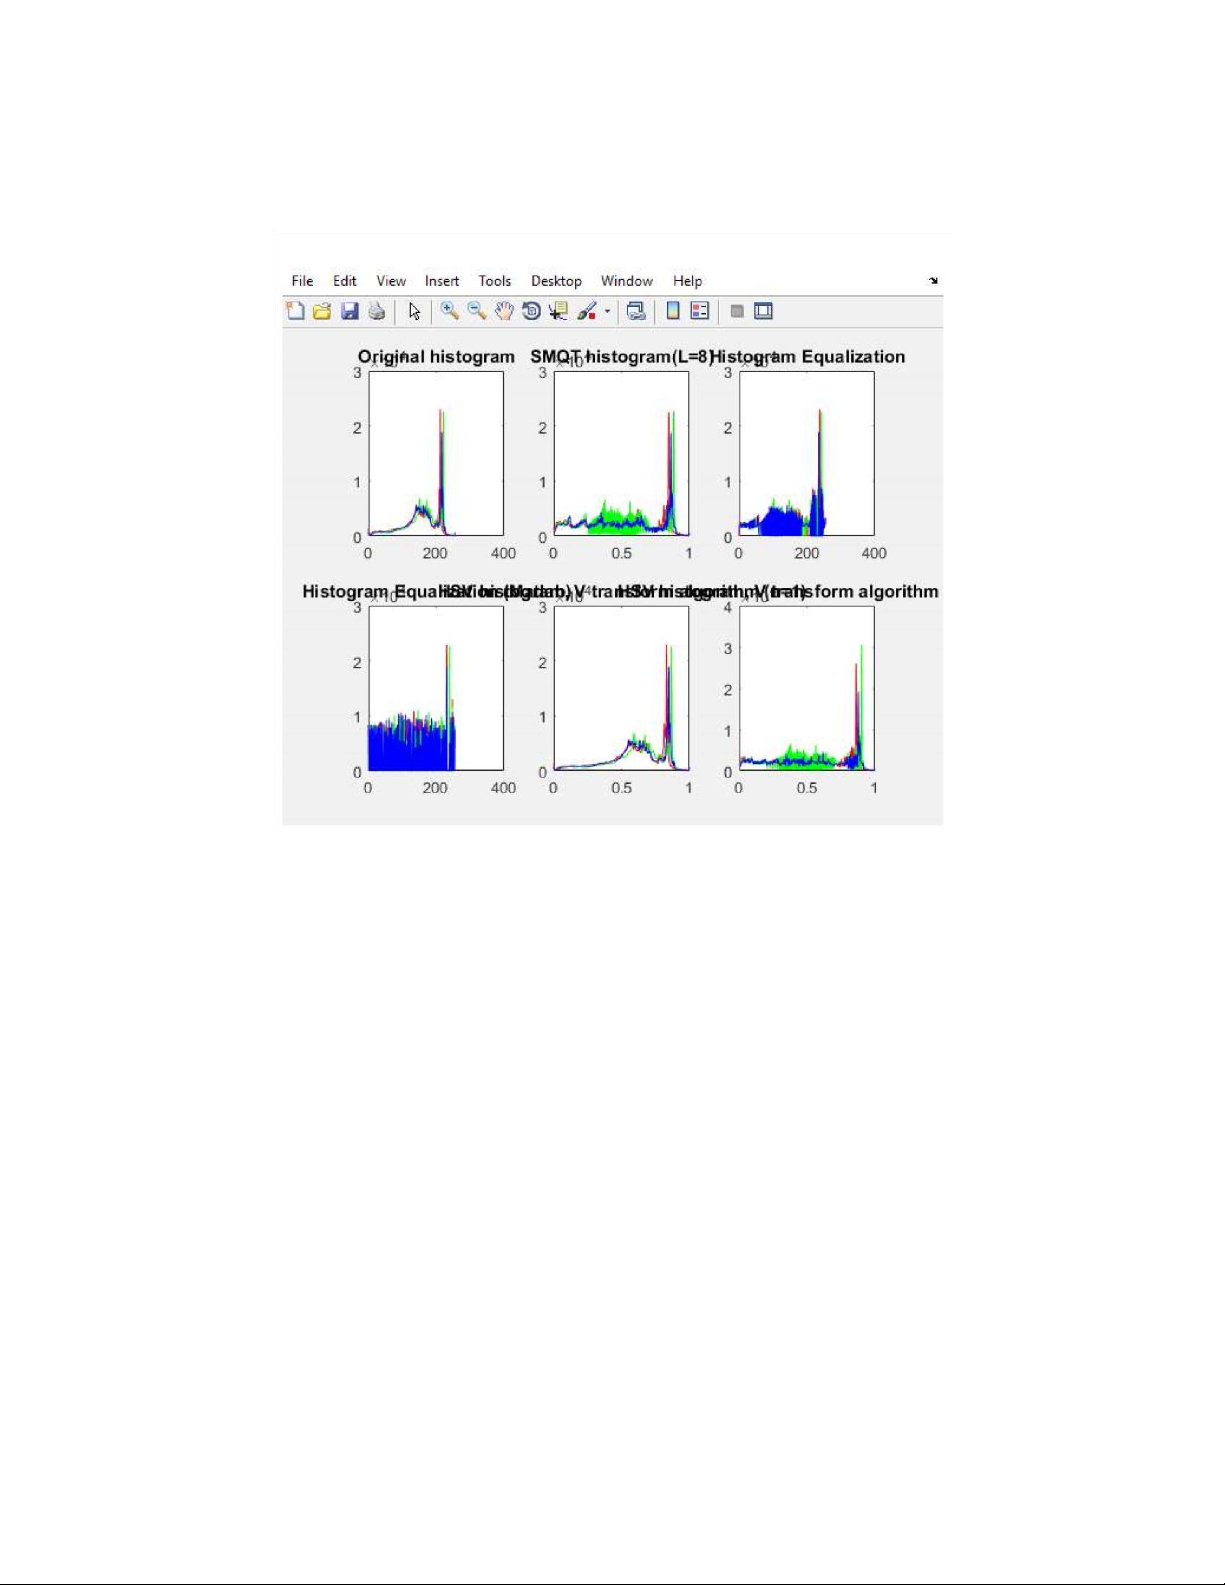
So sánh chung giữa hình ảnh gốc và tất cả hình ảnh biến đổi.
function generalComp(OriginalImage,img_m,img_h,img_hm,img_a1,img_a10)
figure; subplot(2,3,1); imshow(OriginalImage); title('Original
Pic.'); subplot(2,3,2); imshow(img_m); title('SMQT (L=8)');
subplot(2,3,3); imshow(img_h);
title('Histogram Equalization');
subplot(2,3,4); imshow(img_hm);
title('Histogram Equalization (Matlab)');
subplot(2,3,5); imshow(img_a1);
title('HSV, V transform algorithm (n=1)');
subplot(2,3,6); imshow(img_a10);
title('HSV, V transform algorithm (n=10)'); figure;
if (size(OriginalImage,3)<=1)
subplot(2,3,1); imhist(OriginalImage); title('Original histogram');
subplot(2,3,2); imhist(img_m); title('SMQT histogram(L=8)'); subplot(2,3,3); imhist(img_h); title('Histogram Equalization'); subplot(2,3,4); imhist(img_hm);
title('Histogram Equalization (Matlab)');
subplot(2,3,5); imhist(img_a1);
title('HSV histogram, V transform algorithm (n=1)');
subplot(2,3,6);imhist(img_a10);
title('HSV histogram, V transform algorithm (n=10)'); else
[yRed,xr,yGreen,xg,yBlue,xb]=splitRGB(OriginalImage); subplot(2,3,1);
plot(xr, yRed, 'r', xg, yGreen, 'g', xb, yBlue, 'b'); title('Original histogram');
[yRed,xr,yGreen,xg,yBlue,xb]=splitRGB(img_m); subplot(2,3,2);
plot(xr, yRed, 'Red', xg, yGreen, 'Green', xb, yBlue,'Blue'); title('SMQT histogram(L=8)');
[yRed,xr,yGreen,xg,yBlue,xb]=splitRGB(img_h); subplot(2,3,3);
plot(xr, yRed, 'Red', xg, yGreen, 'Green', xb, yBlue,'Blue');
title('Histogram Equalization');
[yRed,xr,yGreen,xg,yBlue,xb]=splitRGB(img_hm); subplot(2,3,4);
Tài liệu liên quan:
-

Bài tập lớn về Mã hóa dữ liệu đa phương tiện | Trường Đại học Bách Khoa Hà Nội
167 84 -
Báo cáo cuối kì Xây dựng chương trình điều khiển Notepad++ bằng giọng nói môn Đa phương tiện và các ứng dụng giải trí | Trường Đại học Bách Khoa Hà Nội
119 60 -
Đề cương tài liệu Việt Nhật môn Đa phương tiện và các ứng dụng giải trí | Trường Đại học Bách Khoa Hà Nội
98 49 -

Multimedia data compression & coding: NFW final report môn Đa phương tiện và các ứng dụng giải trí | Trường Đại học Bách Khoa Hà Nội
132 66