Các Kỹ Thuật Khai Thác Dữ Liệu và Ứng Dụng | Khai thác dữ liệu và ứng dụng | Trường Đại học Khoa học Tự nhiên, Đại học Quốc gia Hà Nội
A wide range of data mining techniques are being used by organizations to gain a better understanding of their customers and their operations and to solve com- plex organizational problems.In this chapter, we study data mining as an enabling technol- ogy for business analytics and predictive analytics, learn about the standard processes of conducting data mining projects, understand and build expertise in the use of major data mining techniques, develop awareness of the existing software tools, and explore privacy issues, common myths, and pitfalls that are often associated with data mining. Tài liệu được sưu tầm và soạn thảo dưới dạng file PDF để gửi tới các bạn cùng tham khảo, ôn tập đầy đủ kiến thức, chuẩn bị cho các buổi học thật tốt. Mời bạn đọc đón xem!
Môn: Khai thác dữ liệu và ứng dụng 11 tài liệu
Trường: Trường Đại học Khoa học tự nhiên, Đại học Quốc gia Hà Nội 1.1 K tài liệu
Tác giả:
Preview text:
C H A P T E R 4
Predictive Analytics I: Data Mining
Process, Methods, and Algorithms LEARNING OBJECTIVES
■ Define data mining as an enabling
■ Learn different methods and
technology for business analytics algorithms of data mining
■ Understand the objectives and ben-
■ Build awareness of the existing data efits of data mining mining software tools
■ Become familiar with the wide range
■ Understand the privacy issues, pitfalls, of applications of data mining and myths of data mining
■ Learn the standardized data mining processes
Generally speaking, data mining is a way to develop intelligence (i.e., actionable
information or knowledge) from data that an organization collects, organizes, and
stores. A wide range of data mining techniques are being used by organizations
to gain a better understanding of their customers and their operations and to solve com-
plex organizational problems. In this chapter, we study data mining as an enabling technol-
ogy for business analytics and predictive analytics, learn about the standard processes of
conducting data mining projects, understand and build expertise in the use of major data
mining techniques, develop awareness of the existing software tools, and explore privacy
issues, common myths, and pitfalls that are often associated with data mining.
4.1 Opening Vignette: Miami-Dade Police Department Is Using Predictive Analytics to Foresee and Fight Crime 216
4.2 Data Mining Concepts and Applications 219
4.3 Data Mining Applications 229 4.4 Data Mining Process 232 4.5 Data Mining Methods 241
4.6 Data Mining Software Tools 257
4.7 Data Mining Privacy Issues, Myths, and Blunders 263 215
216 Chapter 4 • Predictive Analytics I: Data Mining Process, Methods, and Algorithms 4.1
OPENING VIGNETTE: Miami-Dade Police
Department Is Using Predictive Analytics to Foresee and Fight Crime
Predictive analytics and data mining have become an integral part of many law enforce-
ment agencies including the Miami-Dade Police Department, whose mission is not only
to protect the safety of Florida’s largest county with 2.5 million citizens (making it the
seventh largest in the United States), but also to provide a safe and inviting climate for the
millions of tourists that come from around the world to enjoy the county’s natural beauty,
warm climate, and stunning beaches. With tourists spending nearly US$20 billion every
year and generating nearly a third of Florida’s sales taxes, it’s hard to overstate the impor-
tance of tourism to the region’s economy. So although few of the county’s police officers
would likely list economic development in their job description, nearly all grasp the vital
link between safe streets and the region’s tourist-driven prosperity.
That connection is paramount for Lieutenant Arnold Palmer, currently supervising
the Robbery Investigations Section, and a former supervisor of the department’s Robbery
Intervention Detail. This specialized team of detectives is focused on intensely policing
the county’s robbery hot spots and worst repeat offenders. He and the team occupy mod-
est offices on the second floor of a modern-looking concrete building, set back from a
palm-lined street on the western edge of Miami. In his 10 years in the unit, out of 23 in
total on the force, Palmer has seen a lot of changes. It’s not just in policing practices, like
the way his team used to mark street crime hot spots with colored pushpins on a map. Policing with Less
Palmer and the team have also seen the impact of a growing population, shifting demo-
graphics, and a changing economy on the streets they patrol. Like any good police force,
they’ve continually adapted their methods and practices to meet a policing challenge that
has grown in scope and complexity. But like nearly all branches of the county’s govern-
ment, intensifying budget pressures have placed the department in a squeeze between
rising demands and shrinking resources.
Palmer, who sees detectives as front-line fighters against a rising tide of street crime
and the looming prospect of ever-tightening resources, put it this way: “Our basic chal-
lenge was how to cut street crime even as tighter resources have reduced the number of
cops on the street.” Over the years, the team had been open to trying new tools, the most
notable of which was a program called “analysis-driven enforcement” that used crime his-
tory data as the basis for positioning teams of detectives. “We’ve evolved a lot since then in
our ability to predict where robberies are likely to occur, both through the use of analysis
and our own collective experience.” New Thinking on Cold Cases
The more confounding challenge for Palmer and his team of investigators, one shared with the
police of all major urban areas, is in closing the hardest cases, where leads, witnesses, video—
any facts or evidence that can help solve a case—are lacking. It’s not surprising, explains
Palmer, because “the standard practices we used to generate leads, like talking to informants
or to the community or to patrol officers, haven’t changed much, if at all,” says Palmer. “That
kind of an approach works okay, but it relies a lot on the experience our detectives carry in
their head. When the detectives retire or move on, that experience goes with them.”
Palmer’s conundrum was that turnover, due to the retirement of many of his most
experienced detectives, was on an upward trend. True, he saw the infusion of young
Chapter 4 • Predictive Analytics I: Data Mining Process, Methods, and Algorithms 217
blood as an inherently good thing, especially given their greater comfort with the new
types of information—from e-mails, social media, and traffic cameras, to name a few—that
his team had access to. But as Palmer recounts, the problem came when the handful of
new detectives coming into the unit turned to look for guidance from the senior officers
“and it’s just not there. We knew at that point we needed a different way to fill the experi- ence gap going forward.”
His ad hoc efforts to come up with a solution led to blue-sky speculation. What if
new detectives on the squad could pose the same questions to a computer database as
they would to a veteran detective? That speculation planted a seed in Palmer’s mind that wouldn’t go away. The Big Picture Starts Small
What was taking shape within the robbery unit demonstrated how big ideas can come
from small places. But more important, it showed that for these ideas to reach fruition,
the “right” conditions need to be in alignment at the right time. On a leadership level, that
means a driving figure in the organization who knows what it takes to nurture top-down
support as well as crucial bottom-up buy-in from the ranks, while at the same time keep-
ing the department’s information technology (IT) personnel on the same page. That per-
son was Palmer. At the organizational level, the robbery unit served as a particularly good
launching point for lead modeling because of the prevalence of repeat offenders among
perpetrators. Ultimately, the department’s ability to unleash the broader transformative
potential of lead modeling would hinge in large part on the team’s ability to deliver results on a smaller scale.
When early tests and demos proved encouraging—with the model yielding accurate
results when the details of solved cases were fed into it—the team started gaining atten-
tion. The initiative received a critical boost when the robbery bureau’s unit major and
captain voiced their support for the direction of the project, telling Palmer that “if you
can make this work, run with it.” But more important than the encouragement, Palmer
explains, was their willingness to advocate for the project among the department’s higher-
ups. “I can’t get it off the ground if the brass doesn’t buy in,” says Palmer. “So their support was crucial.” Success Brings Credibility
Having been appointed the official liaison between IT and the robbery unit, Palmer set
out to strengthen the case for the lead-modeling tool—now officially called Blue PALMS,
for Predictive Analytics Lead Modeling Software—by building up a series of successes.
His constituency was not only the department brass, but also the detectives whose sup-
port would be critical to its successful adoption as a robbery-solving tool. In his attempts
to introduce Blue PALMS, resistance was predictably stronger among veteran detectives,
who saw no reason to give up their long-standing practices. Palmer knew that dictates or
coercion wouldn’t win their hearts and minds. He would need to build a beachhead of credibility.
Palmer found that opportunity in one of his best and most experienced detectives.
Early in a robbery investigation, the detective indicated to Palmer that he had a strong
hunch who the perpetrator was and wanted, in essence, to test the Blue PALMS system.
So at the detective’s request, the department analyst fed key details of the crime into the
system, including the modus operandi, or MO. The system’s statistical models compared
these details to a database of historical data, looking for important correlations and simi-
larities in the crime’s signature. The report that came out of the process included a list of
20 suspects ranked in order of match strength, or likelihood. When the analyst handed the
218 Chapter 4 • Predictive Analytics I: Data Mining Process, Methods, and Algorithms
detective the report, his “hunch” suspect was listed in the top five. Soon after his arrest,
he confessed, and Palmer had gained a solid convert.
Though it was a useful exercise, Palmer realized that the true test wasn’t in confirm-
ing hunches but in breaking cases that had come to a dead end. Such was the situation
in a carjacking that had, in Palmer’s words, “no witnesses, no video and no crime scene—
nothing to go on.” When the senior detective on the stalled case went on leave after three
months, the junior detective to whom it was assigned requested a Blue PALMS report.
Shown photographs of the top people on the suspect list, the victim made a positive
identification of the suspect leading to the successful conclusion of the case. That suspect was number one on the list. Just the Facts
The success that Blue PALMS continues to build has been a major factor in Palmer’s suc-
cess in getting his detectives on board. But if there’s a part of his message that resonates
even more with his detectives, it’s the fact that Blue PALMS is designed not to change
the basics of policing practices, but to enhance them by giving them a second chance of
cracking the case. “Police work is at the core about human relations—about talking to
witnesses, to victims, to the community—and we’re not out to change that,” says Palmer.
“Our aim is to give investigators factual insights from information we already have that
might make a difference, so even if we’re successful 5% of the time, we’re going to take
a lot of offenders off the street.”
The growing list of cold cases solved has helped Palmer in his efforts to reinforce
the merits of Blue PALMS. But, in showing where his loyalty lies, he sees the detectives
who’ve closed these cold cases—not the program—as most deserving of the spotlight,
and that approach has gone over well. At his chief’s request, Palmer is beginning to use
his liaison role as a platform for reaching out to other areas in the Miami-Dade Police Department.
Safer Streets for a Smarter City
When he speaks of the impact of tourism, a thread that runs through Miami-Dade’s
Smarter Cities vision, Palmer sees Blue PALMS as an important tool to protect one of the
county’s greatest assets. “The threat to tourism posed by rising street crime was a big rea-
son the unit was established,” says Palmer. “The fact that we’re able to use analytics and
intelligence to help us close more cases and keep more criminals off the street is good
news for our citizens and our tourist industry.”
QUESTIONS FOR THE OPENING VIGNETTE
1. Why do law enforcement agencies and departments like Miami-Dade Police
Department embrace advanced analytics and data mining?
2. What are the top challenges for law enforcement agencies and departments like
Miami-Dade Police Department? Can you think of other challenges (not mentioned
in this case) that can benefit from data mining?
3. What are the sources of data that law enforcement agencies and departments like
Miami-Dade Police Department use for their predictive modeling and data mining projects?
4. What type of analytics do law enforcement agencies and departments like Miami-
Dade Police Department use to fight crime?
5. What does “the big picture starts small” mean in this case? Explain.
Chapter 4 • Predictive Analytics I: Data Mining Process, Methods, and Algorithms 219
What We Can Learn from This Vignette
The law enforcement agencies and departments are under tremendous pressure to carry
out their mission of safeguarding people with limited resources. The environment within
which they perform their duties is becoming increasingly more challenging so that they
have to constantly adopt and perhaps stay a few steps ahead to prevent the likelihood
of catastrophes. Understanding the changing nature of crime and criminals is an ongoing
challenge. In the midst of these challenges, what works in favor of these agencies is the
availability of the data and analytics technologies to better analyze past occurrences and
to foresee future events. Data has become available more than it has in the past. Applying
advanced analytics and data mining tools (i.e., knowledge discovery techniques) to these
large and rich data sources provides them with the insight that they need to better pre-
pare and act on their duties. Therefore, law enforcement agencies are becoming one of
the leading users of the new face of analytics. Data mining is a prime candidate for bet-
ter understanding and management of these mission critical tasks with a high level of
accuracy and timeliness. The study described in the opening vignette clearly illustrates
the power of analytics and data mining to create a holistic view of the world of crime and
criminals for better and faster reaction and management. In this chapter, you will see a
wide variety of data mining applications solving complex problems in a variety of indus-
tries and organizational settings where the data is used to discover actionable insight to
improve mission readiness, operational efficiency, and competitive advantage.
Sources: Miami-Dade Police Department: Predictive modeling pinpoints likely suspects based on common crime
signatures of previous crimes, IBM Customer Case Studies, www-03.ibm.com/software/businesscasestudies/om/
en/corp?synkey=C894638H25952N07; Law Enforcement Analytics: Intelligence-Led and Predictive Policing by
Information Builder www.informationbuilders.com/solutions/gov-lea. 4.2
Data Mining Concepts and Applications
Data mining, a new and exciting technology of only a few years ago, has become a com-
mon practice for a vast majority of organizations. In an interview with Computerworld
magazine in January 1999, Dr. Arno Penzias (Nobel laureate and former chief scientist
of Bell Labs) identified data mining from organizational databases as a key application
for corporations of the near future. In response to Computerworld’s age-old question of
“What will be the killer applications in the corporation?” Dr. Penzias replied: “Data min-
ing.” He then added, “Data mining will become much more important and companies
will throw away nothing about their customers because it will be so valuable. If you’re
not doing this, you’re out of business.” Similarly, in an article in Harvard Business Review,
Thomas Davenport (2006) argued that the latest strategic weapon for companies is ana-
lytical decision making, providing examples of companies such as Amazon.com, Capital
One, Marriott International, and others that have used analytics to better understand their
customers and optimize their extended supply chains to maximize their returns on invest-
ment while providing the best customer service. This level of success is highly depend-
ent on a company understanding its customers, vendors, business processes, and the
extended supply chain very well.
A large portion of “understanding the customer” can come from analyzing the vast
amount of data that a company collects. The cost of storing and processing data has
decreased dramatically in the recent past, and, as a result, the amount of data stored in
electronic form has grown at an explosive rate. With the creation of large databases, the
possibility of analyzing the data stored in them has emerged. The term data mining was
originally used to describe the process through which previously unknown patterns in
data were discovered. This definition has since been stretched beyond those limits by
220 Chapter 4 • Predictive Analytics I: Data Mining Process, Methods, and Algorithms
some software vendors to include most forms of data analysis in order to increase sales
with the popularity of the data mining label. In this chapter, we accept the original defini- tion of data mining.
Although the term data mining is relatively new, the ideas behind it are not. Many
of the techniques used in data mining have their roots in traditional statistical analysis and
artificial intelligence work done since the early part of the 1980s. Why, then, has it sud-
denly gained the attention of the business world? Following are some of most pronounced reasons:
• More intense competition at the global scale driven by customers’ ever-changing
needs and wants in an increasingly saturated marketplace.
• General recognition of the untapped value hidden in large data sources.
• Consolidation and integration of database records, which enables a single view of
customers, vendors, transactions, and so on.
• Consolidation of databases and other data repositories into a single location in the form of a data warehouse.
• The exponential increase in data processing and storage technologies.
• Significant reduction in the cost of hardware and software for data storage and processing.
• Movement toward the demassification (conversion of information resources into
nonphysical form) of business practices.
Data generated by the Internet is increasing rapidly in both volume and complexity.
Large amounts of genomic data are being generated and accumulated all over the world.
Disciplines such as astronomy and nuclear physics create huge quantities of data on a
regular basis. Medical and pharmaceutical researchers constantly generate and store data
that can then be used in data mining applications to identify better ways to accurately
diagnose and treat illnesses and to discover new and improved drugs.
On the commercial side, perhaps the most common use of data mining has been
in the finance, retail, and healthcare sectors. Data mining is used to detect and reduce
fraudulent activities, especially in insurance claims and credit card use (Chan et al., 1999);
to identify customer buying patterns (Hoffman, 1999); to reclaim profitable customers
(Hoffman, 1998); to identify trading rules from historical data; and to aid in increased
profitability using market-basket analysis. Data mining is already widely used to better tar-
get clients, and with the widespread development of e-commerce, this can only become
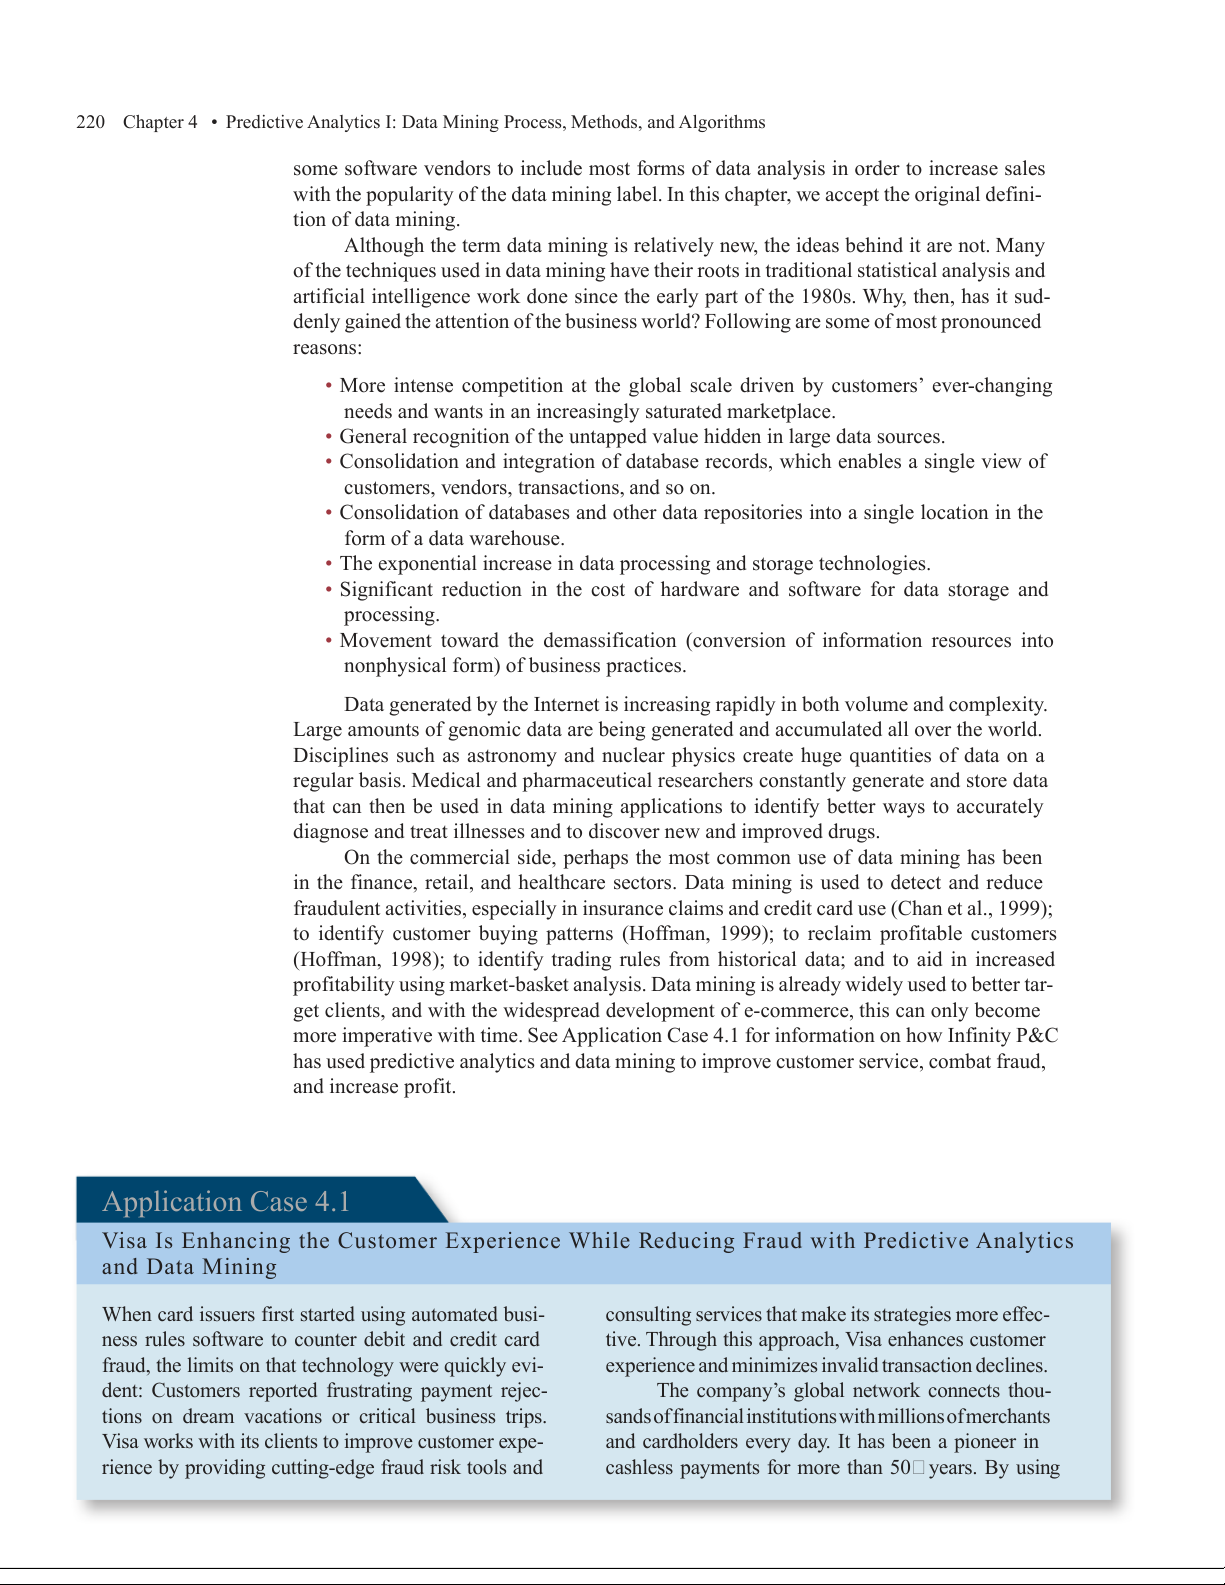
more imperative with time. See Application Case 4.1 for information on how Infinity P&C
has used predictive analytics and data mining to improve customer service, combat fraud, and increase profit. Application Case 4.1
Visa Is Enhancing the Customer Experience While Reducing Fraud with Predictive Analytics and Data Mining
When card issuers first started using automated busi-
consulting services that make its strategies more effec-
ness rules software to counter debit and credit card
tive. Through this approach, Visa enhances customer
fraud, the limits on that technology were quickly evi-
experience and minimizes invalid transaction declines.
dent: Customers reported frustrating payment rejec-
The company’s global network connects thou-
tions on dream vacations or critical business trips.
sands of financial institutions with millions of merchants
Visa works with its clients to improve customer expe-
and cardholders every day. It has been a pioneer in
rience by providing cutting-edge fraud risk tools and
cashless payments for more than 50 years. By using
Chapter 4 • Predictive Analytics I: Data Mining Process, Methods, and Algorithms 221
SAS® Analytics, Visa is supporting financial institutions
How Can Using In-Memory Analytics Make
to reduce fraud without upsetting customers with a Difference?
unnecessary payment rejections. Whenever it pro-
cesses a transaction, Visa analyzes up to 500 unique
In a recent proof-of-concept, Visa used a high-
variables in real time to assess the risk of that transac-
performance solution from SAS that relies on
tion. Using vast data sets, including global fraud hot
in-memory computing to power statistical and
spots and transactional patterns, the company can
machine-learning algorithms and then present the
more accurately assess whether you’re buying escar-
information visually. In-memory analytics reduces
got in Paris, or someone who stole your credit card is.
the need to move data and perform more model
“What that means is that if you are likely to
iterations, making it much faster and accurate.
travel we know it, and we tell your financial insti-
Falkenborg describes the solution as like
tution so you’re not declined at the point of sale,”
having the information memorized, versus having
says Nathan Falkenborg, Head of Visa Performance
to get up and go to a filing cabinet to retrieve it.
Solutions for North Asia. “We also will assist your
“In-memory analytics is just taking your brain and
bank in developing the right strategies for using the
making it bigger. Everything is instantly accessible.”
Visa tools and scoring systems,” he adds. Visa esti-
Ultimately, solid analytics helps the company
mates that Big Data analytics works; state-of-the-art
do more than just process payments. “We can deepen
models and scoring systems have the potential to
the client conversation and serve our clients even
prevent an incremental $2 billion of fraudulent pay-
better with our incredible big data set and expertise ment volume annually.
in mining transaction data,” says Falkenborg. “We
A globally recognized name, Visa facilitates
use our consulting and analytics capabilities to assist
electronic funds transfer through branded products
our clients in tackling business challenges and pro-
that are issued by its thousands of financial institu-
tect the payment ecosystem. And that’s what we do
tion partners. The company processed 64.9 billion
with high-performance analytics.”
transactions in 2014, and $4.7 trillion in purchases
“The challenge that we have, as with any com-
were made with a Visa card in that same year.
pany managing and using massive data sets, is how
It has the computing capability to process
we use all necessary information to solve a busi-
56,000 transaction messages per second, which is
ness challenge—whether that is improving our fraud
greater than four times the actual peak transaction
models, or assisting a client to more effectively com-
rate to date. Visa doesn’t just process and compute—
municate with its customers,” elaborates Falkenborg.
it is continually using analytics to share strategic and
“In-memory analytics enables us to be more nim-
operational insights with its partner financial institu- ble; with a 100
* analytical system processing speed
tions and assist them in improving performance. This
improvement, our data and decision scientists can
business goal is supported by a robust data manage- iterate much faster.”
ment system. Visa also assists its clients in improv-
Fast and accurate predictive analytics allows
ing performance by developing and delivering deep
Visa to better serve clients with tailored consulting analytical insight.
services, helping them succeed in today’s fast-
“We understand patterns of behavior by per- changing payments industry.
forming clustering and segmentation at a granular QUESTIONS FOR DISCUSSION
level, and we provide this insight to our financial
1. What challenges were Visa and the rest of the
institution partners,” says Falkenborg. “It’s an effec- credit card industry facing?
tive way to help our clients communicate better and
deepen their understanding of the customer.”
2. How did Visa improve customer service while also
As an example of marketing support, Visa has improving retention of fraud?
assisted clients globally in identifying segments of
3. What is in-memory analytics, and why was it
customers that should be offered a different Visa necessary?
product. “Understanding the customer lifecycle is
incredibly important, and Visa provides information
Source: “Enhancing the customer experience while reducing
fraud (SAS® Analytics) - High-performance analytics empowers
to clients that help them take action and offer the
Visa to enhance customer experience while reducing debit and
right product to the right customer before a value
credit card fraud.” Copyright © 2016 SAS Institute Inc., Cary, NC,
proposition becomes stale,” says Falkenborg.
USA. Reprinted with permission. All rights reserved.
222 Chapter 4 • Predictive Analytics I: Data Mining Process, Methods, and Algorithms
Definitions, Characteristics, and Benefits
Simply defined, data mining is a term used to describe discovering or “mining” knowl-
edge from large amounts of data. When considered by analogy, one can easily realize
that the term data mining is a misnomer; that is, mining of gold from within rocks or dirt
is referred to as “gold” mining rather than “rock” or “dirt” mining. Therefore, data mining
perhaps should have been named “knowledge mining” or “knowledge discovery.” Despite
the mismatch between the term and its meaning, data mining has become the choice of
the community. Many other names that are associated with data mining include knowledge
extraction, pattern analysis, data archaeology, information harvesting, pattern searching, and data dredging.
Technically speaking, data mining is a process that uses statistical, mathematical,
and artificial intelligence techniques to extract and identify useful information and subse-
quent knowledge (or patterns) from large sets of data. These patterns can be in the form
of business rules, affinities, correlations, trends, or prediction models (see Nemati and
Barko, 2001). Most literature defines data mining as “the nontrivial process of identifying
valid, novel, potentially useful, and ultimately understandable patterns in data stored in
structured databases,” where the data are organized in records structured by categorical,
ordinal, and continuous variables (Fayyad et al., 1996, pp. 40–41). In this definition, the
meanings of the key term are as follows:
• Process implies that data mining comprises many iterative steps.
• Nontrivial means that some experimentation-type search or inference is involved;
that is, it is not as straightforward as a computation of predefined quantities.
• Valid means that the discovered patterns should hold true on new data with a suf- ficient degree of certainty.
• Novel means that the patterns are not previously known to the user within the con-
text of the system being analyzed.
• Potentially useful means that the discovered patterns should lead to some benefit to the user or task.
• Ultimately understandable means that the pattern should make business sense that
leads to the user saying, “Mmm! It makes sense; why didn’t I think of that,” if not
immediately, at least after some postprocessing.
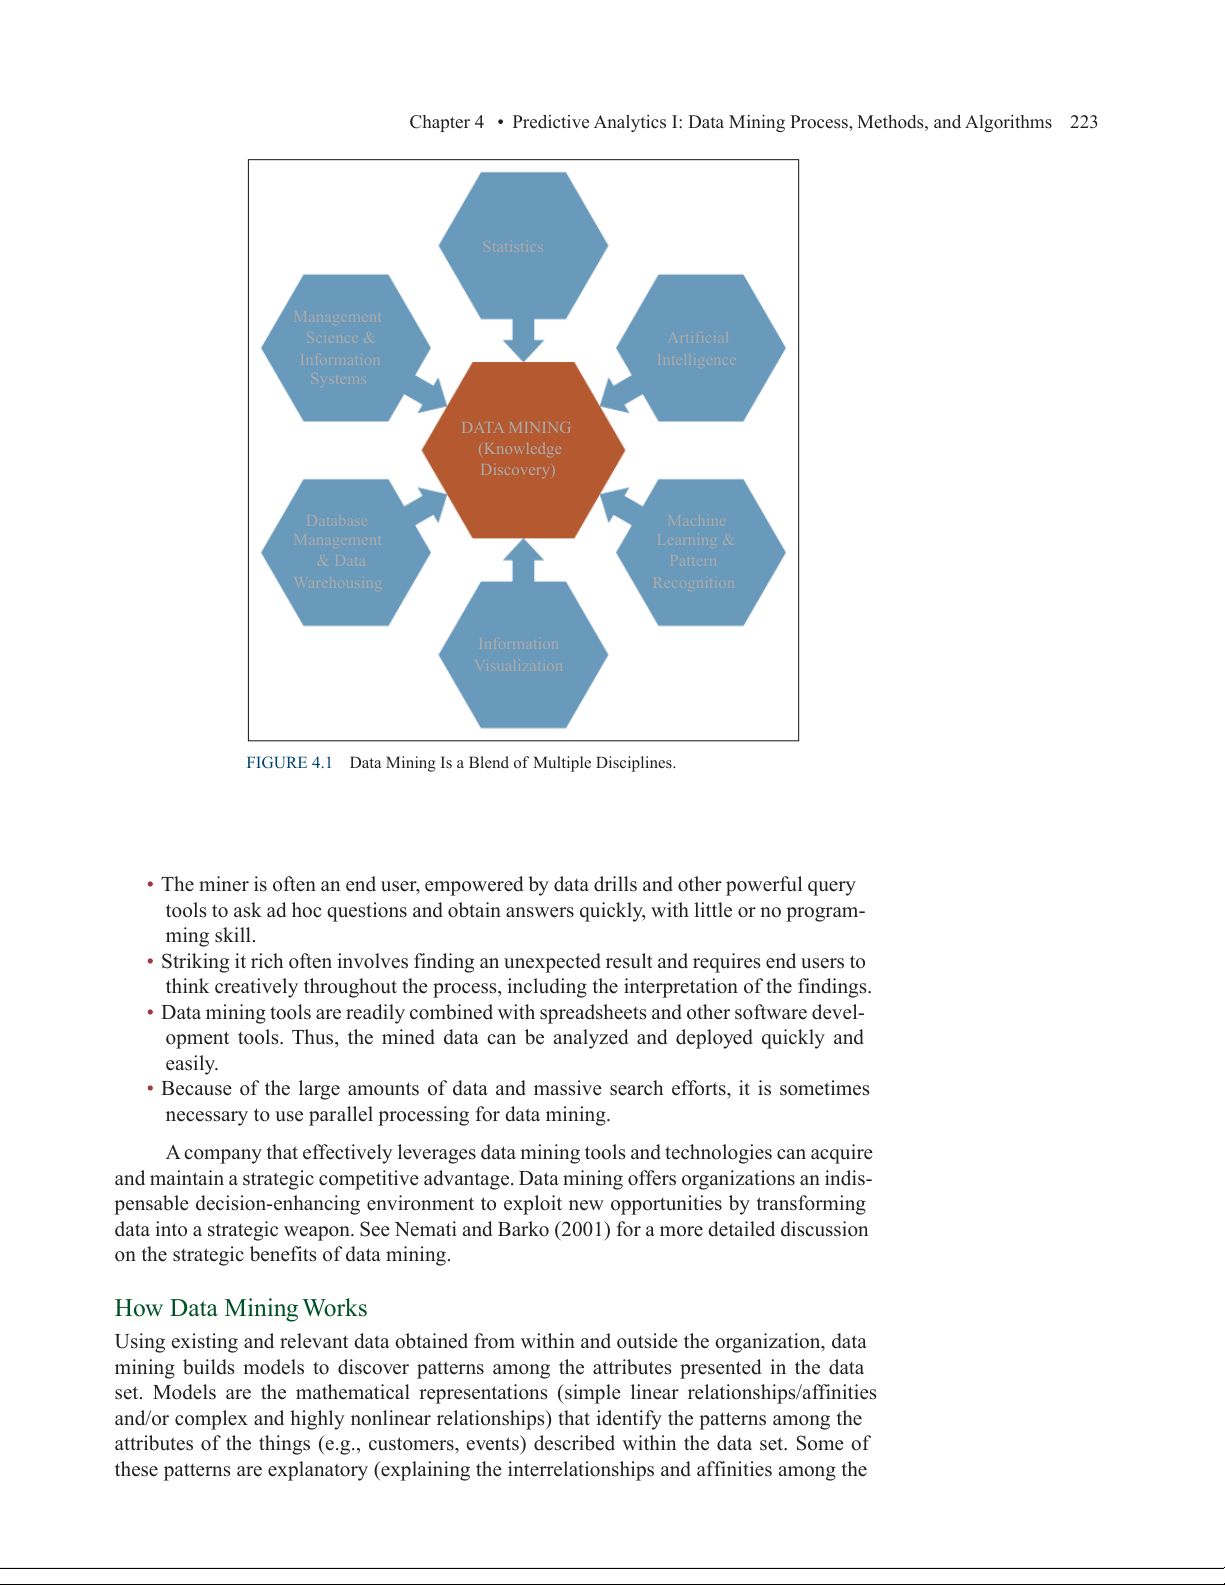
Data mining is not a new discipline, but rather a new definition for the use of many
disciplines. Data mining is tightly positioned at the intersection of many disciplines, includ-
ing statistics, artificial intelligence, machine learning, management science, information
systems (IS), and databases (see Figure 4.1). Using advances in all of these disciplines, data
mining strives to make progress in extracting useful information and knowledge from large
databases. It is an emerging field that has attracted much attention in a very short time.
The following are the major characteristics and objectives of data mining:
• Data are often buried deep within very large databases, which sometimes contain
data from several years. In many cases, the data are cleansed and consolidated into
a data warehouse. Data may be presented in a variety of formats (see Chapter 2 for a brief taxonomy of data).
• The data mining environment is usually a client/server architecture or a Web-based IS architecture.
• Sophisticated new tools, including advanced visualization tools, help to remove
the information ore buried in corporate files or archival public records. Finding
it involves massaging and synchronizing the data to get the right results. Cutting-
edge data miners are also exploring the usefulness of soft data (i.e., unstructured
text stored in such places as Lotus Notes databases, text files on the Internet, or enterprise-wide intranets).
Chapter 4 • Predictive Analytics I: Data Mining Process, Methods, and Algorithms 223 Statistics Management Science & Artificial Information Intelligence Systems DATA MINING (Knowledge Discovery) Database Machine Management Learning & & Data Pattern Warehousing Recognition Information Visualization
FIGURE 4.1 Data Mining Is a Blend of Multiple Disciplines.
• The miner is often an end user, empowered by data drills and other powerful query
tools to ask ad hoc questions and obtain answers quickly, with little or no program- ming skill.
• Striking it rich often involves finding an unexpected result and requires end users to
think creatively throughout the process, including the interpretation of the findings.
• Data mining tools are readily combined with spreadsheets and other software devel-
opment tools. Thus, the mined data can be analyzed and deployed quickly and easily.
• Because of the large amounts of data and massive search efforts, it is sometimes
necessary to use parallel processing for data mining.
A company that effectively leverages data mining tools and technologies can acquire
and maintain a strategic competitive advantage. Data mining offers organizations an indis-
pensable decision-enhancing environment to exploit new opportunities by transforming
data into a strategic weapon. See Nemati and Barko (2001) for a more detailed discussion
on the strategic benefits of data mining. How Data Mining Works
Using existing and relevant data obtained from within and outside the organization, data
mining builds models to discover patterns among the attributes presented in the data
set. Models are the mathematical representations (simple linear relationships/affinities
and/or complex and highly nonlinear relationships) that identify the patterns among the
attributes of the things (e.g., customers, events) described within the data set. Some of
these patterns are explanatory (explaining the interrelationships and affinities among the
224 Chapter 4 • Predictive Analytics I: Data Mining Process, Methods, and Algorithms
attributes), whereas others are predictive (foretelling future values of certain attributes). In
general, data mining seeks to identify four major types of patterns:
1. Associations find the commonly co-occurring groupings of things, such as beer and
diapers going together in market-basket analysis.
2. Predictions tell the nature of future occurrences of certain events based on what has
happened in the past, such as predicting the winner of the Super Bowl or forecast-
ing the absolute temperature of a particular day. Application Case 4.2
Dell Is Staying Agile and Effective with Analytics in the 21st Century The digital revolution is
that could assimilate all of it, pinpoint patterns and changing how people shop.
make recommendations about marketing spend and Studies show that even com- activities.” mercial customers spend more of their buyer journey
Setting Up an Agile Team to Boost researching solutions online
Return on Investment (ROI) with BI before they engage a vendor. and Analytics To compete, companies like
Dell are transforming sales and marketing models
To improve its global BI and analytics strategy
to support these new requirements. However, doing
and communications, Dell established an IT task
so effectively requires a Big Data solution that can
force. Executives created a flexible governance
analyze corporate databases along with unstructured
model for the team so that it can rapidly respond to
information from sources such as clickstreams and
employees’ evolving BI and analytics requirements social media.
and deliver rapid ROI. For example, in addition
Dell has evolved into a technology leader by
to having the freedom to collaborate with internal
using efficient, data-driven processes. For decades,
business groups, the task force is empowered to
employees could get measurable results by using
modify business and IT processes using agile and
enterprise applications to support insight and facili-
innovative strategies. The team must dedicate more
tate processes such as customer relationship man-
than 50% of its efforts identifying and implementing
agement (CRM), sales, and accounting. When Dell
quick-win BI and analytics projects that are typi-
recognized that customers were spending dramati-
cally too small for the “A” priority list of Dell’s IT
cally more time researching products online before
department. And the team must also spend at least
contacting a sales representative, it wanted to update
30% of its time evangelizing within internal busi-
marketing models accordingly so that it could
ness groups to raise awareness about BI’s trans-
deliver the new types of personalized services and
formative capabilities—as well as opportunities for
the support that customers expected. To make such collaboration.
changes, however, marketing employees needed
One of the task force’s first projects was a new BI
more data about customers’ online behavior. Staff
and analytics solution called the Marketing Analytics
also needed an easier way to condense insight from
Workbench. Its initial application was focused on
numerous business intelligence (BI) tools and data
a select set of use cases around online and offline
sources. Drew Miller, Executive Director, Marketing
commercial customer engagements. This effort was
Analytics and Insights at Dell, says, “There are peta-
cofunded by Dell’s IT and marketing organizations.
bytes of available information about customers’
“There was a desire to expand the usage of this
online and offline shopping habits. We just needed
solution to support many more sales and marketing
to give marketing employees an easy-to-use solution
activities as soon as possible. However, we knew we
Chapter 4 • Predictive Analytics I: Data Mining Process, Methods, and Algorithms 225
could build a more effective solution if we scaled it
$2.5 million in vendor outsourcing costs,” says Chaitanya
out via iterative quick sprint efforts,” says Fadi Taffal,
Laxminarayana, Marketing Program Manager at Dell.
Director, Enterprise IT at Dell.
“Plus, employees gain faster and more detailed
insights.” As Dell scales the Marketing Analytics
One Massive Data Mart Facilitates a Single
Workbench, it will phase out additional third-party Source of Truth
BI applications, further reducing costs and boosting efficiency.
Working closely with marketing, task force engi-
neers use lean software development strategies and
numerous technologies to create a highly scalable
Facilitates $5.3 Million in Revenue
data mart. The overall solution utilizes multiple
Marketing employees now have the insight they
technologies and tools to enable different types of
need to identify emerging trends in customer
data storage, manipulation, and automation activi-
engagements—and update models accordingly.
ties. For example, engineers store unstructured data
“We’ve already realized $5.3 million in incremental
from digital/social media sources on servers running
revenue by initiating more personalized market-
Apache Hadoop. They use the Teradata Aster plat-
ing programs and uncovering new opportunities
form to then integrate and explore large amounts
with our big data Marketing Analytics Workbench,”
of customer data from other sources in near real
says Laxman Srigiri, Director, Marketing Analytics
time. For various data transformation and automa-
at Dell. “Additionally, we have programs on track
tion needs, the solution includes the use of Dell’s
to scale this impact many times over in the next
Toad software suite, specifically Toad Data Point and three years.”
Toad Intelligence Central, and Dell Statistica. Toad
For example, employees can now see a
Data Point provides a business-friendly interface for
timeline of a customer’s online and offline inter-
data manipulation and automation, which is a critical
actions with Dell, including purchases, the spe-
gap in the ecosystem. For advanced analytical mod-
cific Dell Web site pages the customer visited,
els, the system uses Dell Statistica, which provides
and the files they downloaded. Plus, employ-
data preparation, predictive analytics, data mining
ees receive database suggestions for when and
and machine learning, statistics, text analytics, visu-
how to contact a customer, as well as the URLs
alization and reporting, and model deployment and
of specific pages they should read to learn more
monitoring. Engineers also utilize this solution to
about the technologies a customer is researching.
develop analytical models that can sift through all of
Srigiri says, “It was imperative that we understand
the disparate data and provide an accurate picture
changing requirements so we could stay agile.
of customers’ shopping behavior. Tools provide sug-
Now that we have that insight, we can quickly
gestions for improving service, as well as ROI met-
develop more effective marketing models that
rics for multivehicle strategies that include Web site
deliver the personalized information and support
marketing, phone calls, and site visits. customers expect.”
Within several months, employees were using
the initial Marketing Analytics Workbench. The task
force plans to expand the solution’s capabilities QUESTIONS FOR DISCUSSION
so it can analyze data from more sources, provide
1. What was the challenge Dell was facing that led
additional visualizations, and measure the returns of to their analytics journey?
other channel activities such as tweets, texts, e-mail
2. What solution did Dell develop and implement?
messages, and social media posts. What were the results?
3. As an analytics company itself, Dell has used its
Saves More Than $2.5 Million in
service offerings for its own business. Do you Operational Costs
think it is easier or harder for a company to taste
With its new solution, Dell has already eliminated its own medicine? Explain.
several third-party BI applications. “Although we’re
Source: Dell: Staying agile and effective in the 21st century. Dell
just in the initial phases of rolling out our Marketing
Case Study, software.dell.com/casestudy/dell-staying -agile-and-
Analytics Workbench, we’ve saved approximately
effective-in-the-21st-century881389. Used by permission from Dell.
226 Chapter 4 • Predictive Analytics I: Data Mining Process, Methods, and Algorithms
3. Clusters identify natural groupings of things based on their known characteristics,
such as assigning customers in different segments based on their demographics and past purchase behaviors.
4. Sequential relationships discover time-ordered events, such as predicting that an
existing banking customer who already has a checking account will open a savings
account followed by an investment account within a year.
These types of patterns have been manually extracted from data by humans for
centuries, but the increasing volume of data in modern times has created a need for more
automatic approaches. As data sets have grown in size and complexity, direct manual data
analysis has increasingly been augmented with indirect, automatic data processing tools
that use sophisticated methodologies, methods, and algorithms. The manifestation of such
evolution of automated and semiautomated means of processing large data sets is now
commonly referred to as data mining.
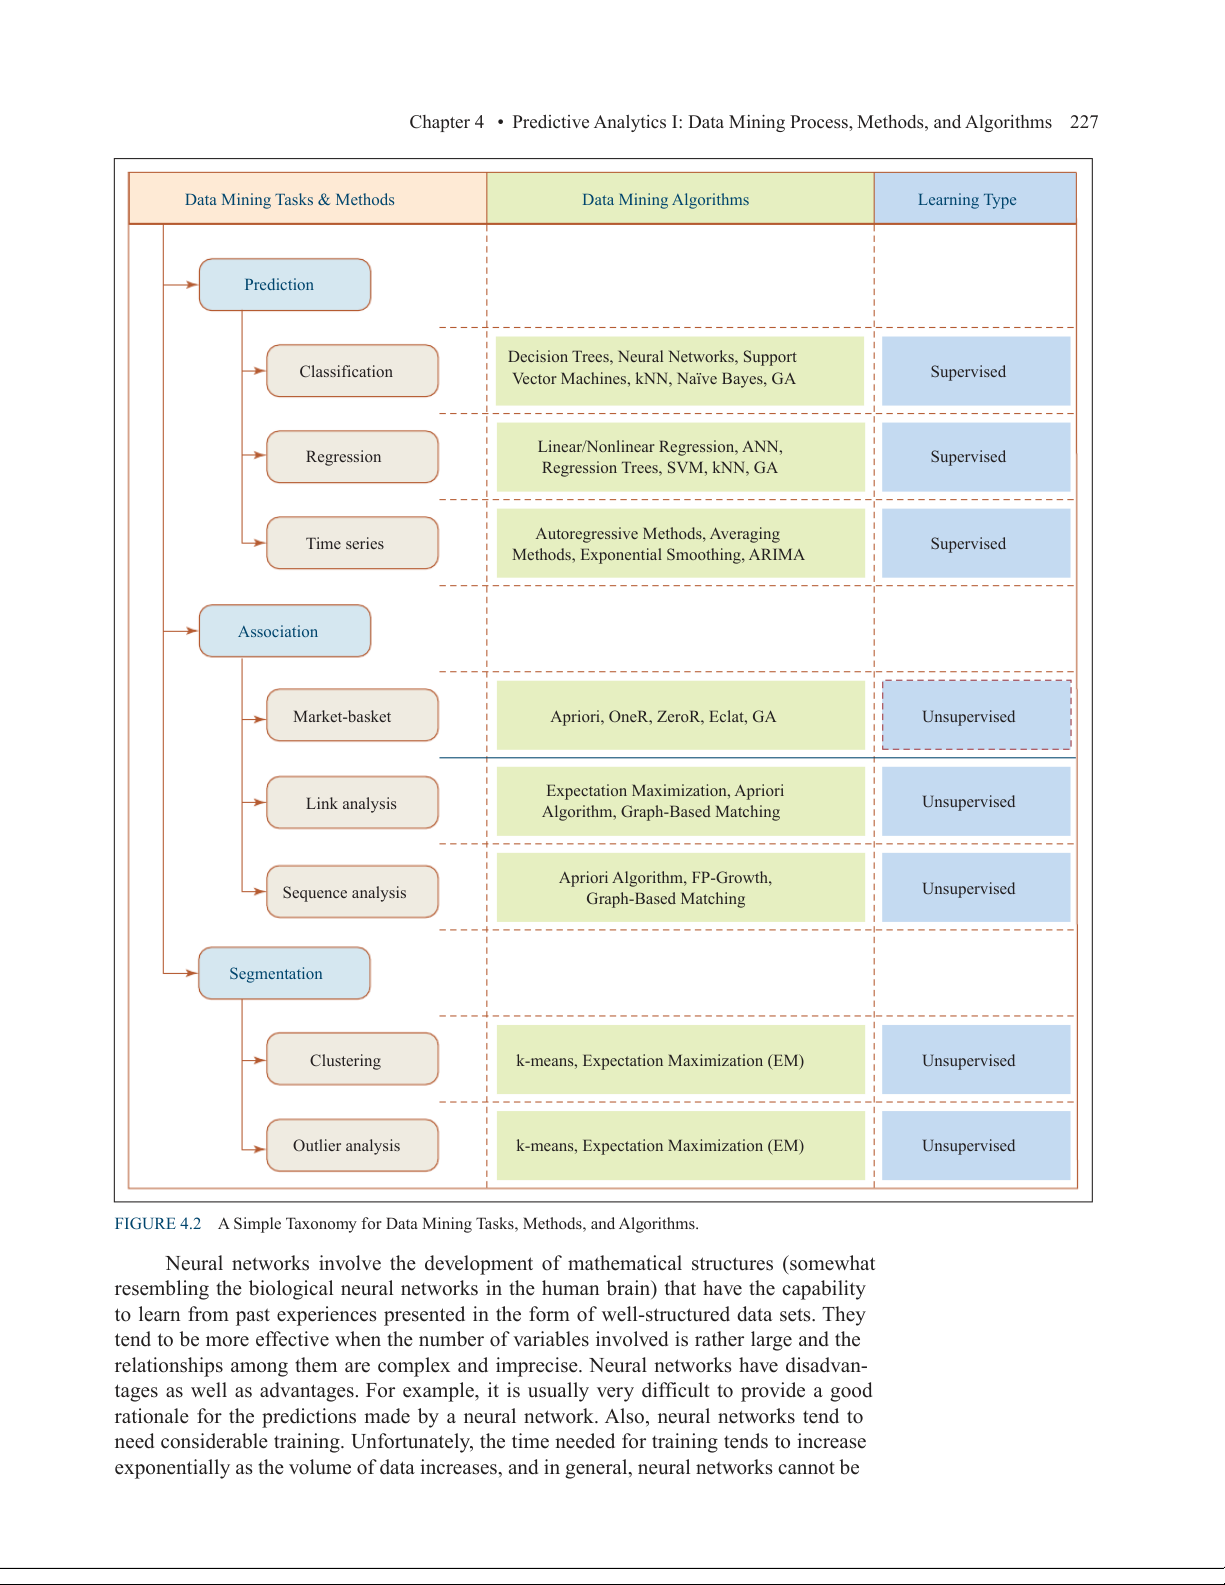
Generally speaking, data mining tasks can be classified into three main catego-
ries: prediction, association, and clustering. Based on the way in which the patterns are
extracted from the historical data, the learning algorithms of data mining methods can
be classified as either supervised or unsupervised. With supervised learning algorithms,
the training data includes both the descriptive attributes (i.e., independent variables or
decision variables) as well as the class attribute (i.e., output variable or result variable). In
contrast, with unsupervised learning the training data includes only the descriptive attrib-
utes. Figure 4.2 shows a simple taxonomy for data mining tasks, along with the learning
methods and popular algorithms for each of the data mining tasks.
PREDICTION Prediction is commonly referred to as the act of telling about the future.
It differs from simple guessing by taking into account the experiences, opinions, and other
relevant information in conducting the task of foretelling. A term that is commonly associ-
ated with prediction is forecasting. Even though many believe that these two terms are
synonymous, there is a subtle but critical difference between the two. Whereas prediction
is largely experience and opinion based, forecasting is data and model based. That is, in
order of increasing reliability, one might list the relevant terms as guessing, predicting,
and forecasting, respectively. In data mining terminology, prediction and forecasting are
used synonymously, and the term prediction is used as the common representation of the
act. Depending on the nature of what is being predicted, prediction can be named more
specifically as classification (where the predicted thing, such as tomorrow’s forecast, is a
class label such as “rainy” or “sunny”) or regression (where the predicted thing, such as
tomorrow’s temperature, is a real number, such as “65°F”).
CLASSIFICATION Classification, or supervised induction, is perhaps the most com-
mon of all data mining tasks. The objective of classification is to analyze the historical data
stored in a database and automatically generate a model that can predict future behavior.
This induced model consists of generalizations over the records of a training data set,
which help distinguish predefined classes. The hope is that the model can then be used to
predict the classes of other unclassified records and, more important, to accurately predict actual future events.
Common classification tools include neural networks and decision trees (from
machine learning), logistic regression and discriminant analysis (from traditional sta-
tistics), and emerging tools such as rough sets, support vector machines (SVMs), and
genetic algorithms. Statistics-based classification techniques (e.g., logistic regression and
discriminant analysis) have received their share of criticism—that they make unrealistic
assumptions about the data, such as independence and normality—which limit their use
in classification-type data mining projects.
Chapter 4 • Predictive Analytics I: Data Mining Process, Methods, and Algorithms 227
Data Mining Tasks & Methods Data Mining Algorithms Learning Type Prediction
Decision Trees, Neural Networks, Support Classification
Vector Machines, kNN, Naïve Bayes, GA Supervised
Linear/Nonlinear Regression, ANN, Regression Supervised Regression Trees, SVM, kNN, GA
Autoregressive Methods, Averaging Time series Supervised
Methods, Exponential Smoothing, ARIMA Association Market-basket
Apriori, OneR, ZeroR, Eclat, GA Unsupervised
Expectation Maximization, Apriori Link analysis Unsupervised
Algorithm, Graph-Based Matching Apriori Algorithm, FP-Growth, Sequence analysis Unsupervised Graph-Based Matching Segmentation Clustering
k-means, Expectation Maximization (EM) Unsupervised Outlier analysis
k-means, Expectation Maximization (EM) Unsupervised
FIGURE 4.2 A Simple Taxonomy for Data Mining Tasks, Methods, and Algorithms.
Neural networks involve the development of mathematical structures (somewhat
resembling the biological neural networks in the human brain) that have the capability
to learn from past experiences presented in the form of well-structured data sets. They
tend to be more effective when the number of variables involved is rather large and the
relationships among them are complex and imprecise. Neural networks have disadvan-
tages as well as advantages. For example, it is usually very difficult to provide a good
rationale for the predictions made by a neural network. Also, neural networks tend to
need considerable training. Unfortunately, the time needed for training tends to increase
exponentially as the volume of data increases, and in general, neural networks cannot be
228 Chapter 4 • Predictive Analytics I: Data Mining Process, Methods, and Algorithms
trained on very large databases. These and other factors have limited the applicability of
neural networks in data-rich domains.
Decision trees classify data into a finite number of classes based on the values of
the input variables. Decision trees are essentially a hierarchy of if-then statements and are
thus significantly faster than neural networks. They are most appropriate for categori-
cal and interval data. Therefore, incorporating continuous variables into a decision tree framework requires ;
discretization that is, converting continuous valued numerical vari-
ables to ranges and categories.
A related category of classification tools is rule induction. Unlike with a decision
tree, with rule induction the if-then statements are induced from the training data directly,
and they need not be hierarchical in nature. Other, more recent techniques such as SVM,
rough sets, and genetic algorithms are gradually finding their way into the arsenal of clas- sification algorithms.
CLUSTERING Clustering partitions a collection of things (e.g., objects, events, pre-
sented in a structured data set) into segments (or natural groupings) whose members
share similar characteristics. Unlike in classification, in clustering the class labels are
unknown. As the selected algorithm goes through the data set, identifying the common-
alities of things based on their characteristics, the clusters are established. Because the
clusters are determined using a heuristic-type algorithm, and because different algorithms
may end up with different sets of clusters for the same data set, before the results of clus-
tering techniques are put to actual use it may be necessary for an expert to interpret, and
potentially modify, the suggested clusters. After reasonable clusters have been identified,
they can be used to classify and interpret new data.
Not surprisingly, clustering techniques include optimization. The goal of cluster-
ing is to create groups so that the members within each group have maximum simi-
larity and the members across groups have minimum similarity. The most commonly
used clustering techniques include k-means (from statistics) and self-organizing maps
(from machine learning), which is a unique neural network architecture developed by Kohonen (1982).
Firms often effectively use their data mining systems to perform market segmenta-
tion with cluster analysis. Cluster analysis is a means of identifying classes of items so that
items in a cluster have more in common with each other than with items in other clusters.
It can be used in segmenting customers and directing appropriate marketing products to
the segments at the right time in the right format at the right price. Cluster analysis is also
used to identify natural groupings of events or objects so that a common set of character-
istics of these groups can be identified to describe them.
ASSOCIATIONS Associations, or association rule learning in data mining, is a popu-
lar and well-researched technique for discovering interesting relationships among vari-
ables in large databases. Thanks to automated data-gathering technologies such as bar
code scanners, the use of association rules for discovering regularities among products in
large-scale transactions recorded by point-of-sale systems in supermarkets has become a
common knowledge discovery task in the retail industry. In the context of the retail indus-
try, association rule mining is often called market-basket analysis.
Two commonly used derivatives of association rule mining are link analysis and
sequence mining. With link analysis, the linkage among many objects of interest is
discovered automatically, such as the link between Web pages and referential relation-
ships among groups of academic publication authors. With sequence mining, relation-
ships are examined in terms of their order of occurrence to identify associations over time.
Algorithms used in association rule mining include the popular Apriori (where frequent
itemsets are identified) and FP-Growth, OneR, ZeroR, and Eclat.
Chapter 4 • Predictive Analytics I: Data Mining Process, Methods, and Algorithms 229
VISUALIZATION AND TIME-SERIES FORECASTING Two techniques often associated
with data mining are visualization and time-series forecasting. Visualization can be used
in conjunction with other data mining techniques to gain a clearer understanding of
underlying relationships. As the importance of visualization has increased in recent years,
a new term, visual analytics, has emerged. The idea is to combine analytics and visuali-
zation in a single environment for easier and faster knowledge creation. Visual analytics
is covered in detail in Chapter 3. In time-series forecasting, the data consists of values of
the same variable that is captured and stored over time in regular intervals. These data
are then used to develop forecasting models to extrapolate the future values of the same variable. Data Mining versus Statistics
Data mining and statistics have a lot in common. They both look for relationships within
data. Most people call statistics the “foundation of data mining.” The main difference
between the two is that statistics starts with a well-defined proposition and hypothesis,
whereas data mining starts with a loosely defined discovery statement. Statistics collects
sample data (i.e., primary data) to test the hypothesis, whereas data mining and analytics
use all the existing data (i.e., often observational, secondary data) to discover novel pat-
terns and relationships. Another difference comes from the size of data that they use. Data
mining looks for data sets that are as “big” as possible, whereas statistics looks for the right
size of data (if the data is larger than what is needed/required for the statistical analysis,
a sample of the data is used). The meaning of “large data” is rather different between
statistics and data mining. A few hundred to a thousand data points are large enough to
a statistician, but several million to a few billion data points are considered large for data mining studies. SECTION 4.2 REVIEW QUESTIONS
1. Define data mining. Why are there many different names and definitions for data mining?
2. What recent factors have increased the popularity of data mining?
3. Is data mining a new discipline? Explain.
4. What are some major data mining methods and algorithms?
5. What are the key differences between the major data mining tasks? 4.3 Data Mining Applications
Data mining has become a popular tool in addressing many complex businesses problems
and opportunities. It has been proven to be very successful and helpful in many areas,
some of which are shown by the following representative examples. The goal of many of
these business data mining applications is to solve a pressing problem or to explore an
emerging business opportunity to create a sustainable competitive advantage.
• Customer relationship management. Customer relationship management (CRM)
is the extension of traditional marketing. The goal of CRM is to create one-on-one
relationships with customers by developing an intimate understanding of their needs
and wants. As businesses build relationships with their customers over time through
a variety of interactions (e.g., product inquiries, sales, service requests, warranty
calls, product reviews, social media connections), they accumulate tremendous
amounts of data. When combined with demographic and socioeconomic attributes,
this information-rich data can be used to (1) identify most likely responders/buyers
230 Chapter 4 • Predictive Analytics I: Data Mining Process, Methods, and Algorithms
of new products/services (i.e., customer profiling); (2) understand the root causes of
customer attrition to improve customer retention (i.e., churn analysis); (3) discover
time-variant associations between products and services to maximize sales and cus-
tomer value; and (4) identify the most profitable customers and their preferential
needs to strengthen relationships and to maximize sales.
• Banking. Data mining can help banks with the following: (1) automating the
loan application process by accurately predicting the most probable defaulters, (2)
detecting fraudulent credit card and online banking transactions, (3) identifying
ways to maximize customer value by selling them products and services that they
are most likely to buy, and (4) optimizing the cash return by accurately forecasting
the cash flow on banking entities (e.g., ATM machines, banking branches).
• Retailing and logistics. In the retailing industry, data mining can be used to
(1) predict accurate sales volumes at specific retail locations to determine correct
inventory levels; (2) identify sales relationships between different products (with
market-basket analysis) to improve the store layout and optimize sales promotions;
(3) forecast consumption levels of different product types (based on seasonal and
environmental conditions) to optimize logistics and, hence, maximize sales; and
(4) discover interesting patterns in the movement of products (especially for the
products that have a limited shelf life because they are prone to expiration, per-
ishability, and contamination) in a supply chain by analyzing sensory and radio-
frequency identification (RFID) data.
• Manufacturing and production. Manufacturers can use data mining to (1) predict
machinery failures before they occur through the use of sensory data (enabling what
is called condition-based maintenance); (2) identify anomalies and commonalities
in production systems to optimize manufacturing capacity; and (3) discover novel
patterns to identify and improve product quality.
• Brokerage and securities trading. Brokers and traders use data mining to (1)
predict when and how much certain bond prices will change; (2) forecast the range
and direction of stock fluctuations; (3) assess the effect of particular issues and
events on overall market movements; and (4) identify and prevent fraudulent activi- ties in securities trading.
• Insurance. The insurance industry uses data mining techniques to (1) forecast
claim amounts for property and medical coverage costs for better business planning,
(2) determine optimal rate plans based on the analysis of claims and customer data,
(3) predict which customers are more likely to buy new policies with special fea-
tures, and (4) identify and prevent incorrect claim payments and fraudulent activities.
• Computer hardware and software. Data mining can be used to (1) predict disk
drive failures well before they actually occur, (2) identify and filter unwanted Web
content and e-mail messages, (3) detect and prevent computer network security
breaches and (4) identify potentially unsecure software products.
• Government and defense. Data mining also has a number of military applications.
It can be used to (1) forecast the cost of moving military personnel and equipment;
(2) predict an adversary’s moves and, hence, develop more successful strategies for
military engagements; (3) predict resource consumption for better planning and budg-
eting; and (4) identify classes of unique experiences, strategies, and lessons learned
from military operations for better knowledge sharing throughout the organization.
• Travel industry (airlines, hotels/resorts, rental car companies). Data mining has
a variety of uses in the travel industry. It is successfully used to (1) predict sales of
different services (seat types in airplanes, room types in hotels/resorts, car types
in rental car companies) in order to optimally price services to maximize revenues
as a function of time-varying transactions (commonly referred to as yield manage-
ment); (2) forecast demand at different locations to better allocate limited organi-
zational resources; (3) identify the most profitable customers and provide them
Chapter 4 • Predictive Analytics I: Data Mining Process, Methods, and Algorithms 231
with personalized services to maintain their repeat business; and (4) retain valuable
employees by identifying and acting on the root causes for attrition.
• Healthcare. Data mining has a number of healthcare applications. It can be used
to (1) identify people without health insurance and the factors underlying this unde-
sired phenomenon, (2) identify novel cost–benefit relationships between different
treatments to develop more effective strategies, (3) forecast the level and the time of
demand at different service locations to optimally allocate organizational resources,
and (4) understand the underlying reasons for customer and employee attrition.
• Medicine. Use of data mining in medicine should be viewed as an invaluable com-
plement to traditional medical research, which is mainly clinical and biological in
nature. Data mining analyses can (1) identify novel patterns to improve survivability
of patients with cancer, (2) predict success rates of organ transplantation patients to
develop better organ donor matching policies, (3) identify the functions of different
genes in the human chromosome (known as genomics), and (4) discover the relation-
ships between symptoms and illnesses (as well as illnesses and successful treatments)
to help medical professionals make informed and correct decisions in a timely manner.
• Entertainment industry. Data mining is successfully used by the entertainment
industry to (1) analyze viewer data to decide what programs to show during prime
time and how to maximize returns by knowing where to insert advertisements,
(2) predict the financial success of movies before they are produced to make invest-
ment decisions and to optimize the returns, (3) forecast the demand at different loca-
tions and different times to better schedule entertainment events and to optimally
allocate resources, and (4) develop optimal pricing policies to maximize revenues.
• Homeland security and law enforcement. Data mining has a number of home-
land security and law enforcement applications. Data mining is often used to
(1) identify patterns of terrorist behaviors; (2) discover crime patterns (e.g., loca-
tions, timings, criminal behaviors, and other related attributes) to help solve criminal
cases in a timely manner; (3) predict and eliminate potential biological and chemical
attacks to the nation’s critical infrastructure by analyzing special-purpose sensory
data; and (4) identify and stop malicious attacks on critical information infrastruc-
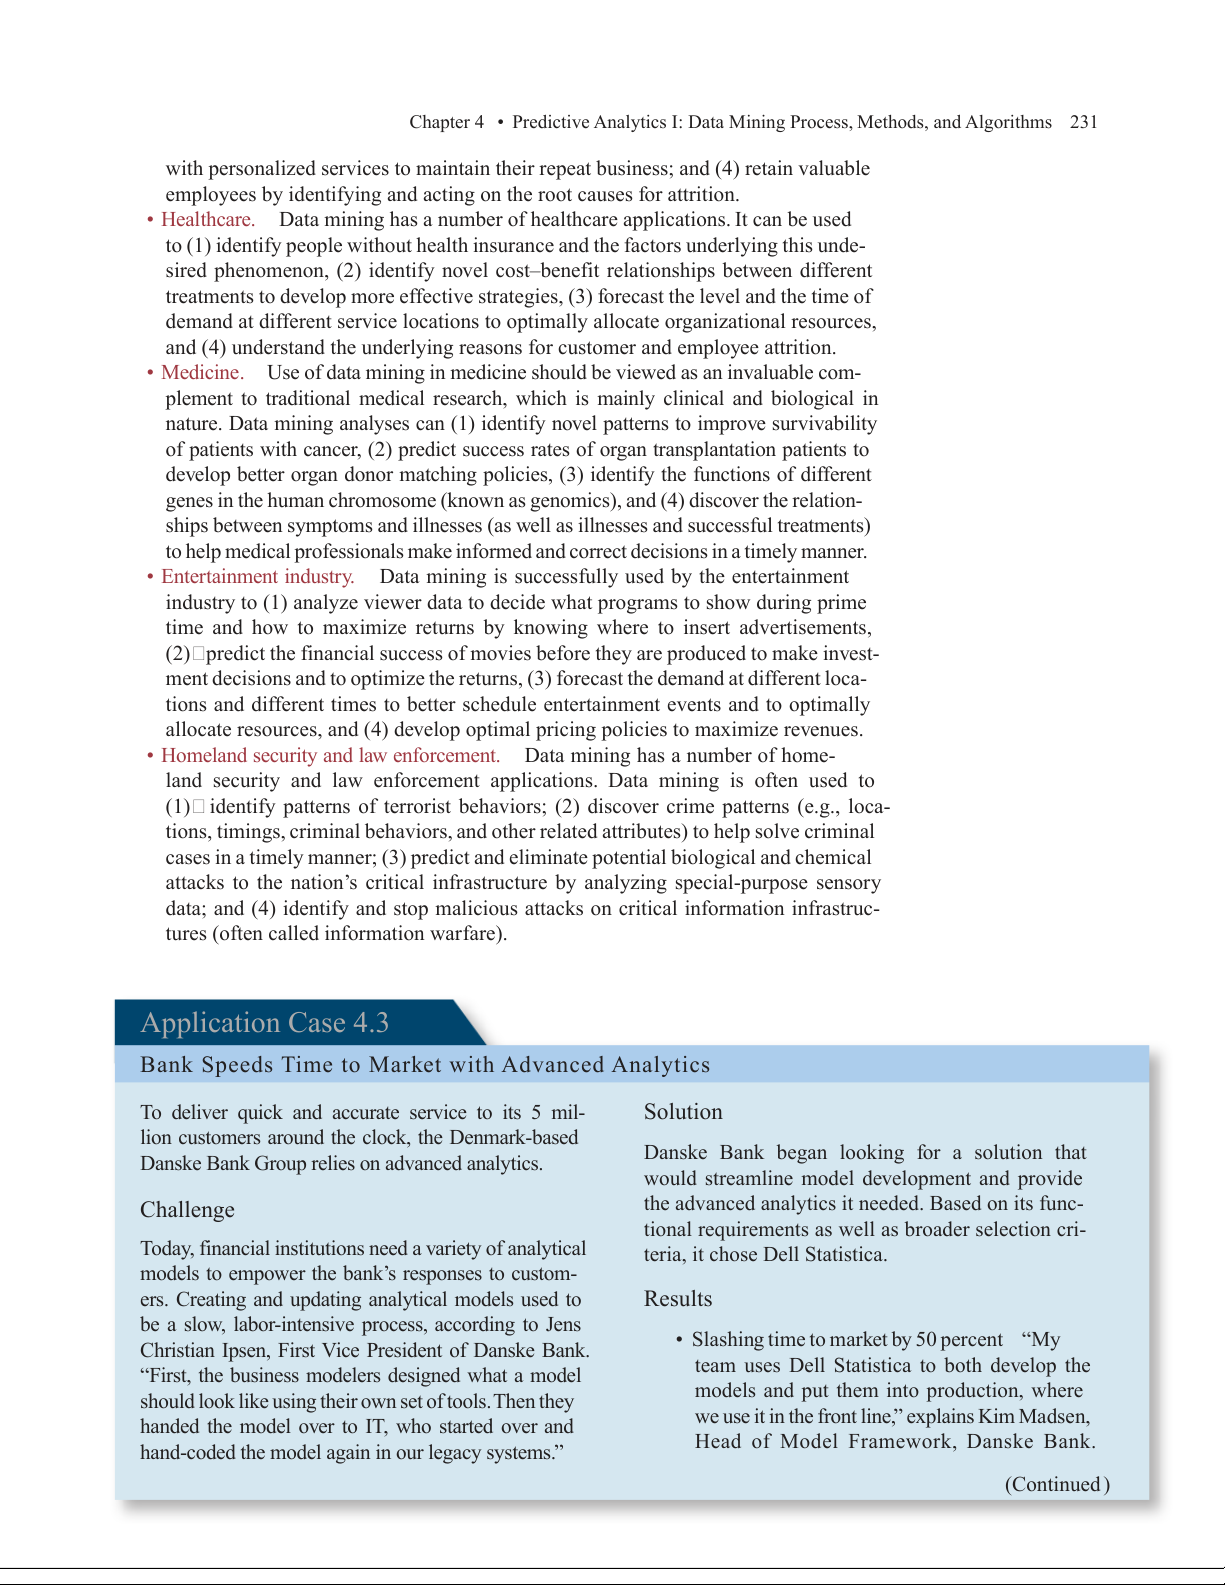
tures (often called information warfare). Application Case 4.3
Bank Speeds Time to Market with Advanced Analytics
To deliver quick and accurate service to its 5 mil- Solution
lion customers around the clock, the Denmark-based
Danske Bank Group relies on advanced analytics.
Danske Bank began looking for a solution that
would streamline model development and provide Challenge
the advanced analytics it needed. Based on its func-
tional requirements as well as broader selection cri-
Today, financial institutions need a variety of analytical
teria, it chose Dell Statistica.
models to empower the bank’s responses to custom-
ers. Creating and updating analytical models used to Results
be a slow, labor-intensive process, according to Jens
Christian Ipsen, First Vice President of Danske Bank.
• Slashing time to market by 50 percent “My
“First, the business modelers designed what a model
team uses Dell Statistica to both develop the
should look like using their own set of tools. Then they
models and put them into production, where
handed the model over to IT, who started over and
we use it in the front line,” explains Kim Madsen,
hand-coded the model again in our legacy systems.”
Head of Model Framework, Danske Bank. (Continued )
232 Chapter 4 • Predictive Analytics I: Data Mining Process, Methods, and Algorithms
Application Case 4.3 (Continued)
“When a customer applies for a loan, our an-
• The scalability to meet future needs “We
swer is based on those models, which use a
will need to build more and more models to
variety of data, including data related to the
use in our business processes,” notes Jensen.
customer as well as external data, such as data
“We already have initiatives to put more pro-
from credit bureaus. We use Statistica to find
cesses on mobile devices, and we will need
patterns in that data related to good and bad
to gain additional insight around customer be-
financial behavior, predict whether a customer
havior to make even more automatic decisions.
will default within a year, and determine credit
I’m confident that the Statistica platform can worthiness.”
scale to meet our needs into the future.”
• Ensuring regulatory compliance “Our mod-
els have been under increasing scrutiny [from QUESTIONS FOR DISCUSSION
regulators]—for example, we have had to reca-
1. What were the change, proposed solution, and
librate all our models,” Jensen explains. “In this
results of the adoption of Dell Statistica?
area, we have definitely seen the benefits of the
Statistica platform [as] it is so easy to use.”
2. In your opinion, where else can a banking insti-
• Advanced modeling “With Statistica, we can
tution productively use advanced analytics?
do more advanced modeling than we could be-
Source: Quest (formerly Dell Software) Customer Case Study, “Bank
fore,” says Jensen. “It is a key part of our larger
speeds time to market with advanced analytics.” https://www
strategy around analytics, which involves not only
.quest.com/documents/danske-bank-speeds-time-to-market-with-
structured data but Big Data in our data hub.”
advanced-analytics-case-study-79267.pdf (accessed January 2017).
• Sports. Data mining was used to improve the performance of National Basketball
Association (NBA) teams in the United States. Major League Baseball teams are into pre-
dictive analytics and data mining to optimally utilize their limited resources for a winning
season (see Moneyball article in Chapter 1). In fact, most, if not all, professional sports
nowadays employ data crunchers and use data mining to increase their chances of win-
ning. Data mining applications are not limited to professional sports. In a 2012 article,
Delen, Cogdell, and Kasap (2012) developed data mining models to predict National
Collegiate Athletic Association (NCAA) Bowl Game outcomes using a wide range of
variables about the two opposing teams’ previous games statistics (more details about
this case study are provided in Chapter 2). Wright (2012) used a variety of predictors for
examination of the NCAA men’s basketball championship bracket (a.k.a. March Madness). SECTION 4.3 REVIEW QUESTIONS
1. What are the major application areas for data mining?
2. Identify at least five specific applications of data mining and list five common charac-
teristics of these applications.
3. What do you think is the most prominent application area for data mining? Why?
4. Can you think of other application areas for data mining not discussed in this section? Explain. 4.4 Data Mining Process
To systematically carry out data mining projects, a general process is usually followed.
Based on best practices, data mining researchers and practitioners have proposed several
processes (workflows or simple step-by-step approaches) to maximize the chances of
Chapter 4 • Predictive Analytics I: Data Mining Process, Methods, and Algorithms 233 1 2 Business Data Understanding Understanding 3 Data Preparation 6 Deployment Data 4 Model Building 5 Testing and Evaluation
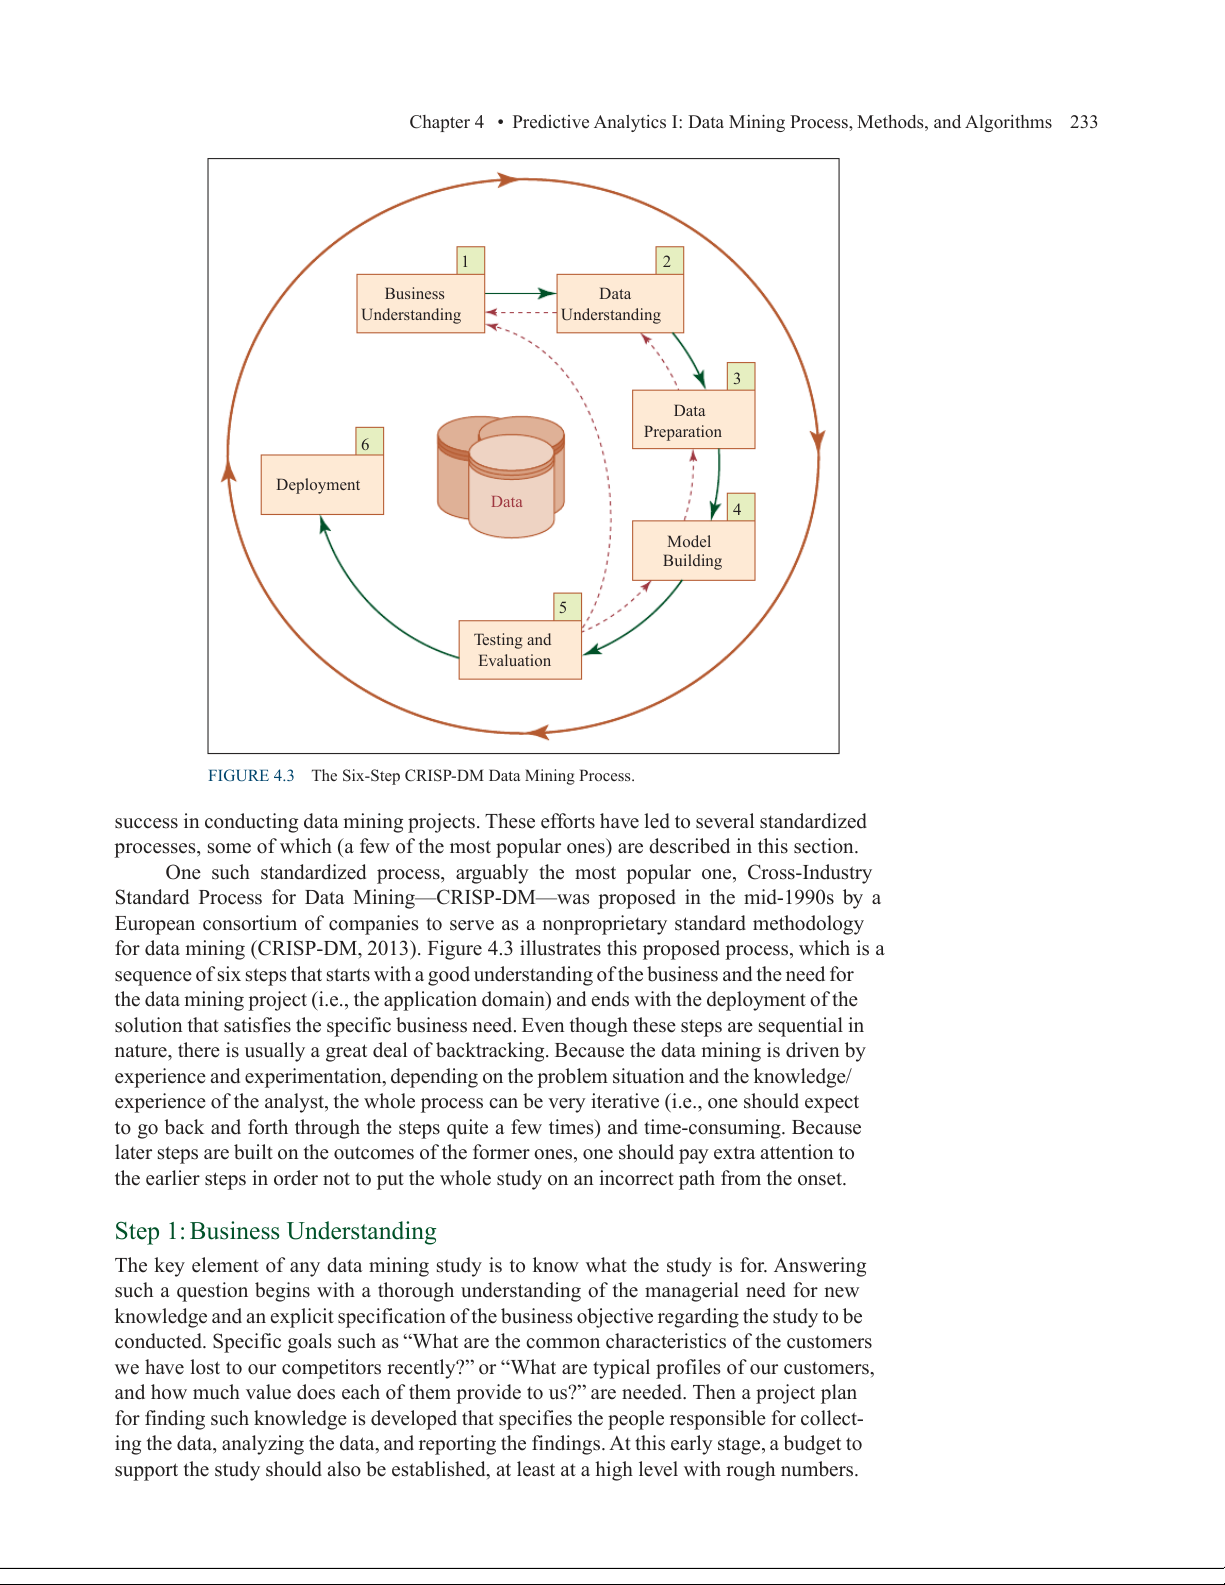
FIGURE 4.3 The Six-Step CRISP-DM Data Mining Process.
success in conducting data mining projects. These efforts have led to several standardized
processes, some of which (a few of the most popular ones) are described in this section.
One such standardized process, arguably the most popular one, Cross-Industry
Standard Process for Data Mining—CRISP-D —
M was proposed in the mid-1990s by a
European consortium of companies to serve as a nonproprietary standard methodology
for data mining (CRISP-DM, 2013). Figure 4.3 illustrates this proposed process, which is a
sequence of six steps that starts with a good understanding of the business and the need for
the data mining project (i.e., the application domain) and ends with the deployment of the
solution that satisfies the specific business need. Even though these steps are sequential in
nature, there is usually a great deal of backtracking. Because the data mining is driven by
experience and experimentation, depending on the problem situation and the knowledge/
experience of the analyst, the whole process can be very iterative (i.e., one should expect
to go back and forth through the steps quite a few times) and time-consuming. Because
later steps are built on the outcomes of the former ones, one should pay extra attention to
the earlier steps in order not to put the whole study on an incorrect path from the onset. Step 1: Business Understanding
The key element of any data mining study is to know what the study is for. Answering
such a question begins with a thorough understanding of the managerial need for new
knowledge and an explicit specification of the business objective regarding the study to be
conducted. Specific goals such as “What are the common characteristics of the customers
we have lost to our competitors recently?” or “What are typical profiles of our customers,
and how much value does each of them provide to us?” are needed. Then a project plan
for finding such knowledge is developed that specifies the people responsible for collect-
ing the data, analyzing the data, and reporting the findings. At this early stage, a budget to
support the study should also be established, at least at a high level with rough numbers.
234 Chapter 4 • Predictive Analytics I: Data Mining Process, Methods, and Algorithms Step 2: Data Understanding
A data mining study is specific to addressing a well-defined business task, and different
business tasks require different sets of data. Following the business understanding, the
main activity of the data mining process is to identify the relevant data from many available
databases. Some key points must be considered in the data identification and selection
phase. First and foremost, the analyst should be clear and concise about the description
of the data mining task so that the most relevant data can be identified. For example, a
retail data mining project may seek to identify spending behaviors of female shoppers
who purchase seasonal clothes based on their demographics, credit card transactions, and
socioeconomic attributes. Furthermore, the analyst should build an intimate understand-
ing of the data sources (e.g., where the relevant data are stored and in what form; what
the process of collecting the data is—automated versus manual; who the collectors of the
data are and how often the data are updated) and the variables (e.g., What are the most
relevant variables? Are there any synonymous and/or homonymous variables? Are the
variables independent of each other—do they stand as a complete information source
without overlapping or conflicting information?).
To better understand the data, the analyst often uses a variety of statistical and graph-
ical techniques, such as simple statistical summaries of each variable (e.g., for numeric
variables the average, minimum/maximum, median, and standard deviation are among
the calculated measures, whereas for categorical variables the mode and frequency tables
are calculated), correlation analysis, scatterplots, histograms, and box plots. A careful
identification and selection of data sources and the most relevant variables can make it
easier for data mining algorithms to quickly discover useful knowledge patterns.
Data sources for data selection can vary. Traditionally, data sources for business
applications include demographic data (such as income, education, number of house-
holds, and age), sociographic data (such as hobby, club membership, and entertain-
ment), transactional data (sales record, credit card spending, issued checks), and so on.
Nowadays, data sources also use external (open or commercial) data repositories, social
media, and machine-generated data.
Data can be categorized as quantitative and qualitative. Quantitative data is meas-
ured using numeric values, or numeric data. It can be discrete (such as integers) or con-
tinuous (such as real numbers). Qualitative data, also known as categorical data, contains
both nominal and ordinal data. Nominal data has finite nonordered values (e.g., gender
data, which has two values: male and female). Ordinal data has finite ordered values.
For example, customer credit ratings are considered ordinal data because the ratings can
be excellent, fair, and bad. A simple taxonomy of data (i.e., the nature of data) is provided in Chapter 2.
Quantitative data can be readily represented by some sort of probability distribution.
A probability distribution describes how the data is dispersed and shaped. For instance,
normally distributed data is symmetric and is commonly referred to as being a bell-shaped
curve. Qualitative data may be coded to numbers and then described by frequency distri-
butions. Once the relevant data are selected according to the data mining business objec-
tive, data preprocessing should be pursued. Step 3: Data Preparation
The purpose of data preparation (more commonly called data preprocessing) is to take
the data identified in the previous step and prepare it for analysis by data mining methods.
Compared to the other steps in CRISP-DM, data preprocessing consumes the most time
and effort; most believe that this step accounts for roughly 80% of the total time spent on
a data mining project. The reason for such an enormous effort spent on this step is the
fact that real-world data is generally incomplete (lacking attribute values, lacking certain
Tài liệu liên quan:
-
Bài tập Cấu trúc dữ liệu | Trường Đại học Khoa học tự nhiên, Đại học Quốc gia Hà Nội
28 14 -
Chương 7: Khai Thác Dữ Liệu Web và Ứng Dụng | Khai thác dữ liệu và ứng dụng | Trường Đại học Khoa học Tự nhiên, Đại học Quốc gia Hà Nội
113 57 -
Bài tập ôn tập Khai Thác Dữ Liệu | Khai thác dữ liệu và ứng dụng | Trường Đại học Khoa học Tự nhiên, Đại học Quốc gia Hà Nội
109 55 -
Chương 3. Phân tích Luật Kết Hợp | Khai thác dữ liệu và ứng dụng | Trường Đại học Khoa học Tự nhiên, Đại học Quốc gia Hà Nội
95 48