

Preview text:
1 CHAPTER 5: RATIO
1. Financial statements for Harvey Company follow: Harvey Company Income Statements
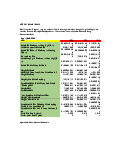
for the Years Ended December 31 Unit: $ 2015 2014 Revenues Net sales 315,000 259,000 Expenses Cost of goods sold 189,000 154,000
General, selling, and administrative expenses 54,000 46000 Interest expense 4,000 4500 Income before taxes 68,000 54,500 Income tax expense (40%) 27,200 21,800 Net income 40,800 32,700 Harvey Company Balance Sheets As of December 31 Unit: $ 2015 2014 Assets Current assets Cash 6,500 11,500 Accounts receivable 51,000 49,000 Inventories 155,000 147,500 PHD.NGUYEN THANH NAM 2 Total current assets 212,500 208,000 Plant and equipment (net) 187,500 177,000 Total assets 400,000 385,000
Liabilities and Stockholders’ Equity Liabilities Current liabilities Accounts payable 60,000 81,500 Other 25,000 22,500 Total current liabilities 85,000 104,000 Bonds payable 100,000 100,000 Total liabilities 185,000 204,000 Stockholders’ equity
Common stock (50,000 shares, $3 par) 150,000 150,000
Paid-In capital in excess of par 20,000 20,000 Retained earnings 45,000 11,000 Total stockholders’ equity 215,000 181,000
Total liabilities and stockholders’ equity 400,000 385,000 Required
Calculate the ratios for 2014 and 2015 and evaluate the company’s efficiency in
managing its assets, its ability to pay short-term debts, its financial risk and its profitability.
When data limitations prohibit computingaverages, use year-end balances in your calculations.
2. Data from Greenwich’s financial statements and industry average are as follow: Unit: $ 2014 2015 2016 PHD.NGUYEN THANH NAM 3 Sales 700,000 800,000 900,000 COGS 450,000 500,000 540,000 Cash 15,000 17,000 20,000 Marketable 18,000 22,000 20,000 securities Notes receivable 3,000 3,000 4,000 Accounts 52,000 56,000 50,000 receivable Merchandise 40,000 43,000 70,000 inventory Prepaid expenses 2,000 4,000 4,000 Current assets 130,000 145,000 168,000 Fixed assets (net) 300,000 310,000 340,000 Total assets 430,000 455,000 508,000 Accounts payable 22,000 25,000 30,000 Current liabilities 40,000 43,000 46,000 Industry averages Receivables turnover: 12 Inventory turnover 12 Total assets turnover 2.5 Fixed assets turnover 3 Payable turnover 20.5 Working capital 8.5 turnover Current ratio 2 Quick ratio 1 Cash ratio 0.5 PHD.NGUYEN THANH NAM 4
Please analyze and evaluate the company’s asset managing efficiency and short-
term obligation paying capacity for the year 2016 and 2015 ( comparision with industry figures)
3. Here are some data of two companies:
($ millions) Best buy Circuit City Revenues 600 1,000 Earnings before 40 130 interest and taxes Interest expense 10 0 Earnings before 30 130 taxes Taxes 10 50 Net income 20 80 Total assets 300 400 Total debt 120 70 Shareholders’ 180 330 equity
Use the extended DuPont analysis to explain the critical factors that account for
the differences in the two companies’ ROEs
4. Berlin’s financial statements are as follow: BERLIN CORPORATION Balance Sheets December 31, 2016 Unit: $1,000 2016 2015 Assets PHD.NGUYEN THANH NAM 5
Cash and marketable securities 3,000 2,000 Marketable securities 5,000 4,000 Accounts receivable (net) 47,000 44,000 Inventories 50,000 60,000 Prepaid expense 2,000 1,000 Total current assets 107,000 111,000
Property, plant and equipment (net) 100,000 105,000 Investments 1,000 1,000 Long-term receivables 3,000 2,000 Goodwill and patents, net 2,000 4,000 Other assets 2,000 3,000 Total long-term assets 108,000 115,000 Total assets 215,000 226,000 Liabilities and equity Notes payable 3,000 5,000 Accounts payable 12,000 16,000 Accrued expenses 9,000 11,000 Income taxes payable 1,000 1,000
Current portion of long-term debt 3,000 2,000 Total current liabilities 28,000 35,000 Bonds payable 30,000 30,000 Long-term debt 20,000 30,000 Deferred taxes 30,000 27,000 Other liabilities 5,000 4,000 Total long-term liabilities 85,000 91,000 Common stock 25,000 25,000
Additional paid-in capital, common 35,000 35,000 Retained earnings 42,000 40,000 PHD.NGUYEN THANH NAM 6 Total equity 102,000 100,000 Total liabilities and equity 215,000 226,000 5. RLIN CORPORATION
Income Statement and Retained Earnings
Year Ended December 31, 20016 Unit: $1,000 2016 2015 Net sales 180,000 150,000 Cost of good sold 147,000 120,000 Gross profit 33,000 30,000
Selling, general, and administrative expenses 25,000 28,000 Operating profit 8,000 2,000 Financial income 1,000 2,000 Financial expenses 10,500 3,000 Earning before taxes (1,500) 1,000 Taxes 0 200 Net income (1,500) 800 Required:
When data limitations prohibit computingaverages, use year-end balances in your calculations.
a. Calculate the ratios : current ratio, quick ratio, cash ratio, fixed assets turnover,
total assets turnover, debt ratio, financial leverage, interest coverage ratio,
operating profit margin, ROS, ROA, ROE for 2016 and 2015
b. Analyse ROE with traditional Dupont and extended Dupont. PHD.NGUYEN THANH NAM 7 PHD.NGUYEN THANH NAM
