Chapter 1: Linear Equations môn Principles of Management | Trường Đại học Quốc tế, Đại học Quốc gia Thành phố Hồ Chí Minh
Tax: Find the equilibrium price and quantity if the government imposes a tax of $t on each good. Tài liệu giúp bạn tham khảo, ôn tập và đạt kết quả cao. Mời đọc đón xem!
Môn: Principles of Management 314 tài liệu
Trường: Trường Đại học Quốc tế, Đại học Quốc gia Thành phố Hồ Chí Minh 2 K tài liệu
Tác giả:


Preview text:
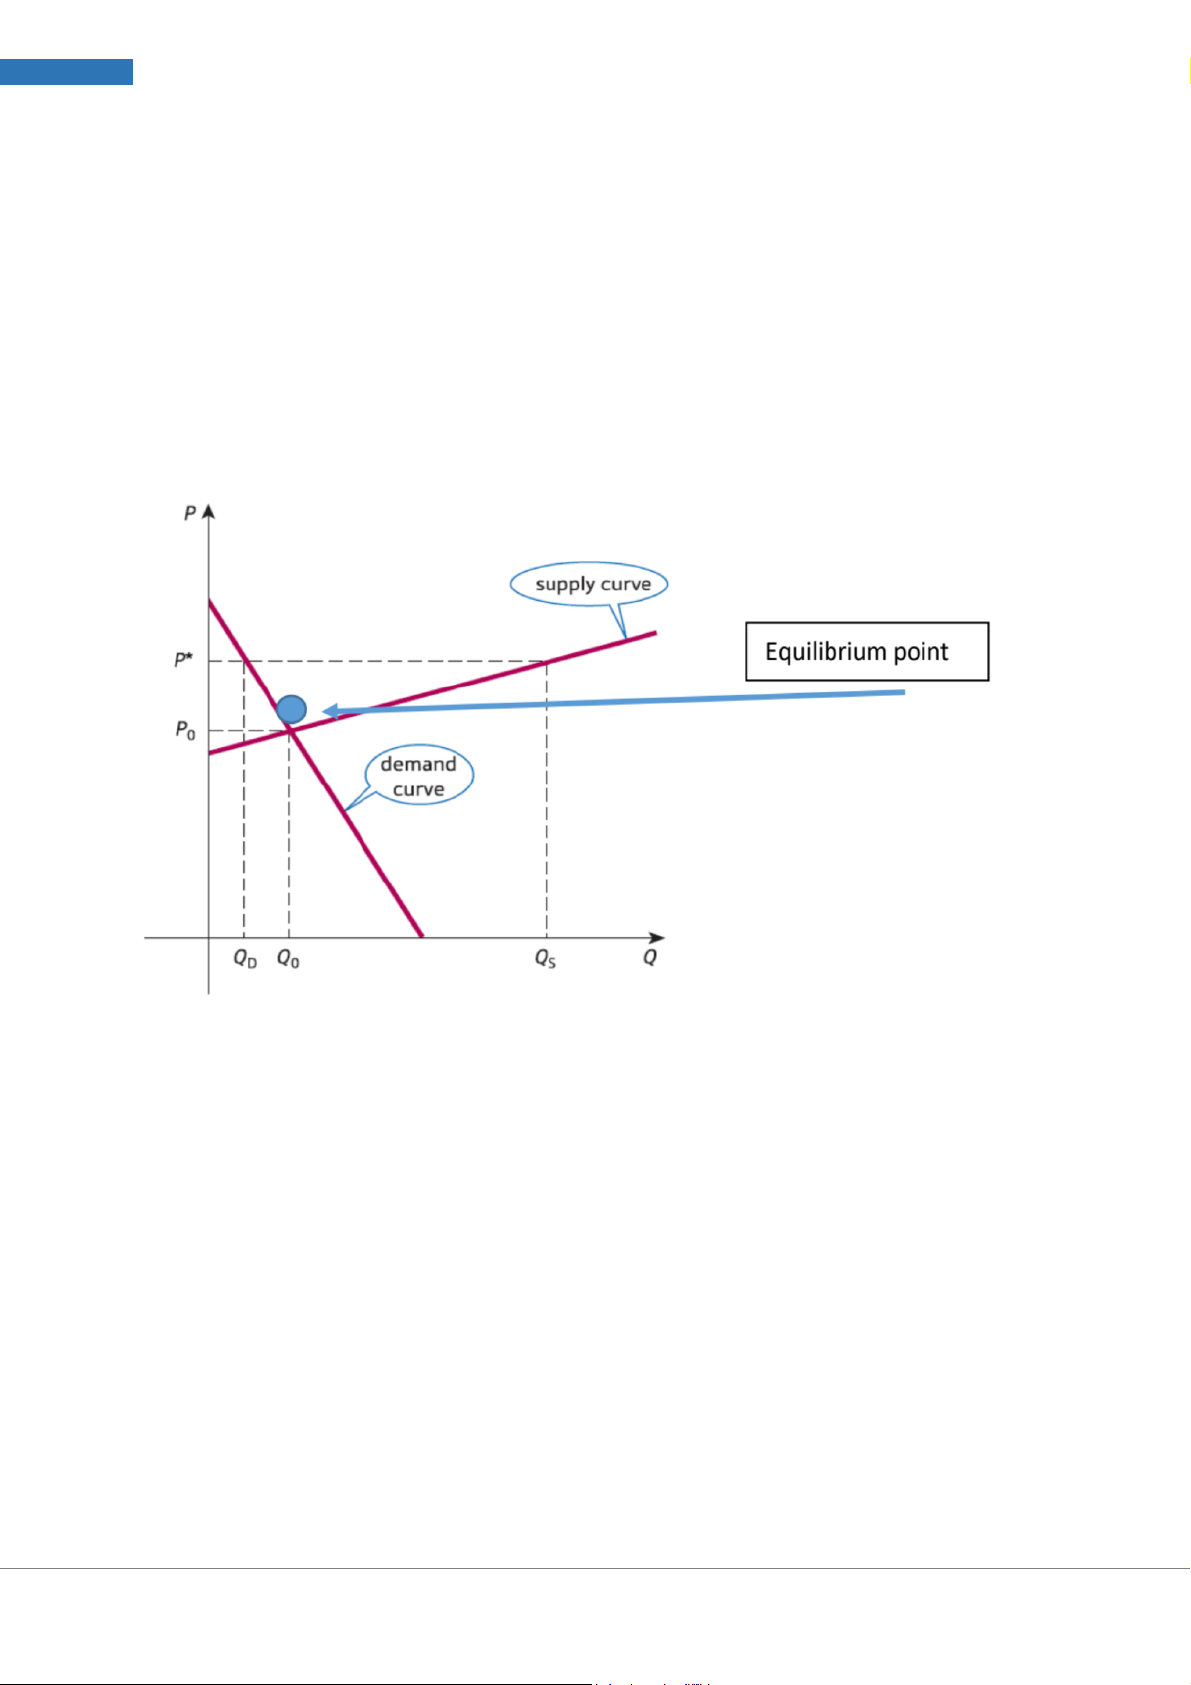
1 Chapter 1: Linear Equations 1. Supply and Demand analysis *Demand function: P= aQd + b *Supply function: P= aQs + b
*At equilibrium point: Qd = Qs Given P = aQd + b (1) P = cQs + d (2)
At equilibrium point, we have Pe = PD = Ps Qe = Qd= Qs
*Tax: Find the equilibrium price and quantity if the government imposes a tax of $t on each good.
=> The new supply function is: Ps – t= cQS + d Ps = cQS + d + t
+ Tax is paid by customer và supplier:
• Customer pay = P (at new equi’ point) – P (at old equi’ point)
• Supplier pay = tax – customer pay
• Tax revenue = tax per unit x Q’ (number of goods sold with tax)
= tax x Q (at new equi’ point)
*Note: Khi đề cho 2 sản phẩm với demand và supply của mỗi sản phẩm thì PD1 = PS1 và PD2 = PS2
Contact: https://www.facebook.com/thutrang.vu308 Email: vuthithutrang2003@gmail.com
2 MATH FOR BUSINESS TA: VŨ THỊ THU TRANG *Sketch the line:
Step 1: lập bảng giá trị (table of values), lấy ít nhất 2 giá trị cho mỗi phương
trình, trong đó nên lấy 1 giá trị tại equilibrium point (intersection) để dễ nhìn
hình và làm các câu kế tiếp.
Step 2: Vẽ hình (chú ý: lần lượt kí hiệu Q, P cho x-axis & y-axis, kí hiệu S và
D cho các đường thẳng tương ứng đã vẽ, lấy giao điểm E tại equilibrium point)
Contact: https://www.facebook.com/thutrang.vu308 Email: vuthithutrang2003@gmail.com
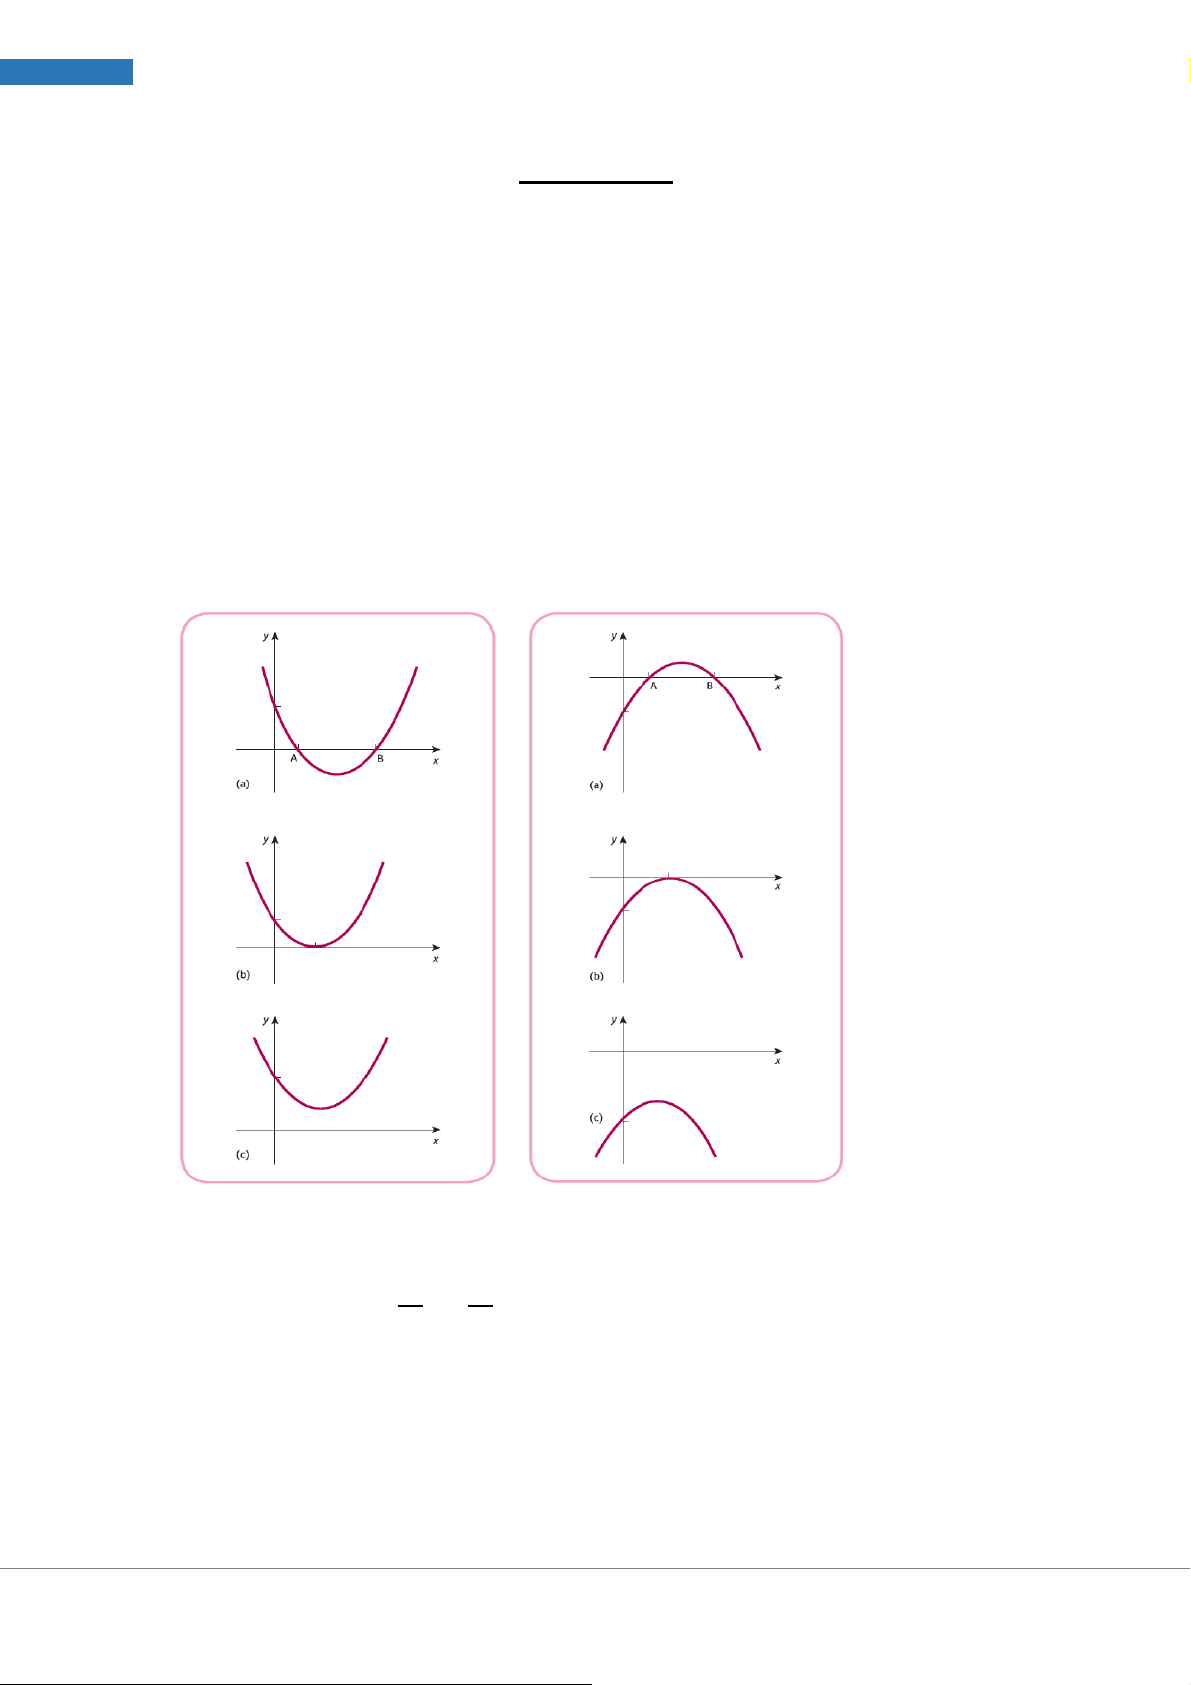
3 MATH FOR BUSINESS TA: VŨ THỊ THU TRANG Chapter 2: Non-Linear Equations 1. Sketch the graph Parabol: y= ax2+bx+c
- Step 1: Determine the basic shape.
if a > 0: the graph has a U shape
if a < 0: an inverted U shape - Step 2: y=0 => x1, x2 - Step 3: nh I ( Đỉ −𝑏 2𝑎 ; − ∆
4𝑎); ∆= 𝑏2− 4𝑎𝑐
Contact: https://www.facebook.com/thutrang.vu308 Email: vuthithutrang2003@gmail.com
4 MATH FOR BUSINESS TA: VŨ THỊ THU TRANG
- Step 4: Determine the intercept. This is obtained by substituting x = 0
into the function, which gives y = c. 2. Revenue, cost and profit
Total revenue: TR = PxQ (t ng doanh thu) ổ
Total cost = Fixed costs + total variable costs (t ng chi phí) ổ TC = FC + TVC = FC + (VC)Q
=> Average cost: AC = 𝑻𝑪 𝑸 = 𝑭𝑪+𝑽𝑪 𝑸(𝑸) = 𝑭𝑪 𝑸 + VC
Profit = Total revenue total cost – π = TR − TC
o Make a profit of a units: π = a
o Make a loss of a units: π = -a o Breaks even: π = 0
o Maximise profit: πmax when 𝜋′=0 𝑎𝑛𝑑 𝜋′′<0. 3. Indices and logarithms
- Production function: Q = f(K,L)
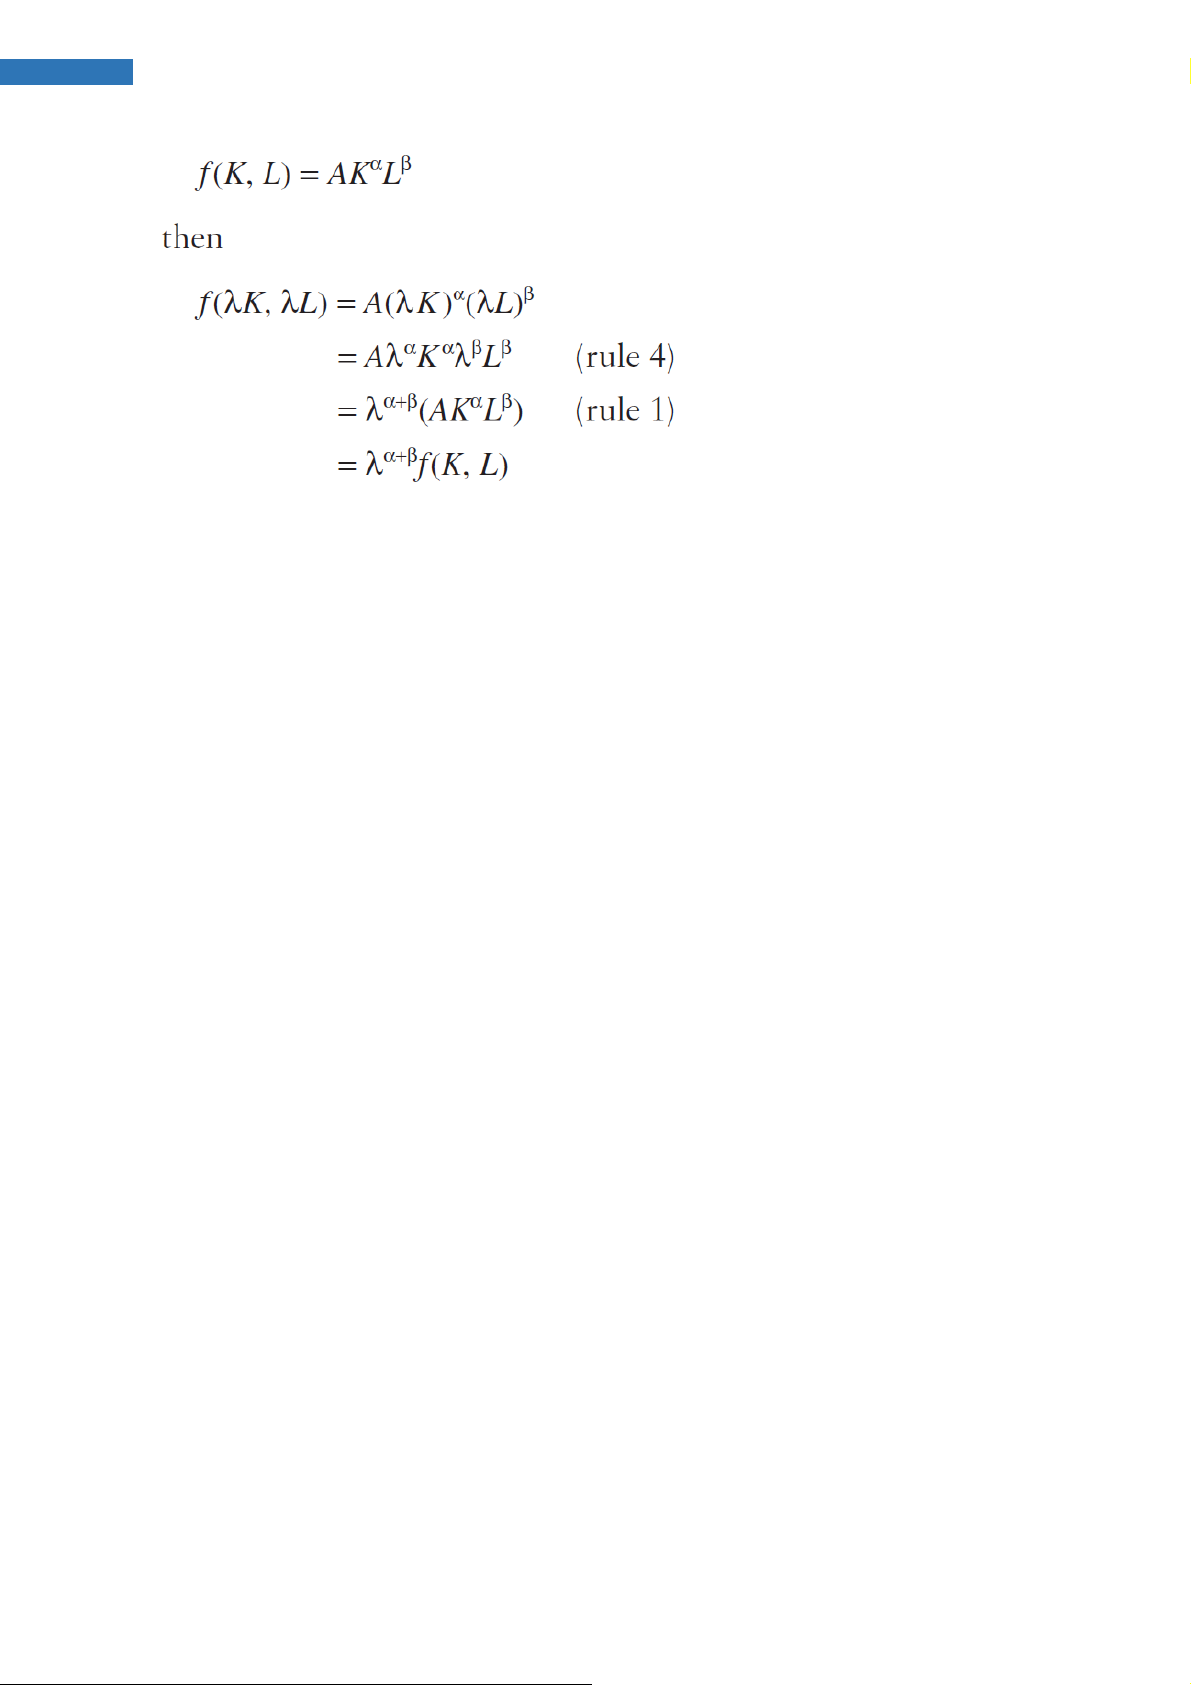
- The production function is said to be homogenous if 𝑓(𝜆𝐾,𝜆𝐿)=𝜆𝑛𝑓(𝐾,𝐿)
• n < 1, the function is said to display decreasing returns to scale.
• n = 1, the function is said to display constant returns to scale.
• n > 1, the function is said to display increasing returns to scale.
- Cobb Douglas production functions: Q – = AKαLβ → homogeneous of degree α + β (n= α + β)
Contact: https://www.facebook.com/thutrang.vu308 Email: vuthithutrang2003@gmail.com
5 MATH FOR BUSINESS TA: VŨ THỊ THU TRANG
Contact: https://www.facebook.com/thutrang.vu308 Email: vuthithutrang2003@gmail.com
Tài liệu liên quan:
-
CHAP 1: Introduction to Management Concepts and Functions môn Principles of Management | Trường Đại học Quốc tế, Đại học Quốc gia Thành phố Hồ Chí Minh
19 10 -
Guidelines for group’s assignments: Analysing management issues of a FDI company based inVietnam môn Principles of Management | Trường Đại học Quốc tế, Đại học Quốc gia Thành phố Hồ Chí Minh
17 9 -
Financial Planning to Achieve 300m VND Goal in 3 Years môn Principles of Management | Trường Đại học Quốc tế, Đại học Quốc gia Thành phố Hồ Chí Minh
17 9 -
A Case Study in Fast Fashion Success môn Principles of Management | Trường Đại học Quốc tế, Đại học Quốc gia Thành phố Hồ Chí Minh
15 8 -
Chap 16 Hierarchy of Needs Theory and Applications môn Principles of Management | Trường Đại học Quốc tế, Đại học Quốc gia Thành phố Hồ Chí Minh
17 9