Chương 2 - Các vấn đề cơ bản về cung và cầu môn Kinh tế vi mô 1 | Học viện Tài chính
Characteristics of demand curve: Downward Sloping·Substitution Effect: when the price of goods increases, consumers tend to buy other goods to replace that good. Tài liệu giúp bạn tham khảo, ôn tập và đạt kết quả cao. Mời đọc đón xem!
Môn: Kinh tế vi mô 1 (MIE) 471 tài liệu
Trường: Học viện Tài chính 1.1 K tài liệu
Tác giả:


Preview text:
CHAPTER 2: BASIC ISSUES OF SUPPLY AND DEMAND MAIN CONTENTS
Demand Theory (Lý thuyết cầu)
Supply Theory (Lý thuyết cung)
Equilibrium of Supply and Demand (Cân bằng cung - cầu)
Surplus Theory (Lý thuyết thặng dư) 1. Demand 1.1. Concept
DEMAND (D) is the quantity (Q) of a good or service that an individual or group of buyers is willing
and able to buy at DIFFERENT prices (P) during a given period of time, all other factors remaining constant. QUANTITY DEMANDED (
) is the quantity of a good or service that an individual or group of QD
buyers is willing and able to buy at ONE particular price during a given period of time, all other factors remaining constant.
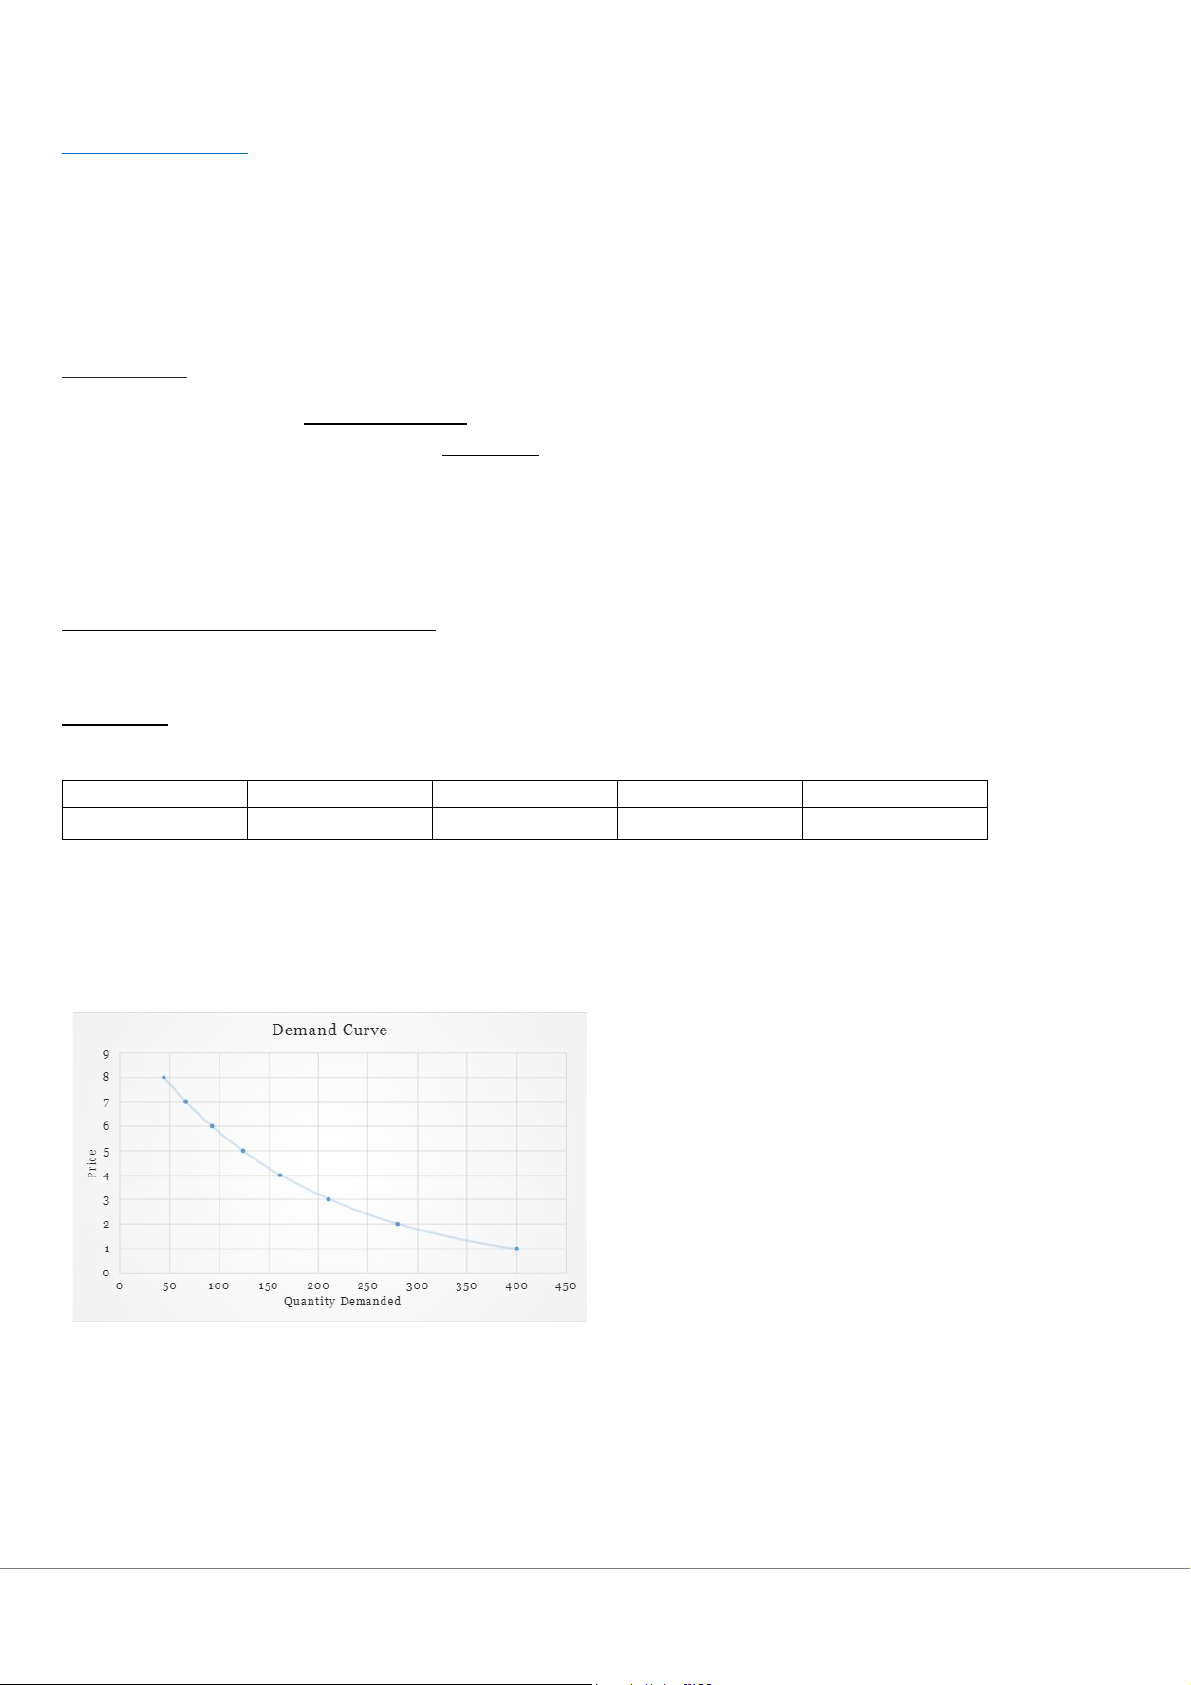
1.2. Forms of demand representation 1.2.1 Demand Schedule:
A TABLE that describes the relationship between the quantities of a good or service that an individual or group
of buyers is willing and able to buy at different prices. P10 20 30 40 30 60 90 120 QD 1.2.2 Demand curve:
A curve that describes the relationship between the quantity of a good or service that an individual or group of
buyers is willing and able to buy at different prices.
Characteristics of demand curve: Downward Sloping
Substitution Effect: when the price of
goods increases, consumers tend to buy
other goods to replace that good.
Income Effect: is the phenomenon that
when the price of goods increases while
income remains unchanged, consumers
will feel poorer so they will reduce consumption. 1.2.3 Demand function D: QD quantity demanded of good X X = f (Px ) QX D: Demand Px: Price of good X
Forward linear demand function: QD= a0−a1PD
Inverse demand function: PD = b0−b1QD 1.3. Law of demand
The quantity of goods or services purchased in the market will increase when the price of that good or
service decreases and vice versa under the condition that other factors remain constant.
Quantity demanded is the point on the demand curve. P D x ↓ → QX ↑ P D x ↑ → QX ↓ 1.4. Factors forming demand
1.4.1 Consumer income (I - Income)
Inferior goods: I ↑ -> D ↓
Normal goods: I ↑ -> D ↑
1.4.2 Prices and availability of related goods Substitute goods: P D D
y ↑ -> QY ↓ -> QX ↑ Complimentary goods: P D D
Z ↑ -> QZ ↓ -> QX ↓
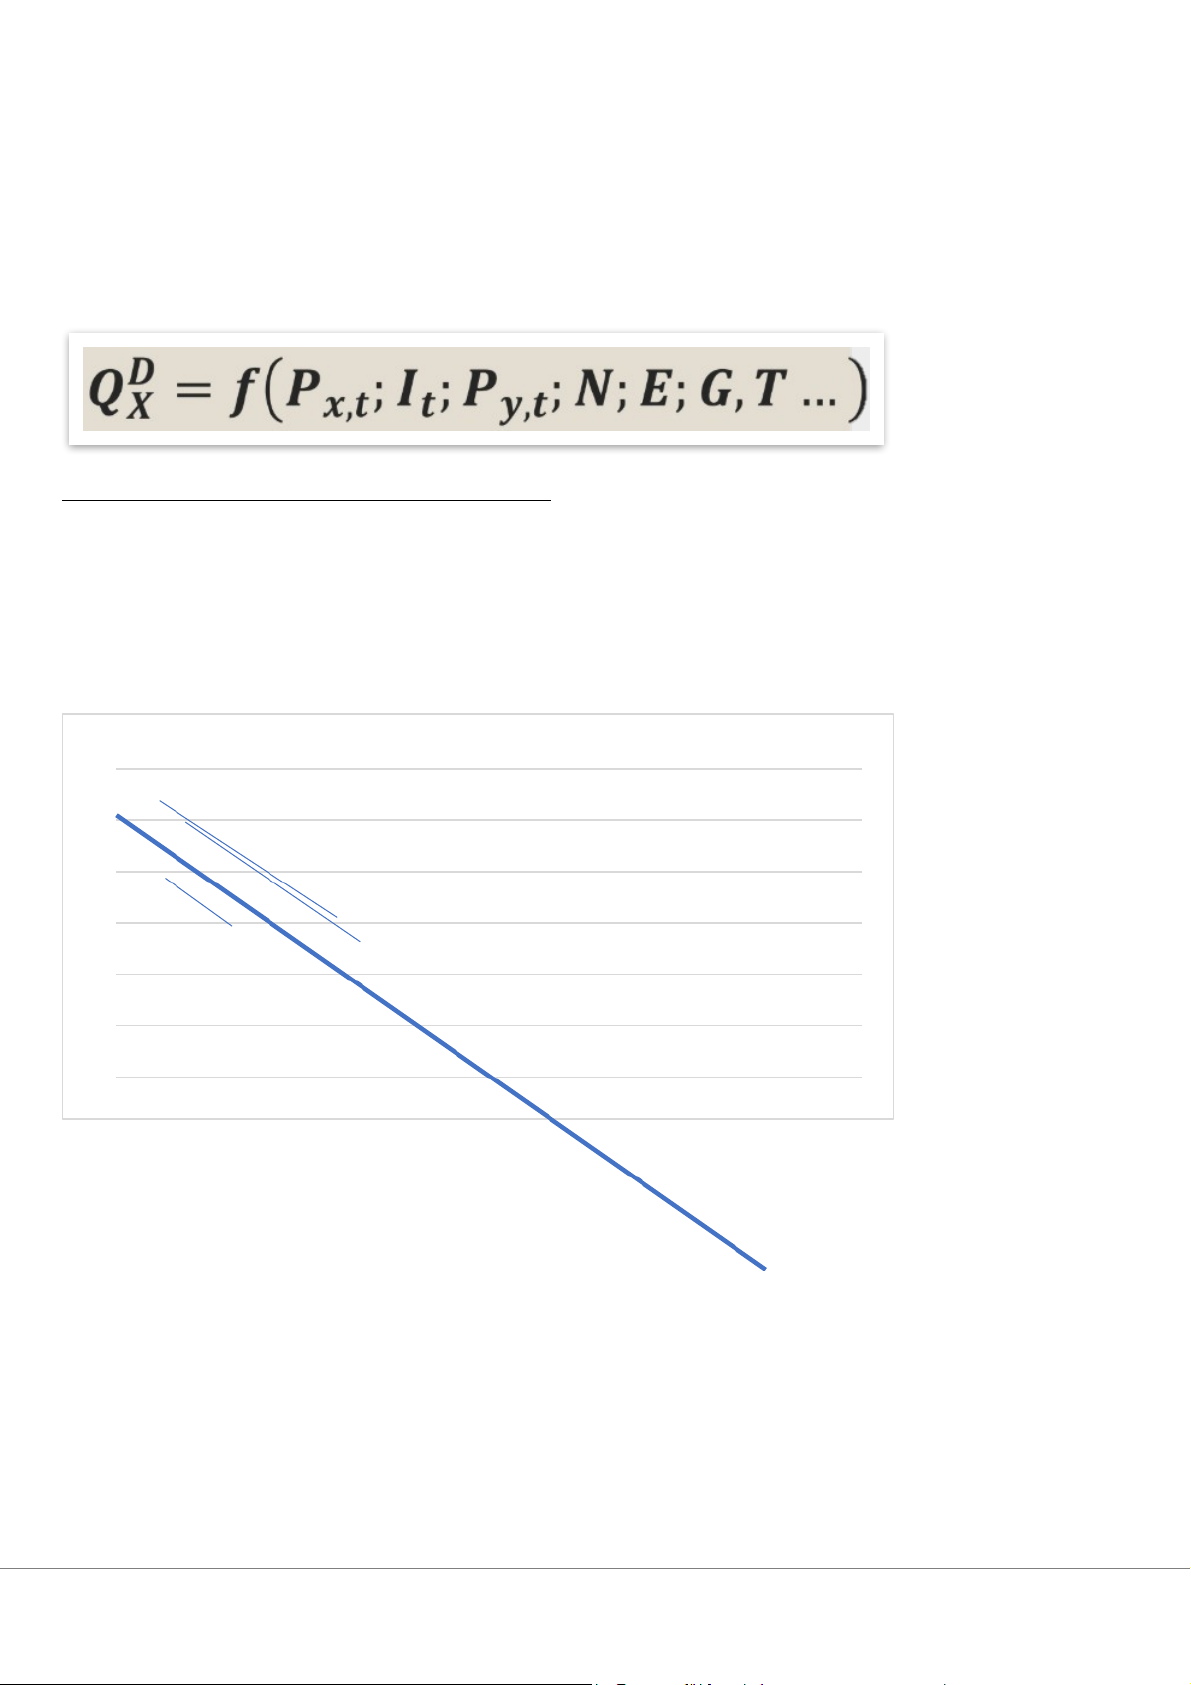
1.4.3 Expectation (E - Expectation) and Government Policy (G – Government Policy)
1.4.4 Market Size (N - Number of Buyers) N↑ -> D ↑
1.4.5 Consumer Taste and Choice (T - Taste)
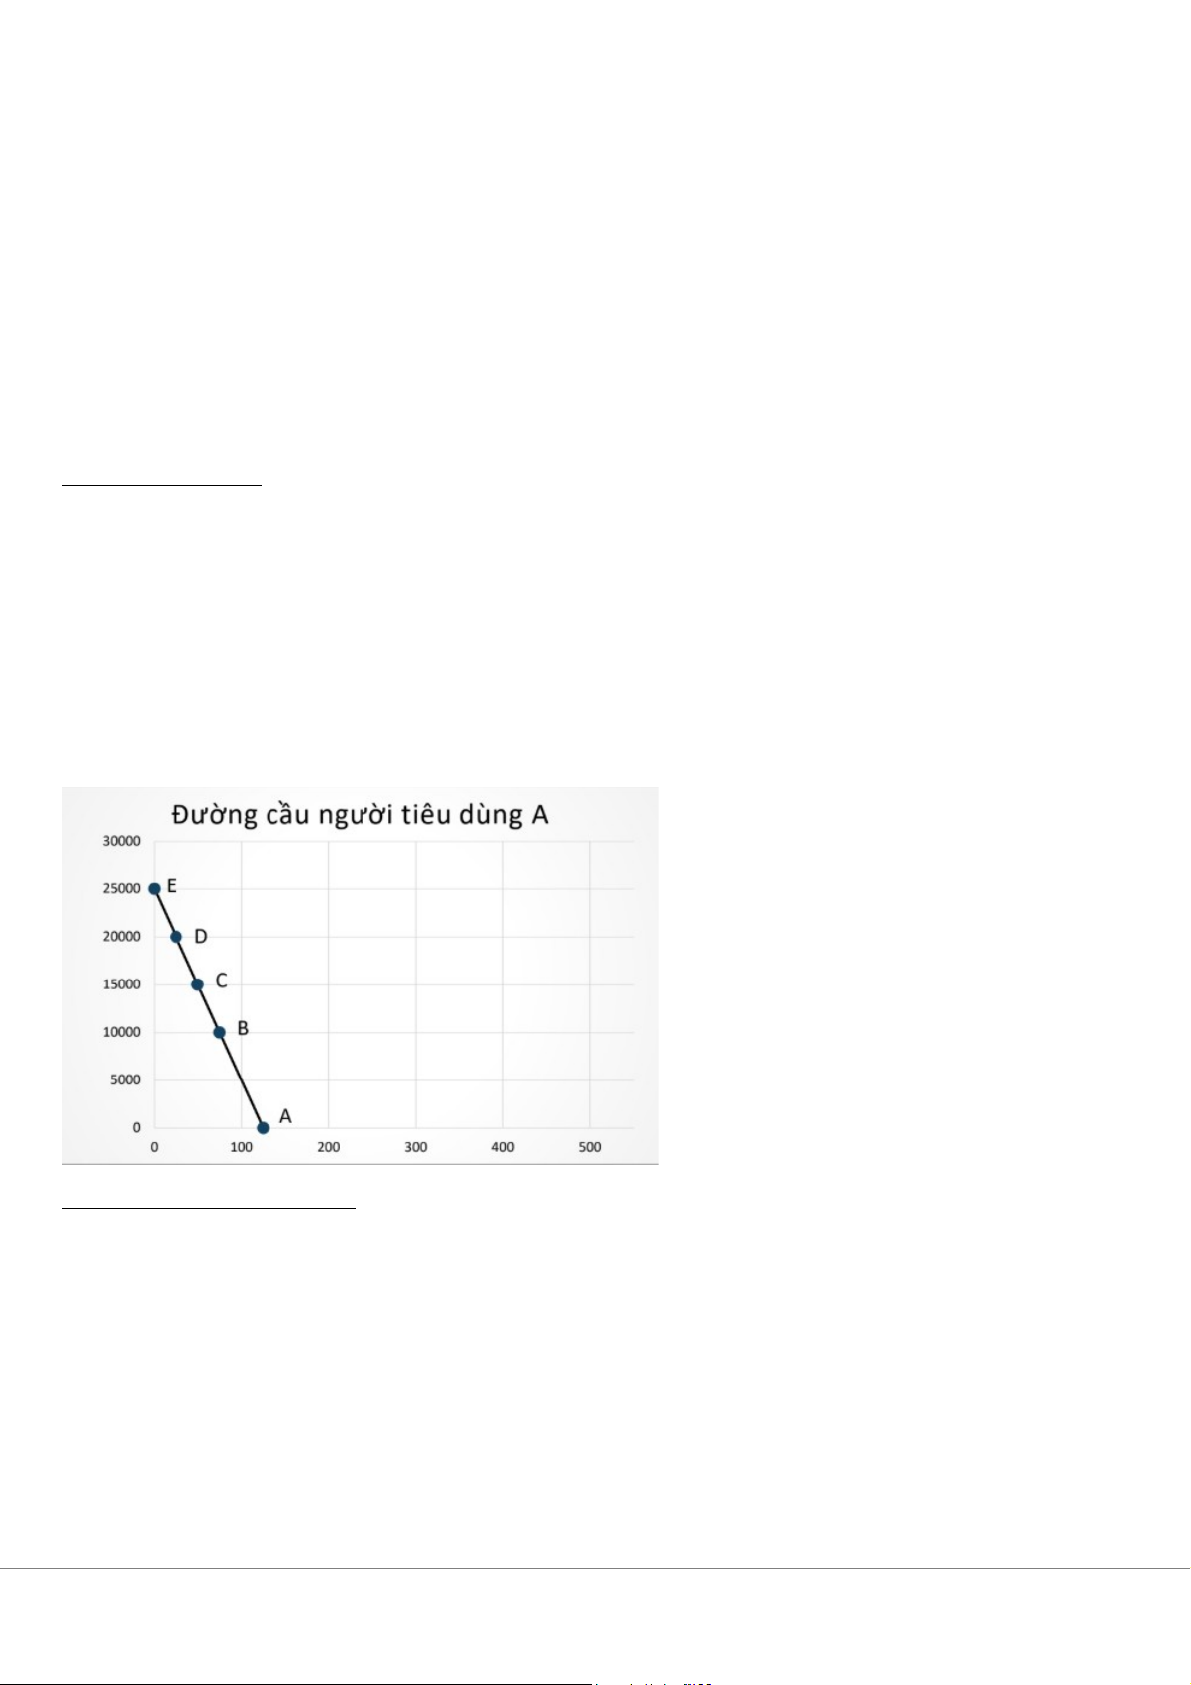
1.5. Changes in quantity demanded and demand
Forward linear demand function: QD= a0−a1PD
Thay đổi của lượng cầu QD PD↝→QD↝ I, N, E, G, T = constant Move along demad curve
Đường cầu người tiêu dùng 3000 A 2500 B 2000 C 1500 1000 D 500 E 0 100 200 300 400 Thay đổi của cầu (D) I, N, E, G, T ↝→ D ↝ PD = constant Shift the whole demand curve
When demand increases, the demand curve shifts to the right.
When demand decreases, the demand curve shifts to the left.
Đường cầu người tiêu dùng 3000 2500 2000 B B' 1500 B' 1000 D1 D2 D3 500 100 200 300 400 500 2. Supply 2.1. Concept
SUPPLY (S) is the quantity of goods or services that a business firm is willing to sell and is able to sell
at different prices in a certain period of time, provided that other factors remain constant. QUANTITY SUPPLIED (
QS) is the quantity of goods or services that a business firm is willing to sell
and is able to sell at ONE specific price in a certain period of time, provided that other factors remain constant.
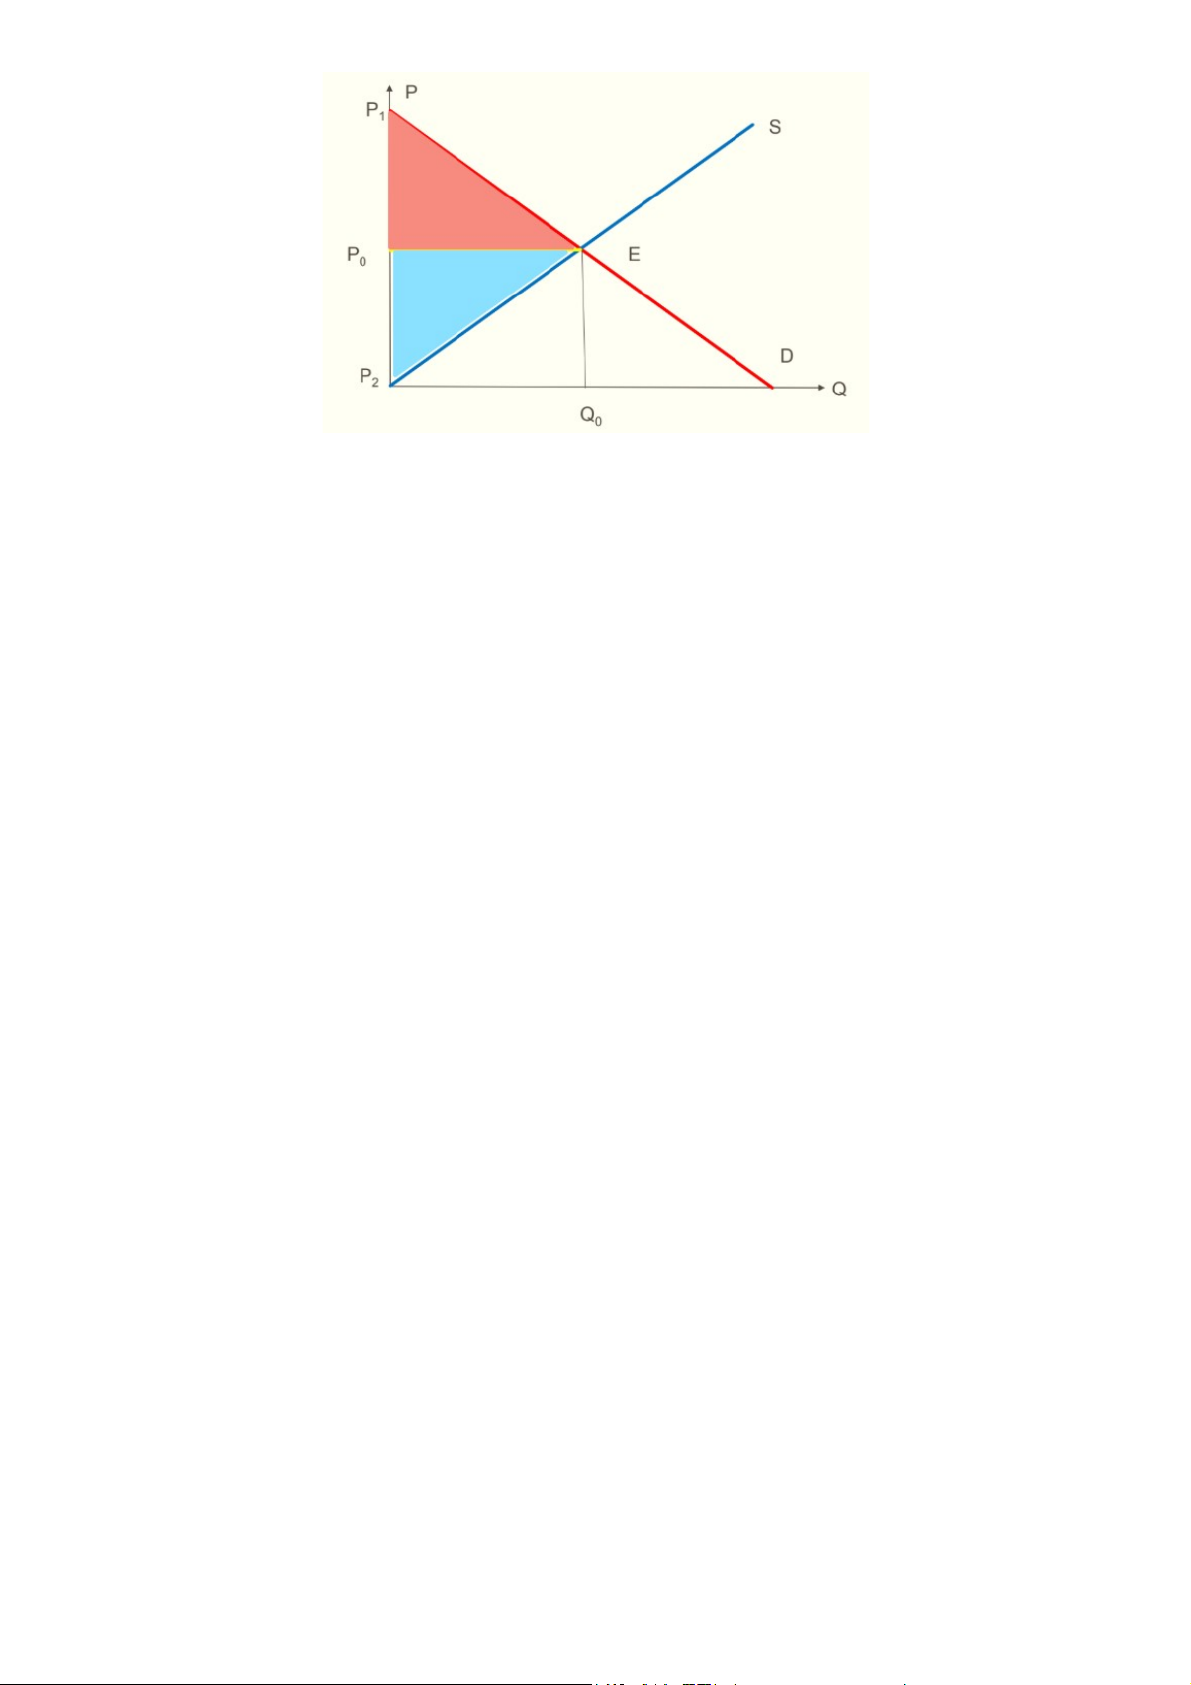
INDIVIDUAL SUPPLY is the supply of a single firm.
MARKET SUPPLY is the horizontal sum of supply of firms (at each price).
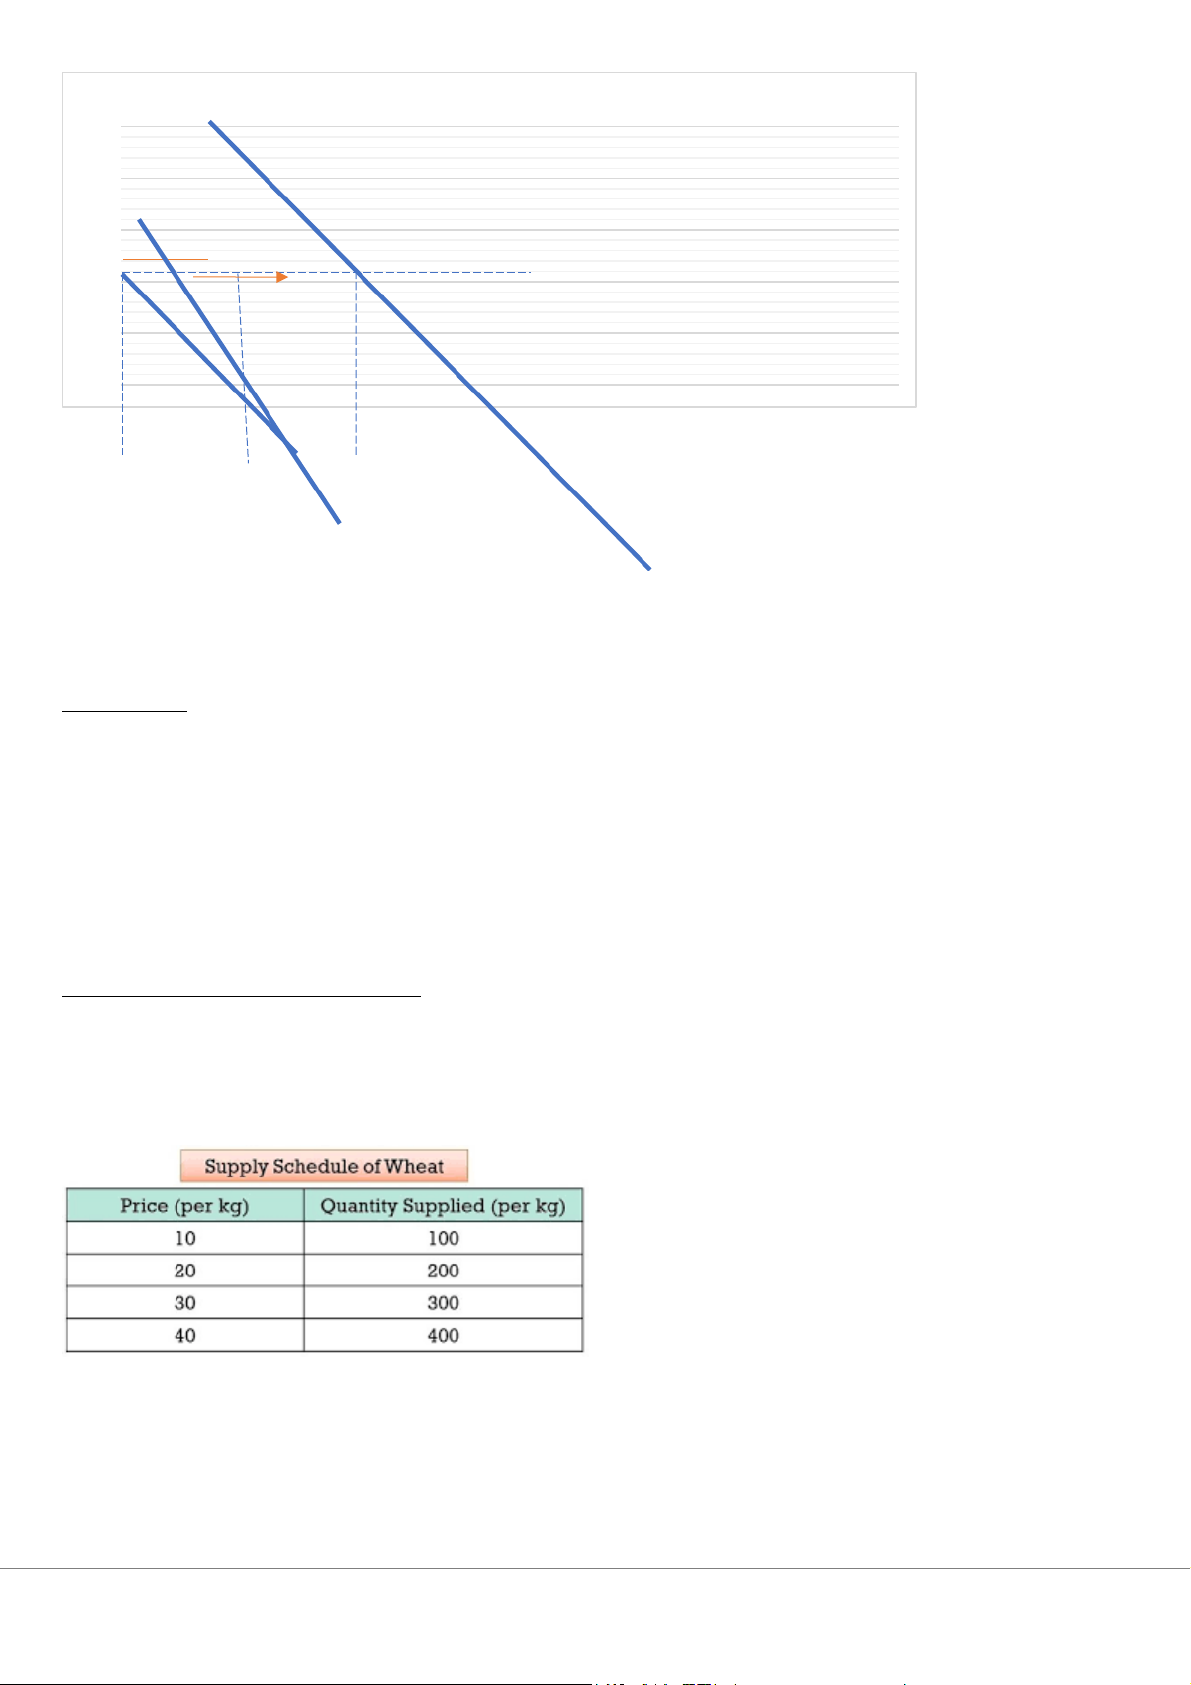
2.2. Forms of supply representation 2.2.1 Supply Schedule:
A TABLE that describes the relationship between the quantities of a good or service that a business firm is
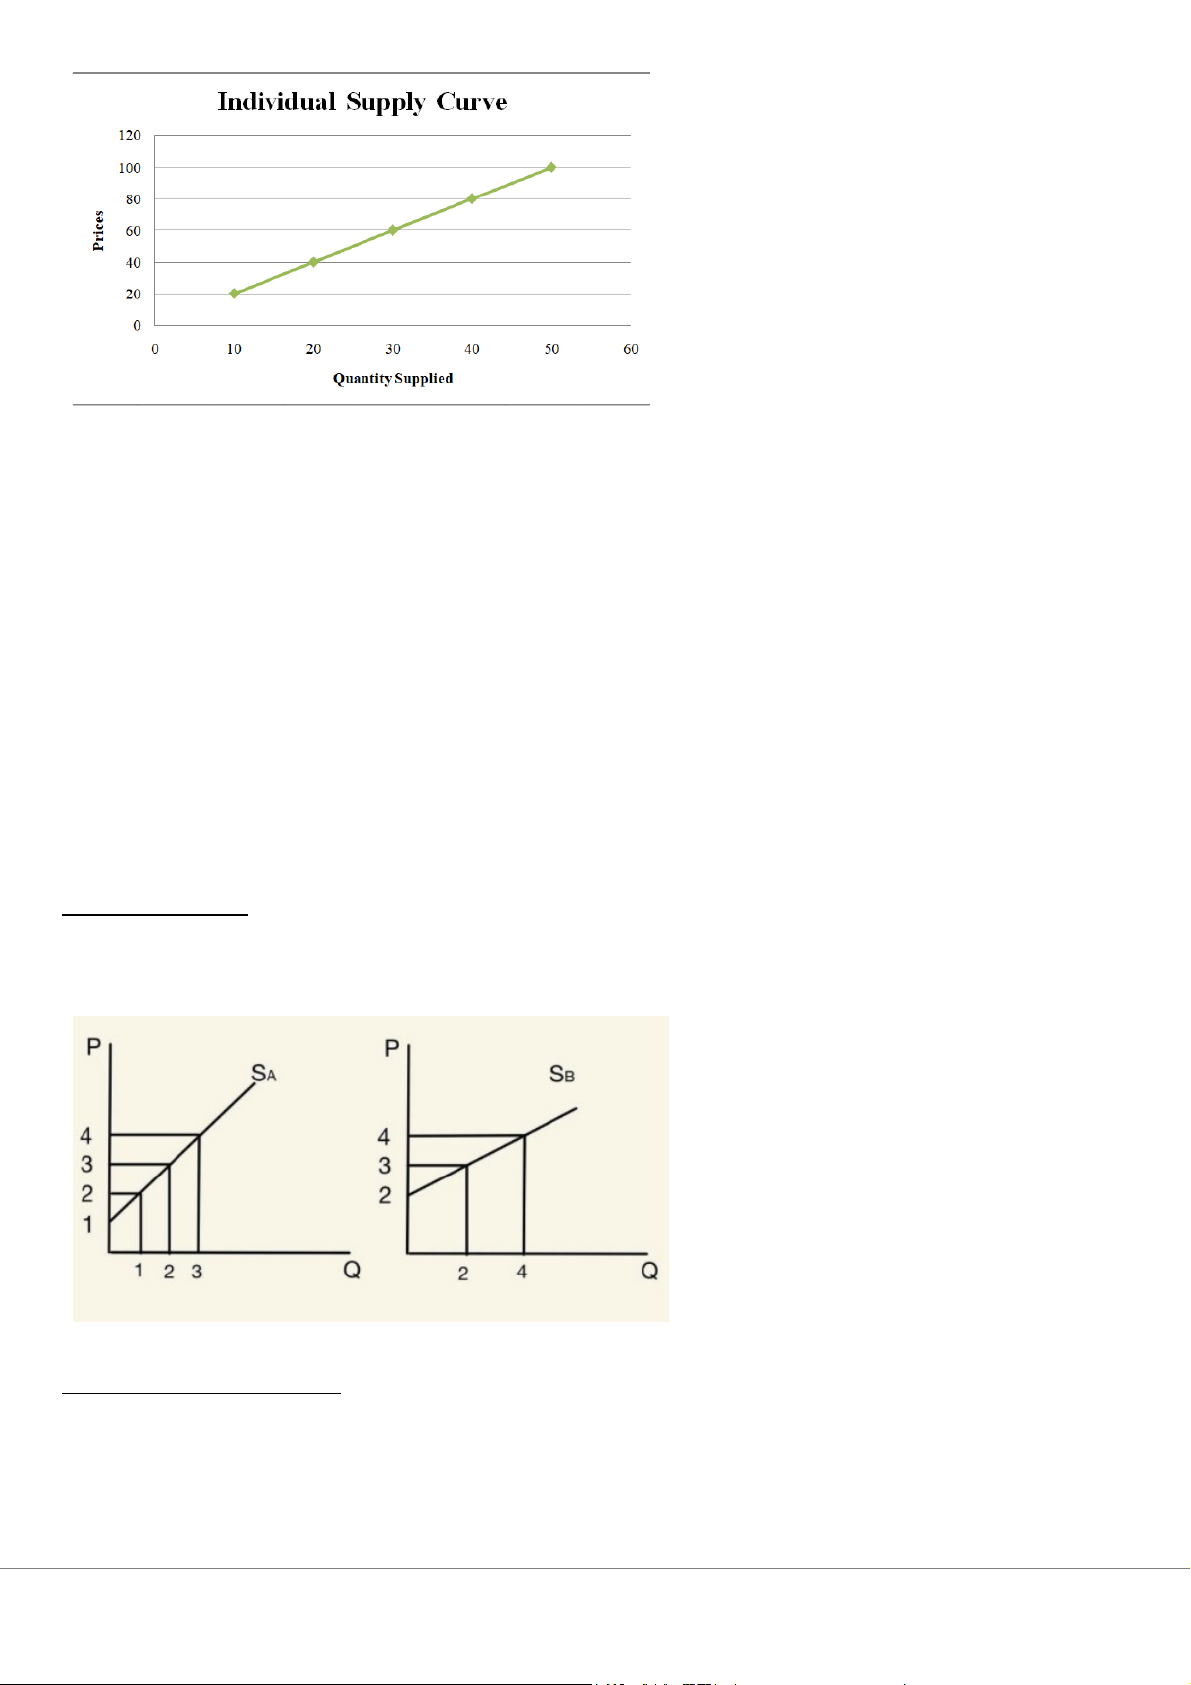
willing to sell and is able to sell at different prices. 2.2.2 Supply curve:
A curve that describes the relationship between the quantities of a good or service that a firm is willing and able to sell at different prices.
Characteristics of supply curve: Upward Sloping 2.2.3 Supply function S : QS quantity supplied of good X X = g (Px) QX S: Supply Px: Price of good X
Forward linear supply function: QS= c0+c1PS
Inverse supply function: PS = d0+d1QS 2.3. Law of supply
The quantity of goods or services sold in the market will increase when the price of that good or service
increases and vice versa, other factors remaining constant. P S x ↓ → QX ↓ P S x ↑ → QX ↑ 2.4. Factors forming supply
2.4.1 Government Policy (G - Government Policy) Taxes 2.4.2 Production Technology 2.4.3 Prices of Input Factors PI ↓ → S↑
2.4.4 Scale of production or number of producers N↑ -> S ↑ 2.4.5 Expectations (E)
2.4.6 Price of substitute goods Substitute goods: P S S
y ↑ -> QY ↑ -> QX ↓
2.5. Changes in supply quantity and supply
Forward linear supply function: QS= c0+c1PS
Thay đổi của lượng cầu QS PS↝→ QS↝ I, N, E, G, T = constant Move along supply curve Thay đổi của cung (S) I, N, E, G, T ↝→ S ↝ PS = constant Shift the whole supply curve
When demand increases, the supply curve shifts to the right.
When demand decreases, the supply curve shifts to the left.
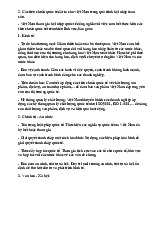
3. Equilibrium of Supply and Demand (Cân bằng cung - cầu)
4. Surplus Theory (Lý thuyết thặng dư)
Consumer surplus (CS) is the difference
Producer surplus (PS) is the difference
between the highest price a consumer is
between the actual selling price of a good or
willing to pay for a good or service and the
service-the market price-and the price a
actual buying price -the market price. producer is willing to accept.
The area below the demand curve, above the
The area below the price curve, above the
price curve, and limited by the quantity traded
supply curve, and limited by the quantity traded
Tài liệu liên quan:
-
Các tiêu chuẩn quốc tế đặt ra cho Việt Nam trong quá trình hội nhập toàn cầu môn Kinh tế vi mô 1 | Học viện Tài chính
27 14 -

Phương pháp giải bài tập và đề thi môn Kinh tế vi mô 1 | Học viện Tài chính
27 14 -
Câu hỏi ôn tập chương 5 & 6 môn Kinh tế vi mô 1 | Học viện Tài chính
27 14 -
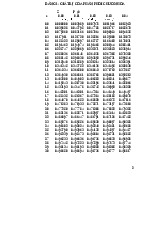
Bảng Giá Trị Thống Kê - Phân Phối Fisher & Durbin-Watson môn Kinh tế vi mô 1 | Học viện Tài chính
24 12 -
Đề cương ôn tập môn Kinh tế vi mô 1 | Học viện Tài chính
22 11