Chương 3 & 4 - tài liệu thống kê mô tả: phương pháp số liệu môn xác suất thống kê| Đại học Duy Tân
a) The central data point reflects the locations of all the actualdata points i) As more and more data points are added, the central location moves as required to reflect the effects of all the points. Tài liệu giúp bạn tham khảo, ôn tập và đạt kết quả cao. Mời đọc đón xem!
Môn: Xác xuất thống kê (STA 151) 144 tài liệu
Trường: Đại học Duy Tân 2 K tài liệu
Tác giả:


Preview text:
23:40, 10/01/2026
CHƯƠNG 3 & 4 - TÀI LIỆU THỐNG KÊ MÔ TẢ: PHƯƠNG PHÁP SỐ LIỆU - Studocu
CHAPTER 3: DESCRIPTIVE STATISTICS – NUMERICAL METHODS
1) Measures of Central Location
a) The central data point reflects the locations of all the actual data points
i) As more and more data points are added, the central location moves as required to
reflect the effects of all the points
b) The Arithmetic Mean = sum of measurements/ number of measurements i) c) The Geometric Mean
i) Usage: Find the average growth rate, or change rate of a variable over time ii) Formula
(1) Step 1: Express the rate of change R as (1 + R)
(2) Step 2: Calculate the geometric mean using the formula iii) Example: (1) (2)
d) Characteristics of the Mean:
i) A representative of a data set
ii) Can be affected by extreme value
iii) Used to compare different-sized data sets e) The : Median
i) Is the value that falls in the middle, when the measurements are arranged in order of magnitude
ii) Pay attention to the number of obs (k)
(1) K is odd => median = the number at the (k + 1)/2th location of the ordered array
(2) K is even=> median = the average of the 2 numbers in the middle (k/2)th and (k/2 + 1)th 23:40, 10/01/2026
CHƯƠNG 3 & 4 - TÀI LIỆU THỐNG KÊ MÔ TẢ: PHƯƠNG PHÁP SỐ LIỆU - Studocu f) The Mode:
i) Is the value that occurs most frequently
ii) A set of data can have one mode (unimodal) or 2 or more modes
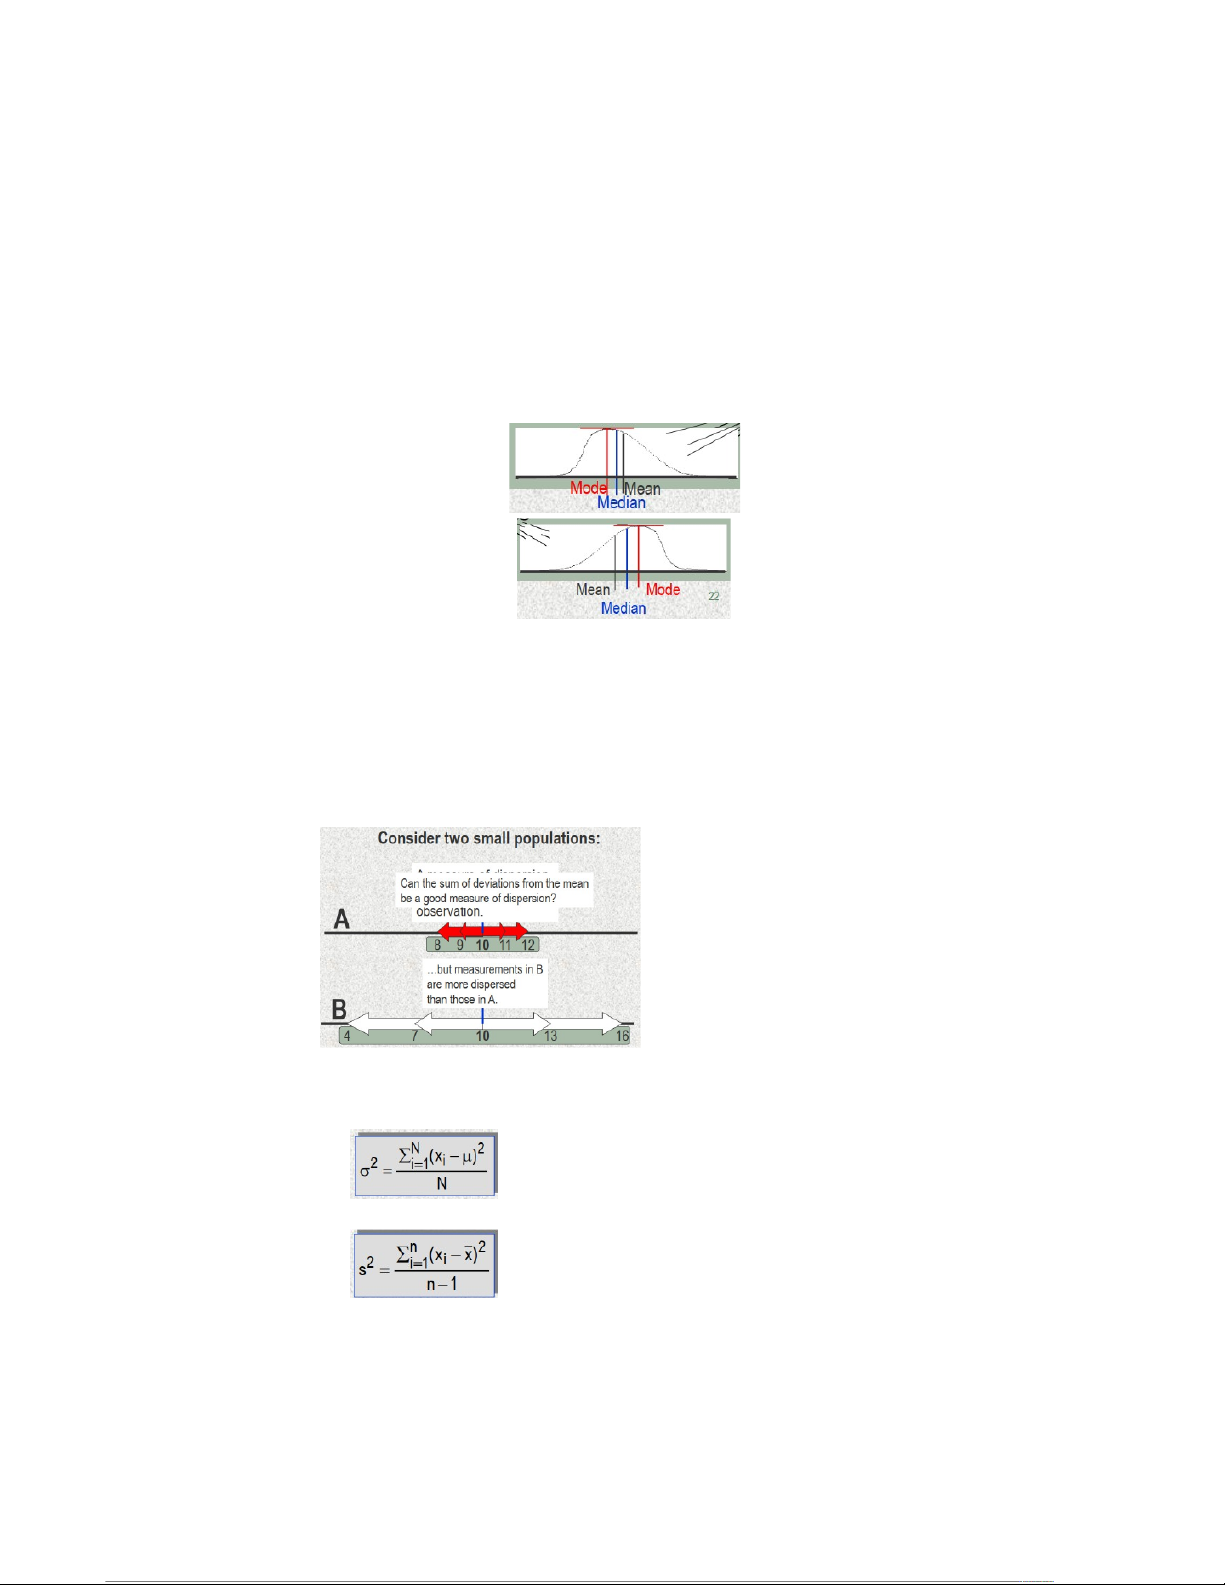
g) Relationship among Mean, Median, Mode
i) If distribution is symmetrical, mean, median, mode coincide
ii) If not, or skewed to the left or right, 2 measures differ (1) Positively skewed: Mean > Median > Mode (2) Negatively skewed: Mode > Median > Mean
h) Usage of Mean, Median, Mode:
i) Mean – sensitive to extreme values, used in most statistical analyses
ii) Median – not affected by extreme values, not reflect all the values in the data set
but the location of the middle observation
iii) Mode – used for categorical data 2) Measures of Variability
a) Measures of central location fail to tell the whole story about the distribution
i) The dispersion (variability is as important as the central location ii) b) The Variance
i) Reflects the dispersion of all the values
ii) Variance of a population (with N values and Mean of µ) (1)
iii) Variance of a sample (with n values and Mean of x có gạch ngang trên đầu) (1) iv) Example: 23:40, 10/01/2026
CHƯƠNG 3 & 4 - TÀI LIỆU THỐNG KÊ MÔ TẢ: PHƯƠNG PHÁP SỐ LIỆU - Studocu (1) v) Shortcut Method: (1) Sample Variance: c) The Standard Deviation:
i) Is the square root of the set variance (1)
ii) Empirical Rule for a Bell Shaped Data set
(1) It is symmetric around its mean with
(a) 68 percent of the observations within 1 standard deviation of the mean
(b) 95 percent of the observations within 2 standard deviation of the mean
(c) 99,7 percent of the observations within 3 standard devitation of the mean (2)
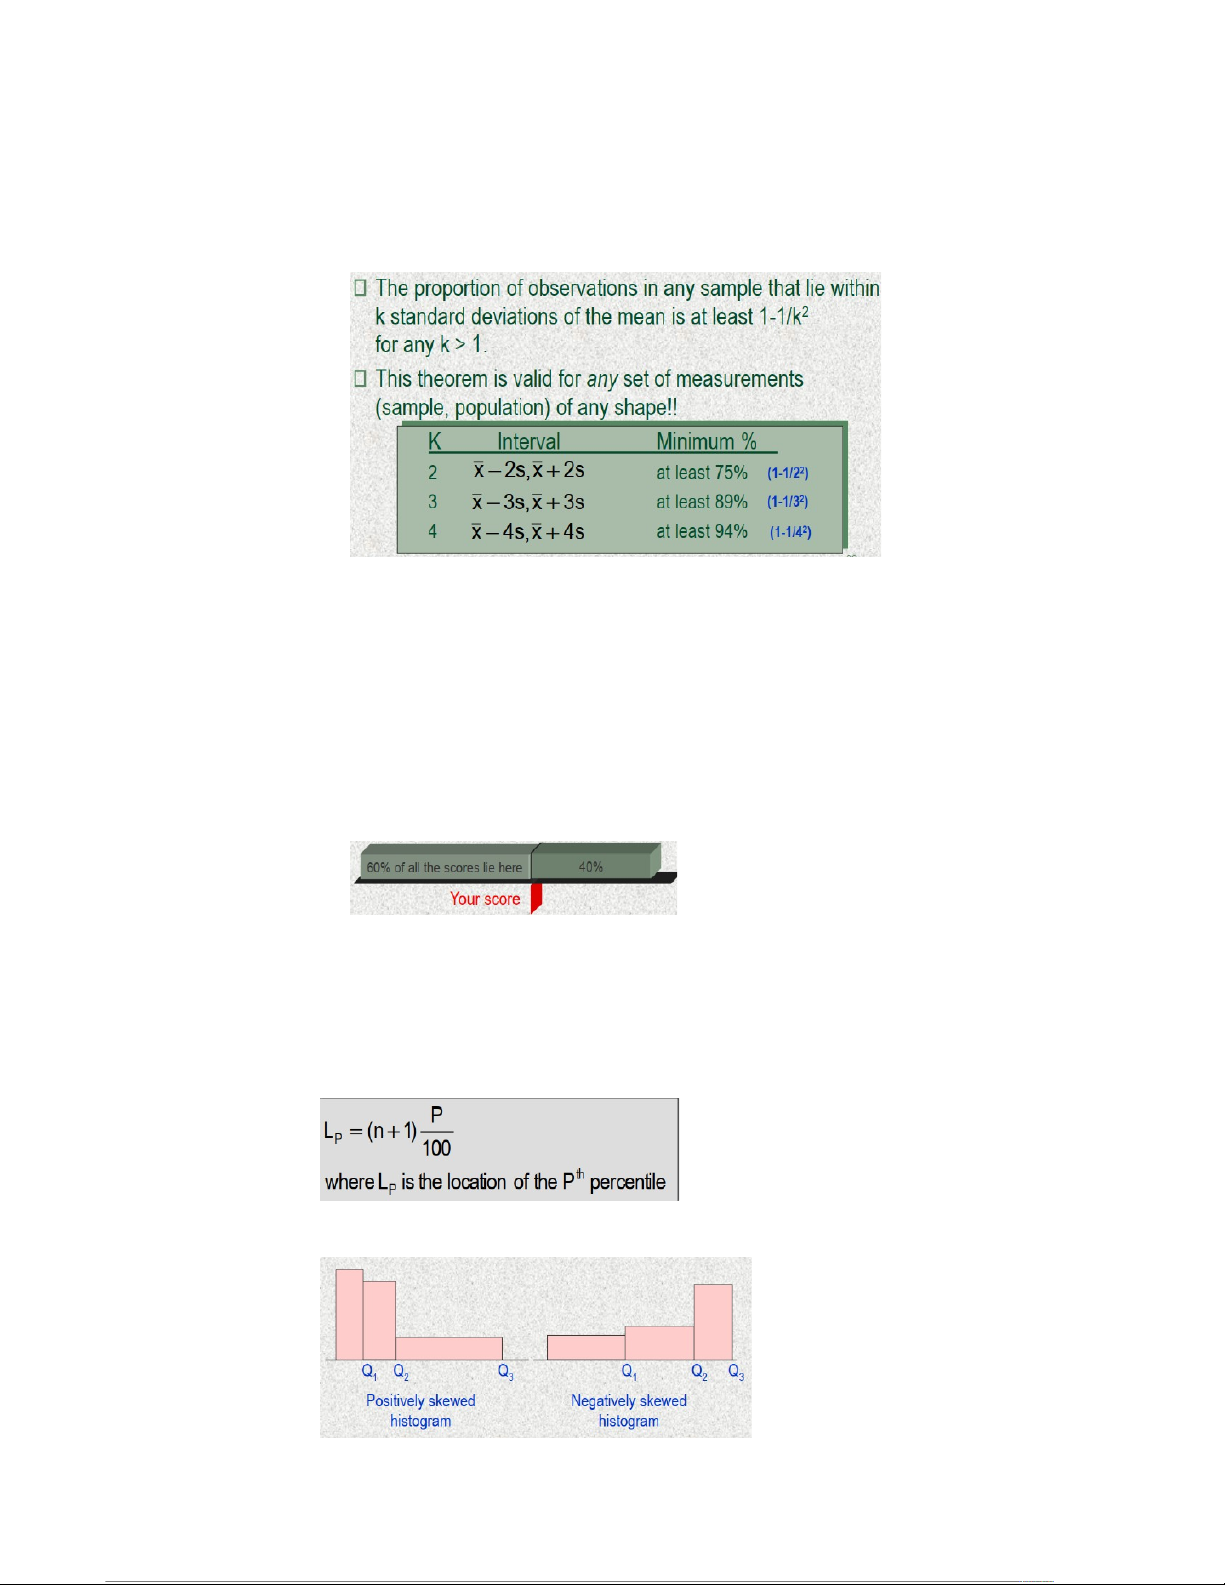
iii) The Chebyshev Theorem – Describing Any Data Set 23:40, 10/01/2026
CHƯƠNG 3 & 4 - TÀI LIỆU THỐNG KÊ MÔ TẢ: PHƯƠNG PHÁP SỐ LIỆU - Studocu (1)
iv) Summary of the 2 theories through an example:
(1) Mean = 70, Standard deviation = 5
(2) If the histogram is bell-shaped => 68% of the values fell between the 65 and
75, 95% 60 and 80, and 99,7% 55 and 85
(3) If the histogram is not bell-shaped, 75% is 60 80, 89% is 55 85
3) Measures of Relative Location and Box Plots a) Percentile
i) The pth percentile of a set of measurements is the value for which
(1) p% of the measurements < that value
(2) (100 – p)% of all the measurements > that value
ii) Example: suppose your score is the 60th percentile of a SAT test (1) b) Commonly used Percentile:
i) First/ Lower Decile = 10th percentile
ii) First/ Lower Quartile (Q ) = 25 1 th percentile iii) Median = 50th percentile iv) Third Quartile (Q ) = 75 3 th percentile
v) Upper Decile = 90th percentile
c) Formula for Location of any Percentile i) d) Quartile and Variability:
i) Quartile can provide an idea about the shape of a a histogram: ii) 23:40, 10/01/2026
CHƯƠNG 3 & 4 - TÀI LIỆU THỐNG KÊ MÔ TẢ: PHƯƠNG PHÁP SỐ LIỆU - Studocu e) Interquartile range:
i) Is a measure of the spread of the middle 50% of the observations
ii) Large value indicates a large spread of the observations
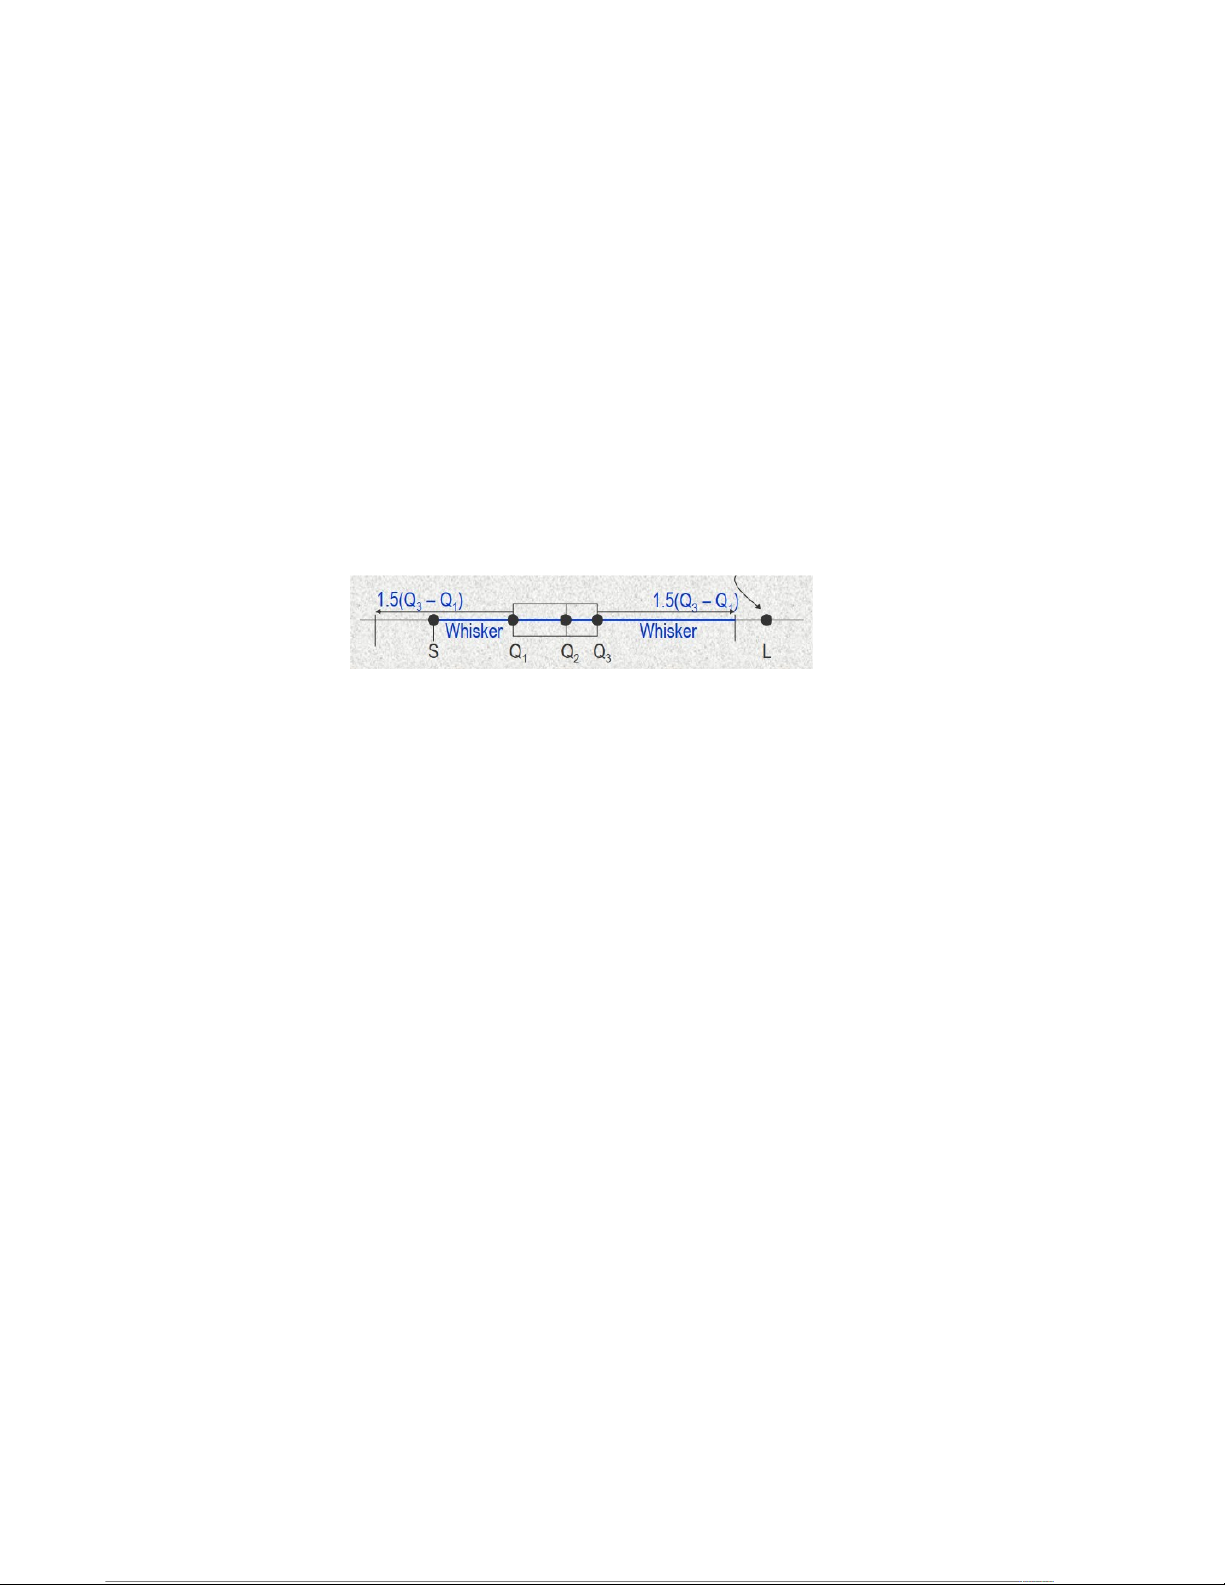
(1) Inter quartile range = Q – Q 3 1 f) Box Plot:
i) Is a pictorical display that provides the main descriptive measures of the measurement set: (1) L – largest measurement (2) Q3 – the upper quartile (3) Q2 – the median (4) Q1 – the lower quartile
(5) S – smallest measurement (6)
(7) An Outlier is any value > 1,5.(Q – Q 3 ) away from the box 1 23:40, 10/01/2026
CHƯƠNG 3 & 4 - TÀI LIỆU THỐNG KÊ MÔ TẢ: PHƯƠNG PHÁP SỐ LIỆU - Studocu
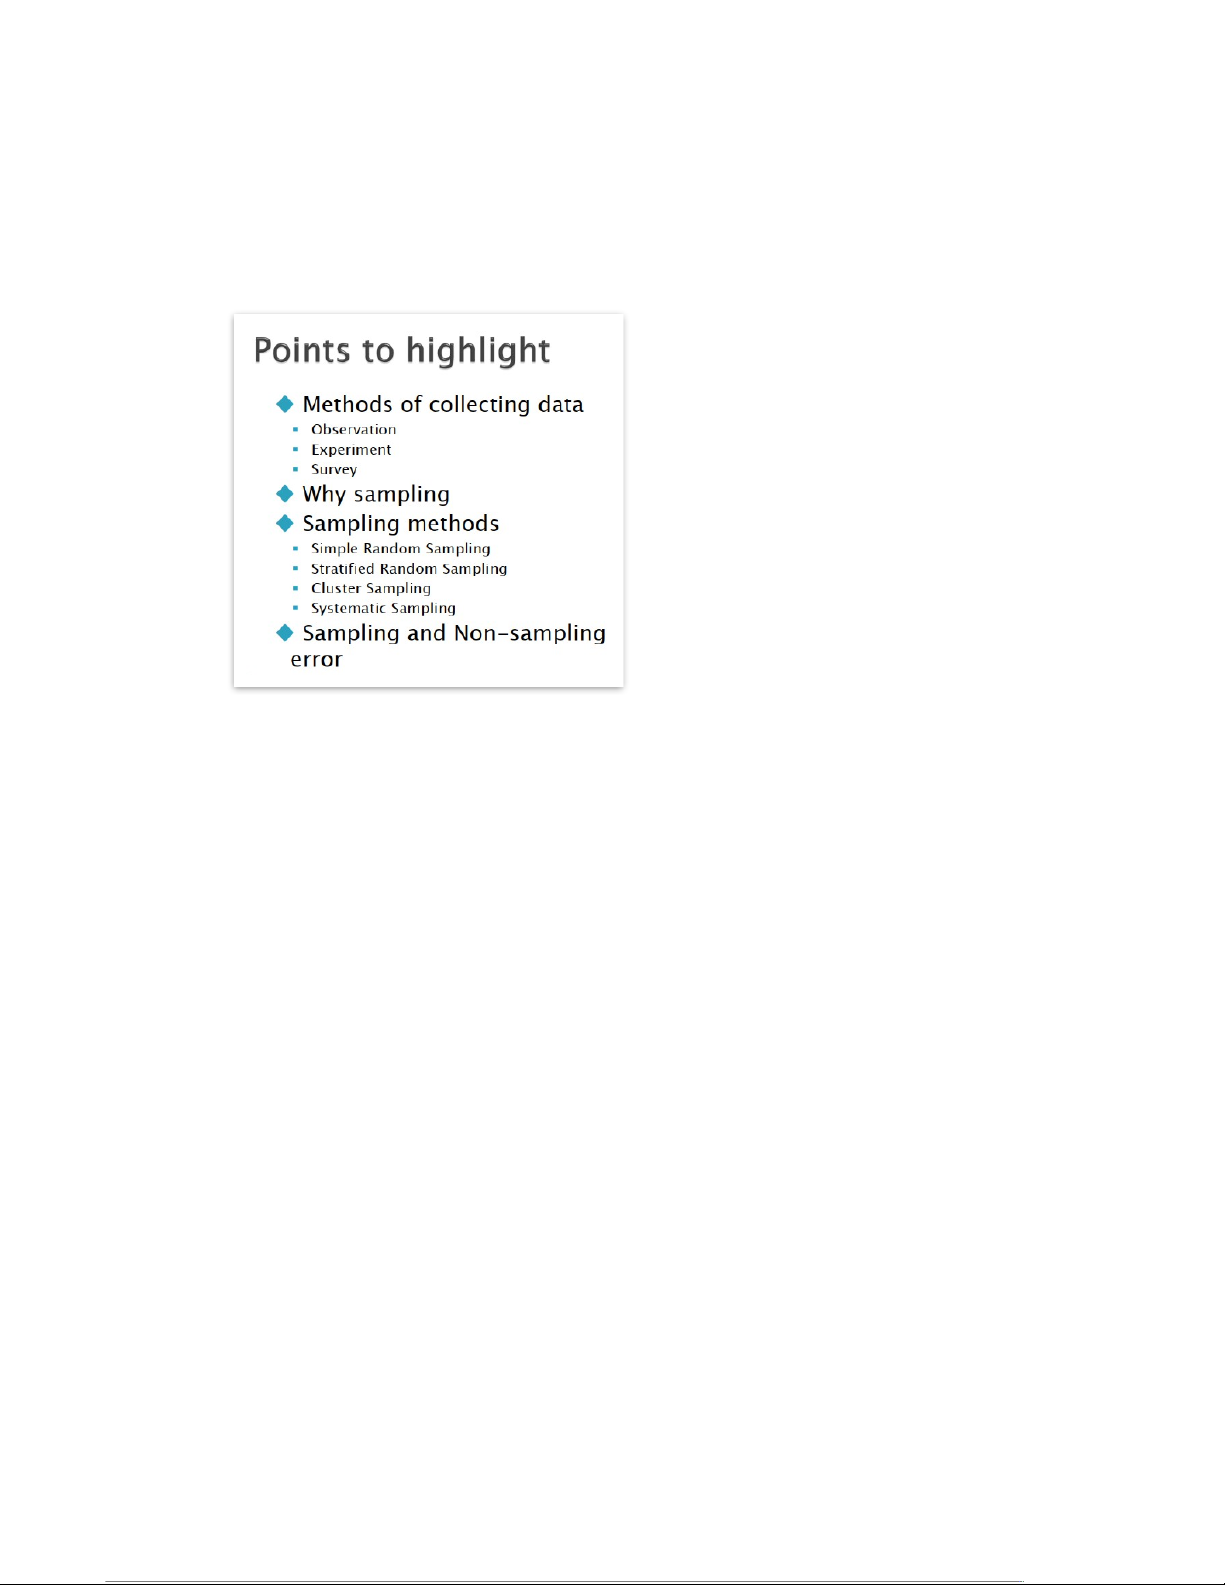
CHAPTER 4: DATA COLLECTION AND SAMPLING Data Sources:
Primary (or Data Collection): observation, survey, experimentation
Secondary (or Data Compilation): print or electronic 1) Methods of Collecting Data a) Observation:
i) Investigator observes characteristics of a subset of members of one or more
existing populations => draw conclusions about the corresponding population or
difference between 2 populations
ii) Advantages: easy to conduct, inexpensive
iii) Disadvantages: little useful info, impossible to reach cause and effect b) Survey:
i) Is one of the most familiar methods of collecting data => Survey is used to solicit
info from people concerning things
ii) Survey is usually conducted for private use iii) Forms of Survey:
(1) Personal Interview: high rate of response, few incorrect answers but costly
(2) Telephone Interview: less expensive, but less personal and lower response rate
(3) Mail Survey: inexpensive, low response rate, high number of incorrect answers iv) Designing Process: (1) Define the Issue
(2) Deciding what to measure and how to measure
(3) Define the Population of interest (4) Design Questionnaire: (a) Short questionnaire
(b) Short, simple, clear, not leading questions
(c) Begin with simple demographic questions
(d) Use both close-ended (dichotomous) and open-ended questions (5) Pre-test the survey 23:40, 10/01/2026
CHƯƠNG 3 & 4 - TÀI LIỆU THỐNG KÊ MÔ TẢ: PHƯƠNG PHÁP SỐ LIỆU - Studocu
(6) Determine the sample size and sampling method
(7) Select sample and administer the survey v) Types of Questions (1) Close-ended Questions (2) Open-ended Questions (3) Demographic Questions 2) Sampling Methods a) Reasons to Sample:
i) Less time consuming than a census ii) Less costly than a census iii) High precision
iv) Sometimes, it’s impossible to identify the whole population b) Methods of Sampling i) Simple Random
(1) Everyone has equal chances of being selected (2) Selection can be replaced
(3) Samples can be obtained randomly ii) Stratified Random
(1) Population divided into subgroups (or strata) according to some common features
(2) Then select random sample from each subgroup, and combine them into one iii) Systematic (1) Decide on sample size: n
(2) Divide frame of N individuals into groups of k individuals: k = N/n
(3) Randomly select 1 individual from the first group, and every kth member of other groups iv) Cluster
(1) Populations is divided into several “clusters”, each representative of the population
(2) A simple random sample of clusters is selected
(a) All items in the selected clusters can be used, or items can be chosen from
a cluster using another probability sampling technique v) Convenient sampling
(1) Use easily available group to form a sample
(2) Voluntary response sampling, self-selected sampling
3) Sampling and Non-sampling Error a) Sampling error
i) Occur when making statement about the population that is based on the
observations contained in the sample
ii) May be large due to unrepresentative sample being selected
iii) The only way to solve this is to take larger sample size b) Non-sampling Errors: i) Selection bias
(1) Occur when the sample selected systematically excludes some part of the population of interest 23:40, 10/01/2026
CHƯƠNG 3 & 4 - TÀI LIỆU THỐNG KÊ MÔ TẢ: PHƯƠNG PHÁP SỐ LIỆU - Studocu
(2) Also occurs when only volunteers or self-selected individuals are used in a study
ii) Measurement or Response Bias
(1) Occur when the method of Observation tends to produce some values that
systematically differ from the true value in some ways (2) Happen due to
(a) An improperly calibrated scale is used to weigh items
(b) Questions influencing the response
(c) Appearance or behavior of the Interviewer, Dishonesty of interviewees iii) Nonresponse Bias
(1) Occur when responses are not obtained from some individuals of the sample
(2) This bias can distort reseults of the study like Selection Bias (3) Happen due to:
(a) Interviewer unable to contact the person listed in the sample
(b) Sampled person refuses to respond for some reasons 23:40, 10/01/2026
CHƯƠNG 3 & 4 - TÀI LIỆU THỐNG KÊ MÔ TẢ: PHƯƠNG PHÁP SỐ LIỆU - Studocu
Tài liệu liên quan:
-

Bài giảng Chương 6: Kiểm định giả thuyết thống kê môn Xác suất thống kê | Đại học Duy Tân
27 14 -

Bài giảng Chương 5. Ước lượng tham số môn Xác suất thống kê | Đại học Duy Tân
28 14 -

Bài giảng Chương 4: Thống kê mô tả môn Xác suất thống kê | Đại học Duy Tân
25 13 -

Bài giảng Chương 3. Vectơ ngẫu nhiên môn Xác suất thống kê | Đại học Duy Tân
25 13 -

Bài giảng Chương 1: Xác suất môn Xác suất thống kê | Đại học Duy Tân
26 13