Cost chap 4, 5, 6Questions - Tài liệu tham khảo | Đại học Hoa Sen

Cost chap 4, 5, 6Questions - Tài liệu tham khảo | Đại học Hoa Sen và thông tin bổ ích giúp sinh viên tham khảo, ôn luyện và phục vụ nhu cầu học tập của mình cụ thể là có định hướng, ôn tập, nắm vững kiến thức môn học và làm bài tốt trong những bài kiểm tra, bài tiểu luận, bài tập kết thúc học phần, từ đó học tập tốt và có kết quả cao cũng như có thể vận dụng tốt những kiến thức mình đã học.

Môn:
Trường:

Đại học Hoa Sen 4.8 K tài liệu

Thông tin:
33 trang 2 tháng trước

Bình luận

Vui lòng đăng nhập hoặc đăng ký để gửi bình luận.

Cost chap 4, 5, 6Questions - Tài liệu tham khảo | Đại học Hoa Sen

Cost chap 4, 5, 6Questions - Tài liệu tham khảo | Đại học Hoa Sen và thông tin bổ ích giúp sinh viên tham khảo, ôn luyện và phục vụ nhu cầu học tập của mình cụ thể là có định hướng, ôn tập, nắm vững kiến thức môn học và làm bài tốt trong những bài kiểm tra, bài tiểu luận, bài tập kết thúc học phần, từ đó học tập tốt và có kết quả cao cũng như có thể vận dụng tốt những kiến thức mình đã học.

38 19 lượt tải Tải xuống
Trương Nhật Uyên – 2194810
Phù Hiếu Xuân – 2199448
Problem
CHAPTER 5
5 – 29/
1. Pricing decisions at Wigan Associates are heavily influenced by reported cost
numbers. Suppose Wigan is bidding against another firm for a client with a job similar
to that of Widmes Coal. If the costing system overstates the costs of these jobs, Wigan
may bid too high and fail to land the client. If the costing system understates the costs
of these jobs, Wigan may bid low, land the client, and then lose money in handling the
case.
2.
Widnes Coal St. Helen’s Glass Total
Direct professional
labor
($70 x 104 hours =
$7,280; $70 x 96 hours
= $6,720)
$7,280 $6,720 $14,000
Indirect costs allocated
($105 x 104 hours =
$10,920; $105 x 96
hours = $10,080)
$10,920 $10,080 $21,000
Total $18,200 $16,800 $35,000
5 – 30/
1.
Total professional labor–hours = 104 hours Widnes Coal + 96 hours St. Helen’s
Glass = 200 hours
Indirect cost allocated per professional labor–hour (revised) = Indirect costs /
Total professional labor–hours = $7,000 / 200 hours = $35 per hour
2.
Widnes Coal St. Helen’s Glass Total
Direct costs:
Direct professional
labor
$7,280 $6,720 $14,000
Research support labor $1,600 $3,400 $5,000
Computer time $500 $1,300 $1,800
Travel and allowances $600 $4,400 $5,000
Telephones/faxes $200 $1,000 $1,200
Photocopying $250 $750 $1,000
Total direct costs $10,430 $17,570 $28,000
Indirect costs allocated
($35 x 104 hours =
$3,640; $35 x 96 hours
$3,640 $3,360 $7,000
= $3,360)
Total costs $14,070 $20,930 $35,000
3.
Widnes Coal St. Helen’s Glass Total
Problem 5 – 29 $18,200 $16,800 $35,000
Problem 5 – 30 $14,070 $20,930 $35,000
The Problem 5 30 approach directly traces $14,000 of general support costs
to the individual jobs. In Problem 5 29, these costs are allocated on the basis of
direct professional labor-hours. The averaging assumption implicit in the Problem 5
29 approach appears incorrect – for example, the St. Helen’s Glass job has travel costs
six times higher than the Widnes Coal case despite having lower direct professional
labor-hours.
5 – 33/
1.
Overhead costs = $19,000 +$260,000 + $267,900 + $121,200 = $668,100
Budgeted overhead rate = $668,100 / $393,000 = $1.7 per direct labor dollar
X-rays ($) Ultrasoun
d ($)
CT scan
($)
MRI ($) Total ($)
Technician labor 64,000 104,000 119,000 106,000 393,000
Depreciation 136,800 231,000 400,200 792,000 1,560,000
Materials 22,400 16,500 23,900 30,800 93,600
Allocated overhead
(W1)
108,800 176,800 202,300 180,200 668,100
Total budgeted costs 332,000 528,300 745,400 1,109,00
0
2,714,700
Budgeted number of
procedures (/)
2,555 4,760 3,290 2,695
Budgeted cost per
service
129.94 110.99 226.57 411,50
Working:
(W1) Allocated overhead = Budgeted overhead rate x Technician labor costs = $1.7 x
Technician labor costs
Allocated overhead (X-rays) = $1.7 x $64,000 = $108,800
Allocated overhead (Ultrasound) = $1.7 x $104,000 = $176,800
Allocated overhead (CT scan) = $1.7 x $119,000 = $202,300
Allocated overhead (MRI) = $1.7 x $106,000 = $180,200
2.
Budgeted Information
X-rays ($) Ultrasoun
d ($)
CT scan
($)
MRI ($) Total ($)
Number of
procedures
2,555 4,760 3,290 2,695 13,300
Cleaning minutes
per procedure (x)
10 10 20 40
Total cleaning
minutes
15,550 47,600 65,800 107,800 236,750
Number of
procedures
2,555 4,760 3,290 2,695 13,300
Minutes for each
procedure (x)
5 20 15 40
Total procedure
minutes
12,775 95,200 49,350 107,800 265,125
Activity Budgeted
Cost (1) ($)
Cost Driver
(2) ($)
Units of Cost
Driver (3) ($)
Activity Rate
(4) = (1)/(3) ($)
Administration 19,000 Total number
of procedures
13,300 1.42857 per
proceduce
Maintenance 260,000 Total cost of
Depreciation
1,560,000 0.16667 per
cost of
depreciation
Sanitation 267,900 Total cleaning
minutes
236,750 1.13157 per
cleaning minute
Utilities 121,200 Total
procedure
minutes
265,125 0.457 per
procedure
minute
X-rays ($) Ultrasoun
d ($)
CT scan
($)
MRI ($) Total ($)
Technician labor 64,000 104,000 119,000 106,000 393,000
Depreciation 136,800 231,000 400,200 792,000 1,560,000
Materials 22,400 16,500 23,900 30,800 93,600
Allocated activity
costs:
Administration
(1.42857 x 2,555;
1.42857 x 4,760;
1.42857 x 3,290;
1.42857 x 2,695)
3,650 6,800 4,700 3,850 19,000
Maintenance
(0.16667 x 136,800;
0.1667 x 231,000;
0.1667 x 400,200;
0.1667 x 792,000)
22,800 38,501 66,701 132,003 260,005
Sanitation
(1.13157 x 15,550;
1.13157 x 47,600;
1.13157 x 65,800;
17,596 53,863 74,457 121,983 267,899
1.13157 x 107,800)
Utilities
(0.457 x 12,775;
0.457 x 95,200;
0.457 x 49,350;
0.457 x 107,800)
5,838 43,506 22,553 49,265 121,162
Total budgeted cost 273,084 494,170 711,511 1,235,90
1
2,714,666
Budgeted number of
procedures (/)
2,555 4,760 3,290 2,695
Budgeted cost per
service
106.88 103.82 216.26 458.59
3.
Using the disaggregated activity-based costing data, managers can see that the
MRI actually costs substantially more and x-rays, ultrasounds, and CT scans
substantially less than the traditional system indicated. In particular, the MRI activity
generates a lot of maintenance activity and sanitation activity. Managers should
examine the use of these two activities to search for ways to reduce the activity
consumption and ultimately its cost.
5 – 35/
1.
Gross margin % = $438,000 / $8,838,000 = 4.96%
Operating income margin = $136,920 / $8,838,000 = 1.55%
2.
The per-unit cost driver rates are:
Customer purchase order processing = $80,000 / (140 + 360 + 1,500) orders =
$40 per order
Line item ordering = $63,840 / (1,960 + 4,320 + 15,000) line items = $3 per
line item
Store delivery = $71,000 / (120 +360 +1,000) deliveries = $47,973 per delivery
Cartons shipped = $76,000 / (36,000 + 24,000 + 16,000) cartons = $1 per
carton
Shelf-stocking = $10,240 / (360 + 180 + 100) hours = $16 per hour
3.
The activity-based costing of each distribution market for 2011 is:
General
Supermarket
Chains ($)
Drugstore
Chains ($)
Mom-and-
Pop Single
Stores ($)
Total ($)
Customer purchase
order processing
($40 x 140; $40 x
360; $40 x 1,500)
5,600 14,400 60,000 80,000
Line item ordering 5,880 12,960 45,000 63,840
($3 x 1,960; $3 x
4,320; $3 x 15,000)
Store delivery
($47,973 x 120;
$47,973 x 360;
$47,973 x 1,000)
5,757 17,270 47,973 71,000
Cartons shipped
($1 x 36,000; $1 x
24,000; $1 x 16,000)
36,000 24,000 16,000 76,000
Shelf-stocking
($16 x 360; $16 x
180; $16 x 100)
5,760 2,880 1,600 10,240
Total 58,997 71,510 170,573 301,080
The revised operating income statement is:
General
Supermarket
Chains ($)
Drugstore
Chains ($)
Mom-and-
Pop Single
Stores ($)
Total ($)
Revenues 3,708,000 3,150,000 1,980,000 8,838,000
COGS 3,600,000 3,000,000 1,800,000 8,400,000
Gross margin 108,000 150,000 180,000 438,000
Operating costs 58,997 71,510 170,573 301,080
Operating income 49,003 78,490 9,427 136,920
Operating income
margin
1.32% 2.49% 0,48% 1.55%
4.
5 – 36/
1.
Direct materials – purses Output unit-level costs
Direct materials – backpacks Output unit-level costs
Direct manufacturing labor – purses Output unit-level costs
Direct manufacturing labor – backpacks Output unit-level costs
Setup Batch-level costs
Shipping Batch-level costs
Design Product-sustaining costs
Plant utilities and administration Facility-sustaining costs
2.
Direct materials – purses Number of purses
Direct materials – backpacks Number of backpacks
Direct manufacturing labor – purses Number of purses
Direct manufacturing labor – backpacks Number of backpacks
Setup Number of batches
Shipping Number of batches
Design Number of designs
Plant utilities and administration Hours of production
3.
Direct materials – purses ($379,290 / 3,350) $113.22 per purse
Direct materials – backpacks ($412,920 / 6,050) $68.25 per backpack
Direct manufacturing labor – purses ($98,000 / 3,350) $29.25 per purse
Direct manufacturing labor – backpacks ($120,000 / 6,050) $19.84 per backpack
Setup ($65,930 / 190) $347 per batch
Shipping ($73,910 / 190) $389 per batch
Design ($166,000 / 4) $41,500 per design
Plant utilities and administration ($243,000 / 4,050) $60 per hour
4.
Backpacks ($) Purses ($) Total ($)
Direct materials 412,920 379,290 792,210
Direct manufacturing labor 120,000 98,000 218,000
Setup ($347 x 130; $347 x
60)
45,110 20,820 65,930
Shipping ($389 x 130; $389
x 60)
50,570 23,340 73,910
Design ($41,500 x 2;
$41,500 x 2)
83,000 83,000 166,000
Plant utilities and
administration ($60 x 1,450;
$60 x 2,600)
87,000 156,000 243,000
Budgeted total costs 798,600 760,450 1,559,050
Number of bags to
backpacks/ purses (Divided)
6,050 3,350
Budgeted cost per
backpacks/ purses
132 227
5.
Based on this analysis, more than 50% of product cost relates to direct material.
Managers should determine whether the material costs can be reduced. Producing in
small lots increases the setup and shipping costs. While both are relatively small
components of product cost, management may want to evaluate ways to reduce the
number of setups and the cost per setup. Of the indirect costs, the product- and
facility-sustaining costs are the highest. Management should review the design
process for cost savings and examine why it takes so long to produce Purses relative
to Backpacks.
5 – 37/
1. a/
Medical supplies rate = Medical supplies costs / Total number of patient-years
= $220,000 / 110 = $2,000 per patient-year
Rent and clinic maintenance rate = Rent and clinic maintenance costs / Total
amount of square feet of space = $126,000 / 21,000 = $6 per square feet
Administrative costs for patient-charts, food, and laundry rate = Administrative
costs for patient-charts, food, and laundry costs / Total number of patient-years =
$440,000 / 110 = $4,000 per patient-year
Laboratory services rate = Laboratory services costs / Total number of
laboratory tests = $84,000 / 2,100 = $40 per test
b/
Drug ($) Aftercare ($) Total ($)
Direct labor
Physicians ($150,000 x 4;
$150,000 x 0)
600,000 - 600,000
Psychologists ($75,000 x 4;
$75,000 x 8)
300,000 600,000 900,000
Nurses ($30,000 x 6; $30,000
x 10)
180,000 300,000 480,000
Direct labor costs 1,080,000 900,000 1,980,000
Medical supplies ($2,000 x
50; $2,000 x 60)
100,000 120,000 220,000
Rent and clinic maintenance
($6 x 9,000; $6 x 12,000)
54,000 72,000 126,000
Administrative costs for
patient-charts, food, and
laundry ($4,000 x 50; $4,000
x 60)
200,000 240,000 440,000
Laboratory services ($40 x
1,400; $40 x 700)
56,000 28,000 84,000
Total costs 1,490,000 1,360,000 2,850,000
Budgeted cost per patient-year of the Drug = 1,490,000 / 50 = $29,800
c/
The ABC system more accurately allocates costs because it identifies better
cost drivers. The ABC system chooses cost drivers for overhead costs that have a
cause-and-effect relationship between the cost drivers and the costs. Of course,
Clayton should continue to evaluate if better cost drivers can be found than the ones
they have identified so far.
In addition, the ABC system will help Clayton determine which programs are
the most costly to operate. This will be useful in making long-run decisions as to
which programs to offer or emphasize. The ABC system will also assist Clayton in
setting prices for the programs that more accurately reflect the costs of each program.
2.
The concern with using costs per patient-year as the rule to allocate resources
among its programs is that it emphasizes “input” to the exclusion of “outputs” or
effectiveness of the programs. After-all, Clayton’s goal is to cure patients while
controlling costs, not minimize costs per-patient year. The problem, of course, is
measuring outputs.
Unlike many manufacturing companies, where the outputs are obvious because
they are tangible and measurable, the outputs of service organizations are more
difficult to measure. Examples are “cured” patients as distinguished from “processed”
or “discharged patients, “educated” as distinguished from “partially educated”
students, and so on.
5 – 38/
1.
Basketballs Volleyballs Total
Number of batches 300 400 700
Machine – hours 11,000 12,500 23,500
Setup cost per batch = $143,500 / 700 batches = $205 per batch
Equipment and maintenance = $109,900 / 23,500 machine-hours = $4.68 per
machine-hour
Lease rent = $216,000 / 12,000 square foot of capacity = $18 per square foot
2.
Unused capacity = Total capacity Capacity used for basketball production
Capacity used for volleyball production = 12,000 – 3,360 – 5,040 = 3,600 square foot
Cost of unused capacity = $18 per square foot x 3,600 square foot = $64,800
3.
Basketballs ($) Volleyballs ($) Total ($)
Direct materials 209,750 358,290 568,040
Direct manufacturing labor 107,333 102,969 210,302
Setup ($205 x 300; $205 x
400)
61,500 82,000 143,500
Equipment and maintenance
($4.68 x 11,000; $4.68 x
12,500)
51,480 58,500 109,980
Lease rent ($18 x 3,360; $18
x 5,040)
60,480 90,720 151,200
Budgeted total costs 490,543 692,479 1,183,022
Number of units (Divided) 66,000 100,000
Budgeted cost per unit 7.43 6.93
4.
Currently, Nivag’s only utilizes 70% of its available capacity. The excess
capacity is currently costing Nivag’s $64,800 annually, so Nivag’s would need to
consider using the excess capacity to expand production of either of the existing
models, or add a new product line in the future. Nivag’s should only do so if there is
available skilled labor and machine capacity, as well as demand for the product to
justify higher costs and the capital investment needed. Nivag’s may also consider
renting out the available space to a compatible outside user, with the option to take the
space back if needed.
On the other hand having excess capacity might also be beneficial to Nivag’s. It
allows the company to accept special orders if they are received and to reduce the
confusion and complexity that occurs when a plant is operating at full capacity.
CHAPTER 9
9 – 28/
1. Absorption Costing
Mavis Company Income Statement
For the Year Ended December 31, 2012 ($)
Revenues (540,000 x $5) 2,700,000
COGS:
BB [30,000 x $3.7 (W1)] 111,000
Variable manufacturing costs [550,000
(W2) x $3]
1,650,000
Allocated fixed MOH costs (550,000 x
$0.7)
385,000
Deduct EB (40,000 x $3.7) (148,000)
Add adjusment for production-volume
variance [50,000 (W3) x $0,7)
35,000 (U)
COGS 2,033,000
Gross margin 667,000
Operating costs:
Variable operating costs (540,000 x $1) 540,000
Fixed operating costs 120,000
Total operating costs 660,000
Operating income 7,000
Working:
(W1) $3 + ($7 / 10) = $3.7
(W2) 2012 Production = Sales + EB – BB = 540,000 + 40,000 – 30,000 = 550,000
(W3) [(10 units per machine hour x 60,000 machine hours) – 550,000 units] = 50,000
units unfavorable
2. Variable Costing
Mavis Company Income Statement
For the Year Ended December 31, 2012 ($)
Revenues 2,700,000
Variable COGS:
BB (30,000 x $3) 90,000
Variable manufacturing costs [550,000
(W2) x $3]
1,650,000
Deduct EB (40,000 x $3) (12,000)
Variable COGS 1,620,000
Contribution margin 540,000
Fixed costs:
Fixed MOH costs 420,000
Fixed operating costs 120,000
Total fixed costs 540,000
Operating income 0
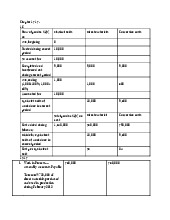
3. The difference in operating income between the two costing methods is:
| 1/33

Preview text:

Trương Nhật Uyên – 2194810 Phù Hiếu Xuân – 2199448 Problem CHAPTER 5 5 – 29/
1. Pricing decisions at Wigan Associates are heavily influenced by reported cost
numbers. Suppose Wigan is bidding against another firm for a client with a job similar
to that of Widmes Coal. If the costing system overstates the costs of these jobs, Wigan
may bid too high and fail to land the client. If the costing system understates the costs
of these jobs, Wigan may bid low, land the client, and then lose money in handling the case. 2. Widnes Coal St. Helen’s Glass Total Direct professional $7,280 $6,720 $14,000 labor ($70 x 104 hours = $7,280; $70 x 96 hours = $6,720) Indirect costs allocated $10,920 $10,080 $21,000 ($105 x 104 hours = $10,920; $105 x 96 hours = $10,080) Total $18,200 $16,800 $35,000 5 – 30/ 1.
Total professional labor–hours = 104 hours Widnes Coal + 96 hours St. Helen’s Glass = 200 hours
Indirect cost allocated per professional labor–hour (revised) = Indirect costs /
Total professional labor–hours = $7,000 / 200 hours = $35 per hour 2. Widnes Coal St. Helen’s Glass Total Direct costs: Direct professional $7,280 $6,720 $14,000 labor Research support labor $1,600 $3,400 $5,000 Computer time $500 $1,300 $1,800 Travel and allowances $600 $4,400 $5,000 Telephones/faxes $200 $1,000 $1,200 Photocopying $250 $750 $1,000 Total direct costs $10,430 $17,570 $28,000 Indirect costs allocated $3,640 $3,360 $7,000 ($35 x 104 hours = $3,640; $35 x 96 hours = $3,360) Total costs $14,070 $20,930 $35,000 3. Widnes Coal St. Helen’s Glass Total Problem 5 – 29 $18,200 $16,800 $35,000 Problem 5 – 30 $14,070 $20,930 $35,000
The Problem 5 – 30 approach directly traces $14,000 of general support costs
to the individual jobs. In Problem 5 – 29, these costs are allocated on the basis of
direct professional labor-hours. The averaging assumption implicit in the Problem 5 –
29 approach appears incorrect – for example, the St. Helen’s Glass job has travel costs
six times higher than the Widnes Coal case despite having lower direct professional labor-hours. 5 – 33/ 1.
Overhead costs = $19,000 +$260,000 + $267,900 + $121,200 = $668,100
Budgeted overhead rate = $668,100 / $393,000 = $1.7 per direct labor dollar X-rays ($) Ultrasoun CT scan MRI ($) Total ($) d ($) ($) Technician labor 64,000 104,000 119,000 106,000 393,000 Depreciation 136,800 231,000 400,200 792,000 1,560,000 Materials 22,400 16,500 23,900 30,800 93,600 Allocated overhead 108,800 176,800 202,300 180,200 668,100 (W1) Total budgeted costs 332,000 528,300 745,400 1,109,00 2,714,700 0 Budgeted number of 2,555 4,760 3,290 2,695 procedures (/) Budgeted cost per 129.94 110.99 226.57 411,50 service Working:
(W1) Allocated overhead = Budgeted overhead rate x Technician labor costs = $1.7 x Technician labor costs 
Allocated overhead (X-rays) = $1.7 x $64,000 = $108,800 
Allocated overhead (Ultrasound) = $1.7 x $104,000 = $176,800 
Allocated overhead (CT scan) = $1.7 x $119,000 = $202,300 
Allocated overhead (MRI) = $1.7 x $106,000 = $180,200 2. Budgeted Information X-rays ($) Ultrasoun CT scan MRI ($) Total ($) d ($) ($) Number of 2,555 4,760 3,290 2,695 13,300 procedures Cleaning minutes 10 10 20 40 per procedure (x) Total cleaning 15,550 47,600 65,800 107,800 236,750 minutes Number of 2,555 4,760 3,290 2,695 13,300 procedures Minutes for each 5 20 15 40 procedure (x) Total procedure 12,775 95,200 49,350 107,800 265,125 minutes Activity Budgeted Cost Driver Units of Cost Activity Rate Cost (1) ($) (2) ($) Driver (3) ($) (4) = (1)/(3) ($) Administration 19,000 Total number 13,300 1.42857 per of procedures proceduce Maintenance 260,000 Total cost of 1,560,000 0.16667 per Depreciation cost of depreciation Sanitation 267,900 Total cleaning 236,750 1.13157 per minutes cleaning minute Utilities 121,200 Total 265,125 0.457 per procedure procedure minutes minute X-rays ($) Ultrasoun CT scan MRI ($) Total ($) d ($) ($) Technician labor 64,000 104,000 119,000 106,000 393,000 Depreciation 136,800 231,000 400,200 792,000 1,560,000 Materials 22,400 16,500 23,900 30,800 93,600 Allocated activity costs: Administration 3,650 6,800 4,700 3,850 19,000 (1.42857 x 2,555; 1.42857 x 4,760; 1.42857 x 3,290; 1.42857 x 2,695) Maintenance 22,800 38,501 66,701 132,003 260,005 (0.16667 x 136,800; 0.1667 x 231,000; 0.1667 x 400,200; 0.1667 x 792,000) Sanitation 17,596 53,863 74,457 121,983 267,899 (1.13157 x 15,550; 1.13157 x 47,600; 1.13157 x 65,800; 1.13157 x 107,800) Utilities 5,838 43,506 22,553 49,265 121,162 (0.457 x 12,775; 0.457 x 95,200; 0.457 x 49,350; 0.457 x 107,800) Total budgeted cost 273,084 494,170 711,511 1,235,90 2,714,666 1 Budgeted number of 2,555 4,760 3,290 2,695 procedures (/) Budgeted cost per 106.88 103.82 216.26 458.59 service 3.
Using the disaggregated activity-based costing data, managers can see that the
MRI actually costs substantially more and x-rays, ultrasounds, and CT scans
substantially less than the traditional system indicated. In particular, the MRI activity
generates a lot of maintenance activity and sanitation activity. Managers should
examine the use of these two activities to search for ways to reduce the activity
consumption and ultimately its cost. 5 – 35/ 1.
Gross margin % = $438,000 / $8,838,000 = 4.96%
Operating income margin = $136,920 / $8,838,000 = 1.55% 2.
The per-unit cost driver rates are: 
Customer purchase order processing = $80,000 / (140 + 360 + 1,500) orders = $40 per order 
Line item ordering = $63,840 / (1,960 + 4,320 + 15,000) line items = $3 per line item 
Store delivery = $71,000 / (120 +360 +1,000) deliveries = $47,973 per delivery 
Cartons shipped = $76,000 / (36,000 + 24,000 + 16,000) cartons = $1 per carton 
Shelf-stocking = $10,240 / (360 + 180 + 100) hours = $16 per hour 3.
The activity-based costing of each distribution market for 2011 is: General Drugstore Mom-and- Total ($) Supermarket Chains ($) Pop Single Chains ($) Stores ($) Customer purchase 5,600 14,400 60,000 80,000 order processing ($40 x 140; $40 x 360; $40 x 1,500) Line item ordering 5,880 12,960 45,000 63,840 ($3 x 1,960; $3 x 4,320; $3 x 15,000) Store delivery 5,757 17,270 47,973 71,000 ($47,973 x 120; $47,973 x 360; $47,973 x 1,000) Cartons shipped 36,000 24,000 16,000 76,000 ($1 x 36,000; $1 x 24,000; $1 x 16,000) Shelf-stocking 5,760 2,880 1,600 10,240 ($16 x 360; $16 x 180; $16 x 100) Total 58,997 71,510 170,573 301,080
The revised operating income statement is: General Drugstore Mom-and- Total ($) Supermarket Chains ($) Pop Single Chains ($) Stores ($) Revenues 3,708,000 3,150,000 1,980,000 8,838,000 COGS 3,600,000 3,000,000 1,800,000 8,400,000 Gross margin 108,000 150,000 180,000 438,000 Operating costs 58,997 71,510 170,573 301,080 Operating income 49,003 78,490 9,427 136,920 Operating income 1.32% 2.49% 0,48% 1.55% margin 4. 5 – 36/ 1. Direct materials – purses Output unit-level costs Direct materials – backpacks Output unit-level costs
Direct manufacturing labor – purses Output unit-level costs
Direct manufacturing labor – backpacks Output unit-level costs Setup Batch-level costs Shipping Batch-level costs Design Product-sustaining costs
Plant utilities and administration Facility-sustaining costs 2. Direct materials – purses Number of purses Direct materials – backpacks Number of backpacks
Direct manufacturing labor – purses Number of purses
Direct manufacturing labor – backpacks Number of backpacks Setup Number of batches Shipping Number of batches Design Number of designs
Plant utilities and administration Hours of production 3.
Direct materials – purses ($379,290 / 3,350) $113.22 per purse
Direct materials – backpacks ($412,920 / 6,050) $68.25 per backpack
Direct manufacturing labor – purses ($98,000 / 3,350) $29.25 per purse
Direct manufacturing labor – backpacks ($120,000 / 6,050) $19.84 per backpack Setup ($65,930 / 190) $347 per batch Shipping ($73,910 / 190) $389 per batch Design ($166,000 / 4) $41,500 per design
Plant utilities and administration ($243,000 / 4,050) $60 per hour 4. Backpacks ($) Purses ($) Total ($) Direct materials 412,920 379,290 792,210 Direct manufacturing labor 120,000 98,000 218,000 Setup ($347 x 130; $347 x 45,110 20,820 65,930 60) Shipping ($389 x 130; $389 50,570 23,340 73,910 x 60) Design ($41,500 x 2; 83,000 83,000 166,000 $41,500 x 2) Plant utilities and 87,000 156,000 243,000 administration ($60 x 1,450; $60 x 2,600) Budgeted total costs 798,600 760,450 1,559,050 Number of bags to 6,050 3,350 backpacks/ purses (Divided) Budgeted cost per 132 227 backpacks/ purses 5.
Based on this analysis, more than 50% of product cost relates to direct material.
Managers should determine whether the material costs can be reduced. Producing in
small lots increases the setup and shipping costs. While both are relatively small
components of product cost, management may want to evaluate ways to reduce the
number of setups and the cost per setup. Of the indirect costs, the product- and
facility-sustaining costs are the highest. Management should review the design
process for cost savings and examine why it takes so long to produce Purses relative to Backpacks. 5 – 37/ 1. a/
Medical supplies rate = Medical supplies costs / Total number of patient-years
= $220,000 / 110 = $2,000 per patient-year
Rent and clinic maintenance rate = Rent and clinic maintenance costs / Total
amount of square feet of space = $126,000 / 21,000 = $6 per square feet
Administrative costs for patient-charts, food, and laundry rate = Administrative
costs for patient-charts, food, and laundry costs / Total number of patient-years =
$440,000 / 110 = $4,000 per patient-year
Laboratory services rate = Laboratory services costs / Total number of
laboratory tests = $84,000 / 2,100 = $40 per test b/ Drug ($) Aftercare ($) Total ($) Direct labor Physicians ($150,000 x 4; 600,000 - 600,000 $150,000 x 0) Psychologists ($75,000 x 4; 300,000 600,000 900,000 $75,000 x 8) Nurses ($30,000 x 6; $30,000 180,000 300,000 480,000 x 10) Direct labor costs 1,080,000 900,000 1,980,000 Medical supplies ($2,000 x 100,000 120,000 220,000 50; $2,000 x 60) Rent and clinic maintenance 54,000 72,000 126,000 ($6 x 9,000; $6 x 12,000) Administrative costs for 200,000 240,000 440,000 patient-charts, food, and laundry ($4,000 x 50; $4,000 x 60) Laboratory services ($40 x 56,000 28,000 84,000 1,400; $40 x 700) Total costs 1,490,000 1,360,000 2,850,000
Budgeted cost per patient-year of the Drug = 1,490,000 / 50 = $29,800 c/
The ABC system more accurately allocates costs because it identifies better
cost drivers. The ABC system chooses cost drivers for overhead costs that have a
cause-and-effect relationship between the cost drivers and the costs. Of course,
Clayton should continue to evaluate if better cost drivers can be found than the ones they have identified so far.
In addition, the ABC system will help Clayton determine which programs are
the most costly to operate. This will be useful in making long-run decisions as to
which programs to offer or emphasize. The ABC system will also assist Clayton in
setting prices for the programs that more accurately reflect the costs of each program. 2.
The concern with using costs per patient-year as the rule to allocate resources
among its programs is that it emphasizes “input” to the exclusion of “outputs” or
effectiveness of the programs. After-all, Clayton’s goal is to cure patients while
controlling costs, not minimize costs per-patient year. The problem, of course, is measuring outputs.
Unlike many manufacturing companies, where the outputs are obvious because
they are tangible and measurable, the outputs of service organizations are more
difficult to measure. Examples are “cured” patients as distinguished from “processed”
or “discharged” patients, “educated” as distinguished from “partially educated” students, and so on. 5 – 38/ 1. Basketballs Volleyballs Total Number of batches 300 400 700 Machine – hours 11,000 12,500 23,500
Setup cost per batch = $143,500 / 700 batches = $205 per batch
Equipment and maintenance = $109,900 / 23,500 machine-hours = $4.68 per machine-hour
Lease rent = $216,000 / 12,000 square foot of capacity = $18 per square foot 2.
Unused capacity = Total capacity – Capacity used for basketball production –
Capacity used for volleyball production = 12,000 – 3,360 – 5,040 = 3,600 square foot
Cost of unused capacity = $18 per square foot x 3,600 square foot = $64,800 3. Basketballs ($) Volleyballs ($) Total ($) Direct materials 209,750 358,290 568,040 Direct manufacturing labor 107,333 102,969 210,302 Setup ($205 x 300; $205 x 61,500 82,000 143,500 400) Equipment and maintenance 51,480 58,500 109,980 ($4.68 x 11,000; $4.68 x 12,500) Lease rent ($18 x 3,360; $18 60,480 90,720 151,200 x 5,040) Budgeted total costs 490,543 692,479 1,183,022 Number of units (Divided) 66,000 100,000 Budgeted cost per unit 7.43 6.93 4.
Currently, Nivag’s only utilizes 70% of its available capacity. The excess
capacity is currently costing Nivag’s $64,800 annually, so Nivag’s would need to
consider using the excess capacity to expand production of either of the existing
models, or add a new product line in the future. Nivag’s should only do so if there is
available skilled labor and machine capacity, as well as demand for the product to
justify higher costs and the capital investment needed. Nivag’s may also consider
renting out the available space to a compatible outside user, with the option to take the space back if needed.
On the other hand having excess capacity might also be beneficial to Nivag’s. It
allows the company to accept special orders if they are received and to reduce the
confusion and complexity that occurs when a plant is operating at full capacity. CHAPTER 9 9 – 28/ 1. Absorption Costing
Mavis Company Income Statement
For the Year Ended December 31, 2012 ($) Revenues (540,000 x $5) 2,700,000 COGS: BB [30,000 x $3.7 (W1)] 111,000
Variable manufacturing costs [550,000 1,650,000 (W2) x $3]
Allocated fixed MOH costs (550,000 x 385,000 $0.7) Deduct EB (40,000 x $3.7) (148,000)
Add adjusment for production-volume 35,000 (U) variance [50,000 (W3) x $0,7) COGS 2,033,000 Gross margin 667,000 Operating costs:
Variable operating costs (540,000 x $1) 540,000 Fixed operating costs 120,000 Total operating costs 660,000 Operating income 7,000 Working: (W1) $3 + ($7 / 10) = $3.7
(W2) 2012 Production = Sales + EB – BB = 540,000 + 40,000 – 30,000 = 550,000
(W3) [(10 units per machine hour x 60,000 machine hours) – 550,000 units] = 50,000 units unfavorable 2. Variable Costing
Mavis Company Income Statement
For the Year Ended December 31, 2012 ($) Revenues 2,700,000 Variable COGS: BB (30,000 x $3) 90,000
Variable manufacturing costs [550,000 1,650,000 (W2) x $3] Deduct EB (40,000 x $3) (12,000) Variable COGS 1,620,000 Contribution margin 540,000 Fixed costs: Fixed MOH costs 420,000 Fixed operating costs 120,000 Total fixed costs 540,000 Operating income 0
3. The difference in operating income between the two costing methods is: