Đề cương học phần KHÁI PHÁ DỮ LIỆU - Phân tích và Thuật toán. Môn Khai phá dữ liệu (UET) | Trường Đại học Công nghệ, Đại học Quốc gia Hà Nội.
Lý thuyết:
1. What is the main difference between K-Nearest Neighbors and K-Mean Clustering algorithms?
-> K-Nearest Neighbors (KNN) and K-Means Clustering are two distinct algorithms in machine learning:
KNN: A supervised algorithm for classification and regression. It makes predictions based on the nearest K labeled data points. Sensitivity to K value and distance measurement selection.
K-Means: An unsupervised algorithm for clustering. It groups the data into K clusters based on minimizing the distance to the cluster center. No need for labels, requires K to be predefined. Sensitive to the initial position of the cluster center.
Đề cương học phần KHÁI PHÁ DỮ LIỆU - Phân tích và Thuật toán. Môn Khai phá dữ liệu (UET) | Trường Đại học Công nghệ, Đại học Quốc gia Hà Nội.
Tài liệu gồm 14 trang giúp bạn tham khảo, củng cố kiến thức và ôn tập đạt kết quả cao trong kỳ thi sắp tới. Mời bạn đọc đón xem!
Môn: Khai phá dữ liệu (UET) 7 tài liệu
Trường: Trường Đại học Công nghệ, Đại học Quốc gia Hà Nội 824 tài liệu
Tác giả:


Preview text:
lOMoAR cPSD| 59735516 Lý thuyết: 1.
What is the main difference between K-Nearest Neighbors and K-Mean Clustering algorithms?
-> K-Nearest Neighbors (KNN) and K-Means Clustering are two distinct algorithms in
machine learning:
KNN: A supervised algorithm for classification and regression. It makes predictions based on
the nearest K labeled data points. Sensitivity to K value and distance measurement selection.
K-Means: An unsupervised algorithm for clustering. It groups the data into K clusters based
on minimizing the distance to the cluster center. No need for labels, requires K to be
predefined. Sensitive to the initial position of the cluster center. 2.
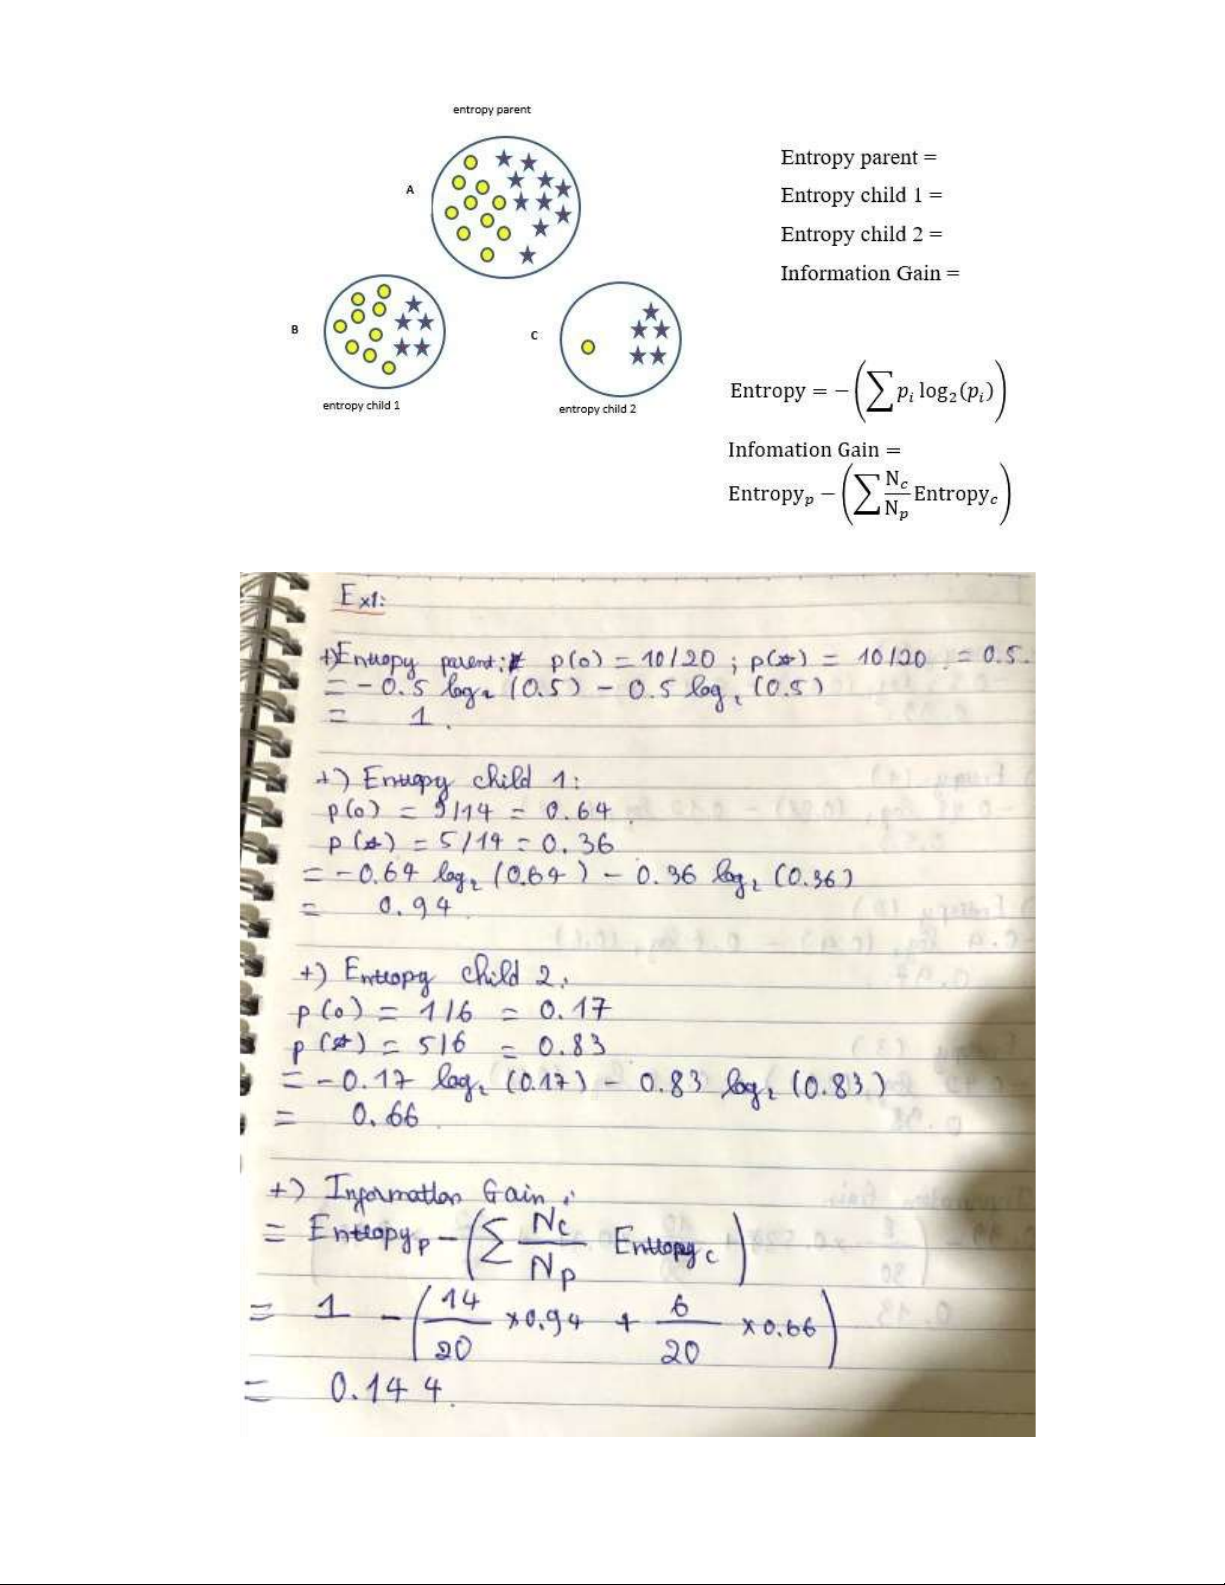
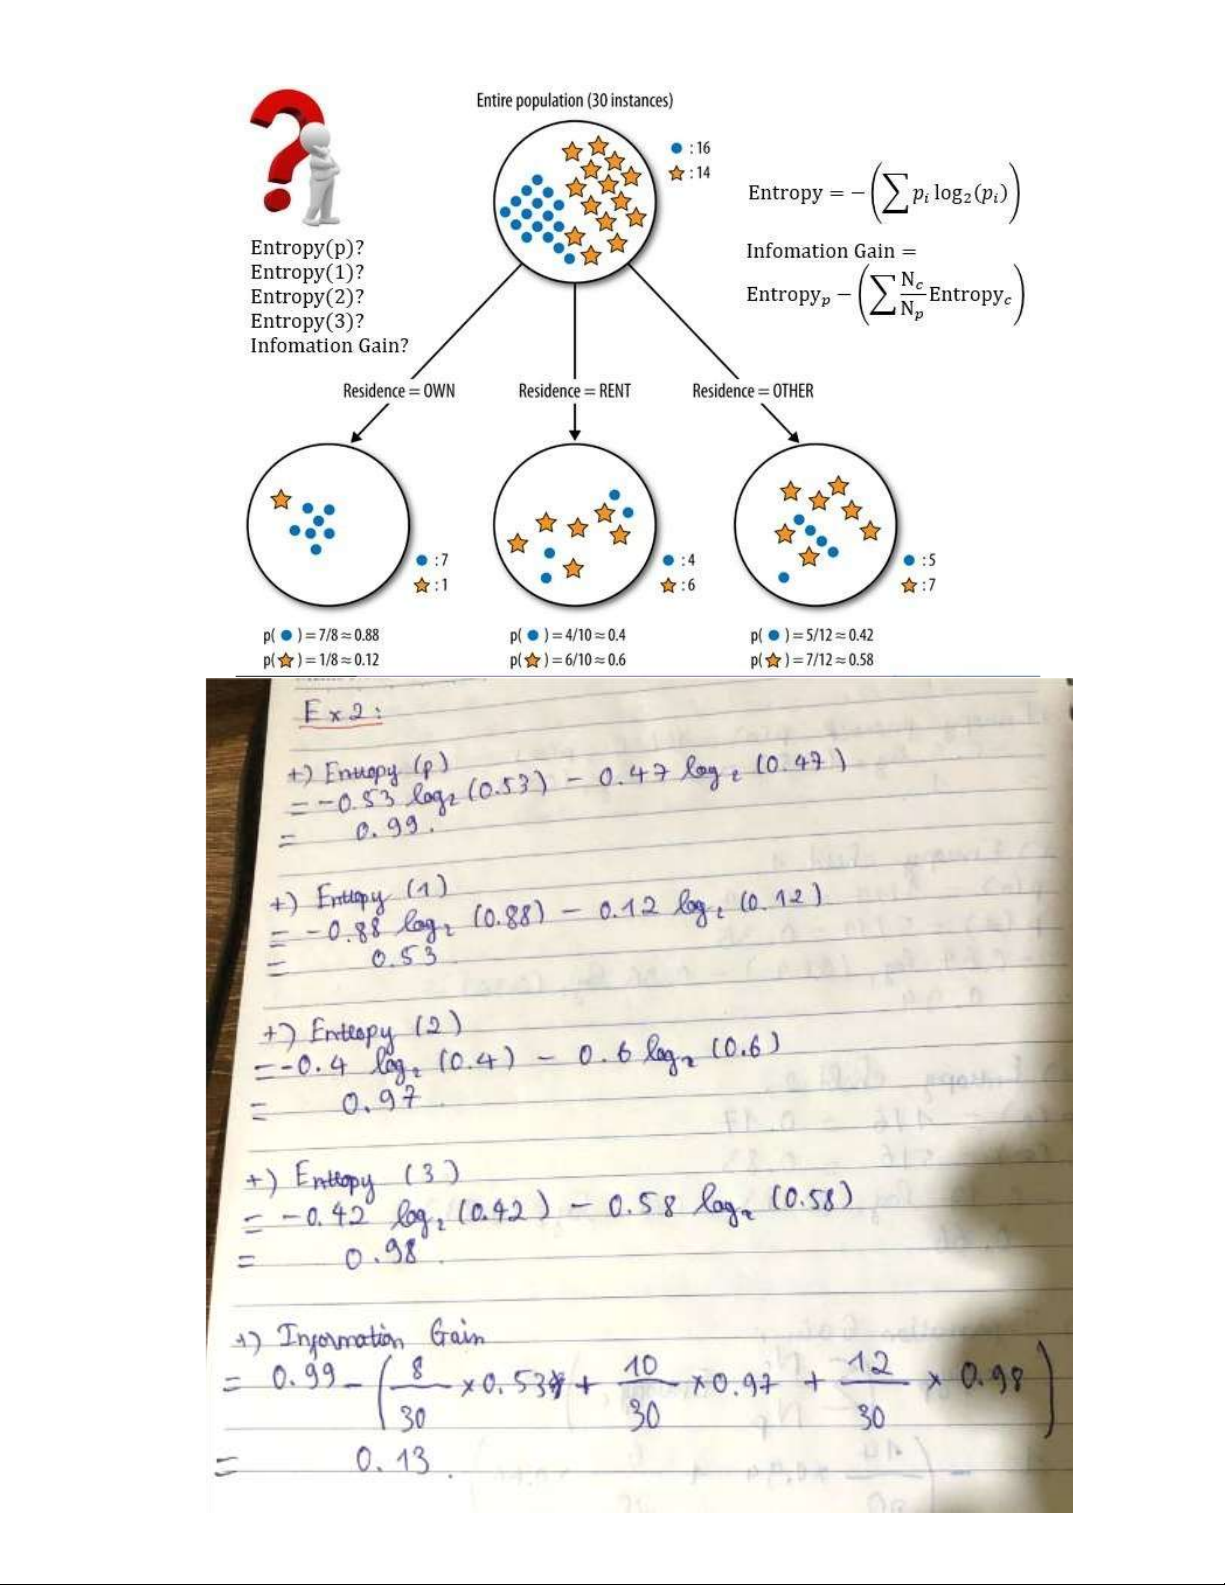
Define Entropy and Information Gain? In a decision tree algorithm, how high or low does
the value of Entropy and Information Gain affect data clustering and attribute selection?
-> Entropy is a measure of the uncertainty or chaos of data.
Information Gain is the information gain, which measures the improvement in entropy
after dividing data based on an attribute.
In the decision tree algorithm, the goal is to find the attribute with the highest Information
Gain to divide the data in such a way as to reduce the chaos and increase the decision tree.
When the Entropy is high and the Information Gain is high after dividing the data, the
decision tree is capable of making better decisions. 3.
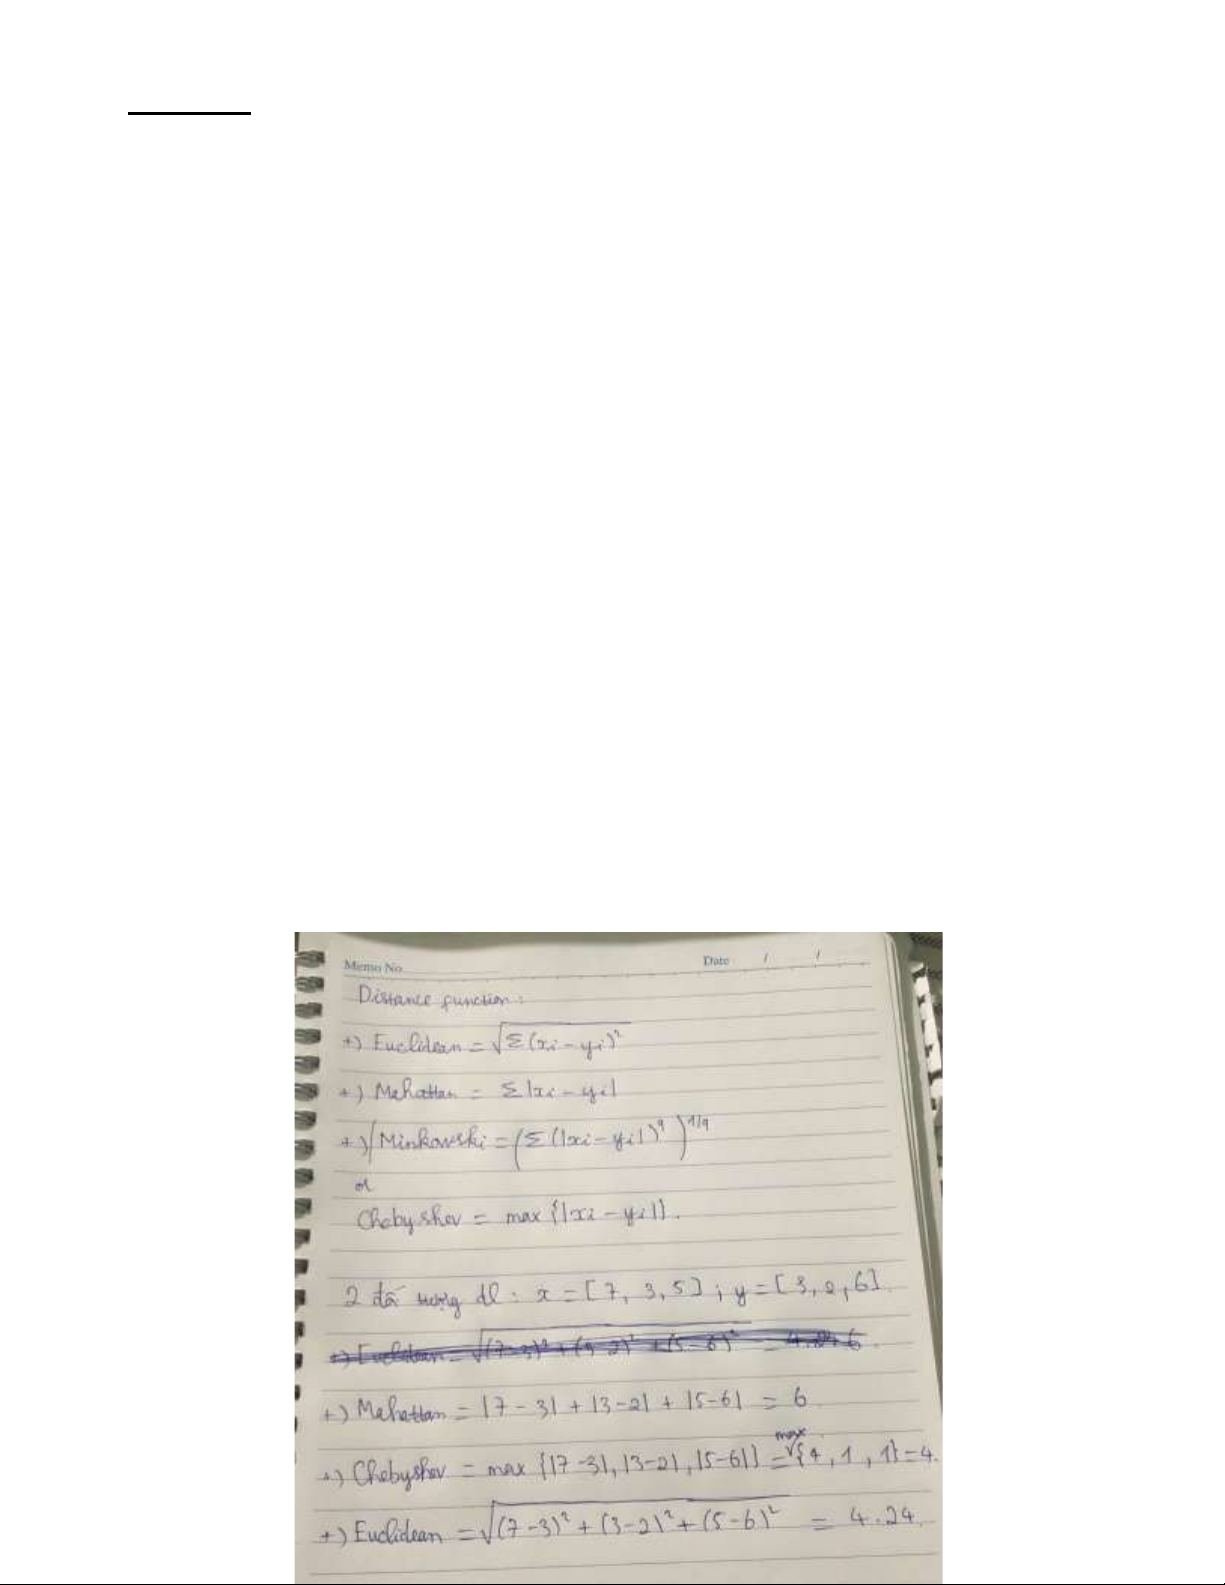
Trình bày 3 cách tính khoảng cách Manhattan, Euclidean, Chebychev cho 2 đối tượng dữ
liệu: x = [7,3,5] và y = [3,2,6]? 3 cách tính khoảng cách đó là biến thể của công thức tổng quát với tên gọi là gì? -> There arethree common ways ofcalculating the lOMoAR cPSD| 59735516
distancebetween two data points:Manhattan, Euclidean,and Chebyshev. All three arevariations of the generalformula known
as "norm"or "norm distance." 4.
Distinguish two types of models (classifcation) and regression (regression)? Give 2 examples of each model type. ->Answer:
Classification model: used to predict a discrete target variable. They classify data points into
different classes or categories based on input features. Example:
- Predict whether an email is spam (1) or not spam (0).
- Categorize images of animals into categories like "dog," "cat," or "bird."
Regression model is used to predict a continuous target variable. They establish the
relationship between input features and continuous results. Example:
-Predict house prices based on characteristics such as area and number of bedrooms.
-Used to predict a person's age based on various biological factors.
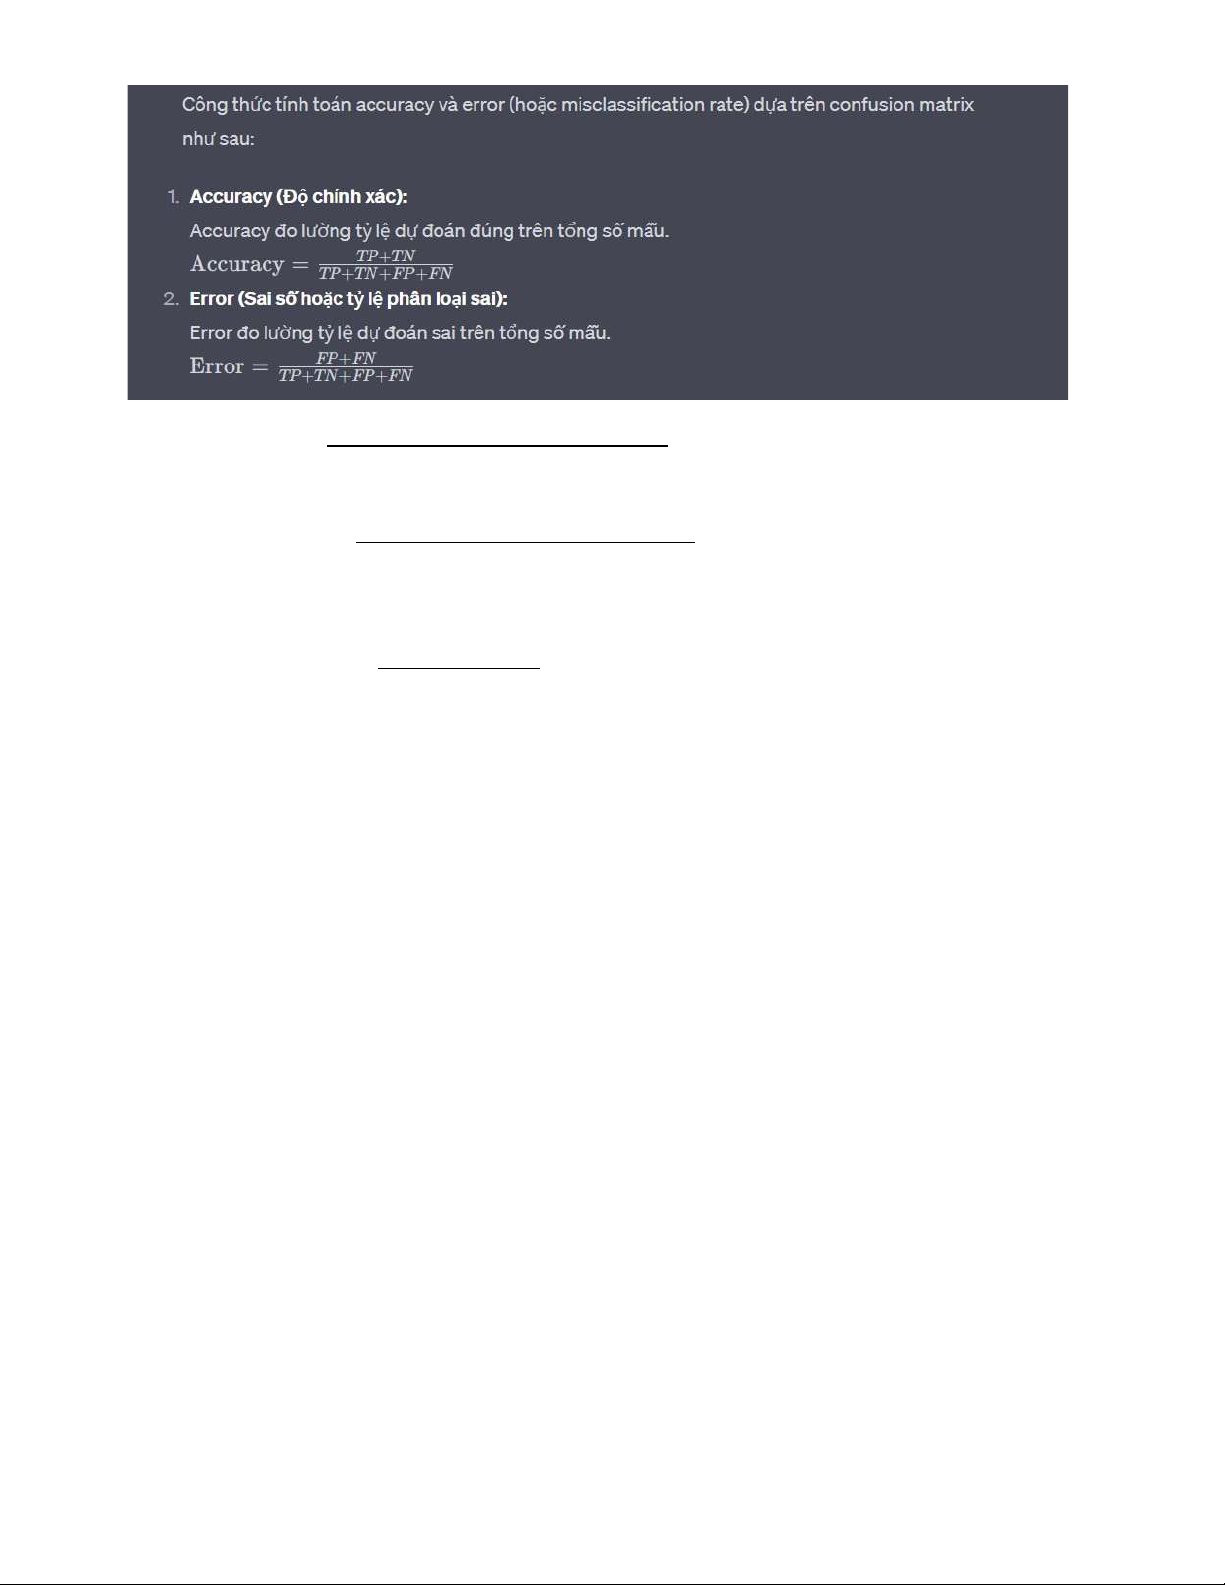
5. In the confusion metrics? What is True Positive, True Negative, False Positive, False Negative?
Present the formulas for calculating accuracy (Accuracy) and error (Error) based on confusion matrix? ->Answer: -
True Positive (TP): The number of correct predictions is positive, i.e. the actual number of
samples is positive and the model predicts them to be positive. -
True Negative (TN): The number of correct predictions is negative, that is, the actual
number of samples is negative and the model predicts them to be negative. -
False Positive (FP): The number of false predictions is positive, that is, the number of
actual samples is negative but the model predicts them to be positive. -
False Negative (FN): The number of false predictions is negative, that is, the actual
number of samples is positive but the model predicts them to be negative. lOMoAR cPSD| 59735516
Correct PositivePredictions TP Recall= = All Positive TP+FN
Correct PositivePredictions TP Precision= =
AllPositive Predictions TP+FP
Precision×Recall F1score=2×
Precision+Recall
6. Thế nào là chưa khớp (under-fitting), quá khớp (over-fitting), và vừa khớp (good-fitting)?
Nguyên nhân xảy ra under-fitting và over-fitting là gì? -> Answer: Under-fitting:
- The predictive model is not good for the training data set as well as the new data set.
- The reason may be because the model is too simple.
- Underfitting rarely happens. Over-fitting:
- The prediction model is too good for the training data set, but the prediction is not good for the new data set.
- The cause may be because the model is too complicated
- Overfitting is more common, especially for non-parametric or non-linear modelsGood- fitting:
- Good predictive model for both training and new data sets
- Is the desired model, between Under-fitting and Over-fittingPart 1 (đề Doãn Đông)
1. What is the suppervised learning? Give at least 2 algorithms of supervised learning?
Supervised learning is a type of machine learning where the algorithm is trained on a labeled lOMoAR cPSD| 59735516
dataset, which means that the input data is paired with corresponding output labels. The goal of
supervised learning is to learn a mapping from inputs to outputs so that the algorithm can make
predictions or classifications on new, unseen data.
2 examples of supervised learning algorithms are:
- Linear regression is a simple and widely used algorithm for predicting a continuous output
variable (also called the dependent variable) based on one or more input features (independent
variables). It assumes a linear relationship between the input features and the output.
- Such as Support Vector Machines (SVM), decision trees, random forests, neural networks, etc.,.
2. What is similarity and difference between logistic regression and linear regression? a. similarity
- Both logistic regression and linear regression are supervised learning algorithms, - Both are parametric models
- Both models assume a linear relationship between the input features and the output.
b. Differences between Logistic Regression and Linear Regression: Linear Regression Logistic Regression Nature of
predicting a continuous output
binary classification problems, where the Output variable. It's suitable for
output variable is categorical and takes on problems where the target
two possible values (e.g., 0 or 1, true or variable is numeric and can false). take any real value. Output n uses a linear combination of
uses the logistic function (sigmoid Functio input features to produce a
function) to produce probabilities for continuous output,
binary classification. The logistic function
squashes the output to the range [0, 1].
Interpr etation the output is interpreted as the
the output represents the probability of of Outp ut predicted value of the target
belonging to a particular class. This variable.
probability can then be used to make a
binary decision based on a threshold
(e.g., if the probability is greater than 0.5,
classify as class 1; classify as class 0).
Loss Fu nction uses mean squared error as the
uses the log-likelihood or cross-entropy loss function loss Applica tion
used for regression tasks, such
used for classification tasks, such as spam as predicting house prices
detection or medical diagnosis Exercise:
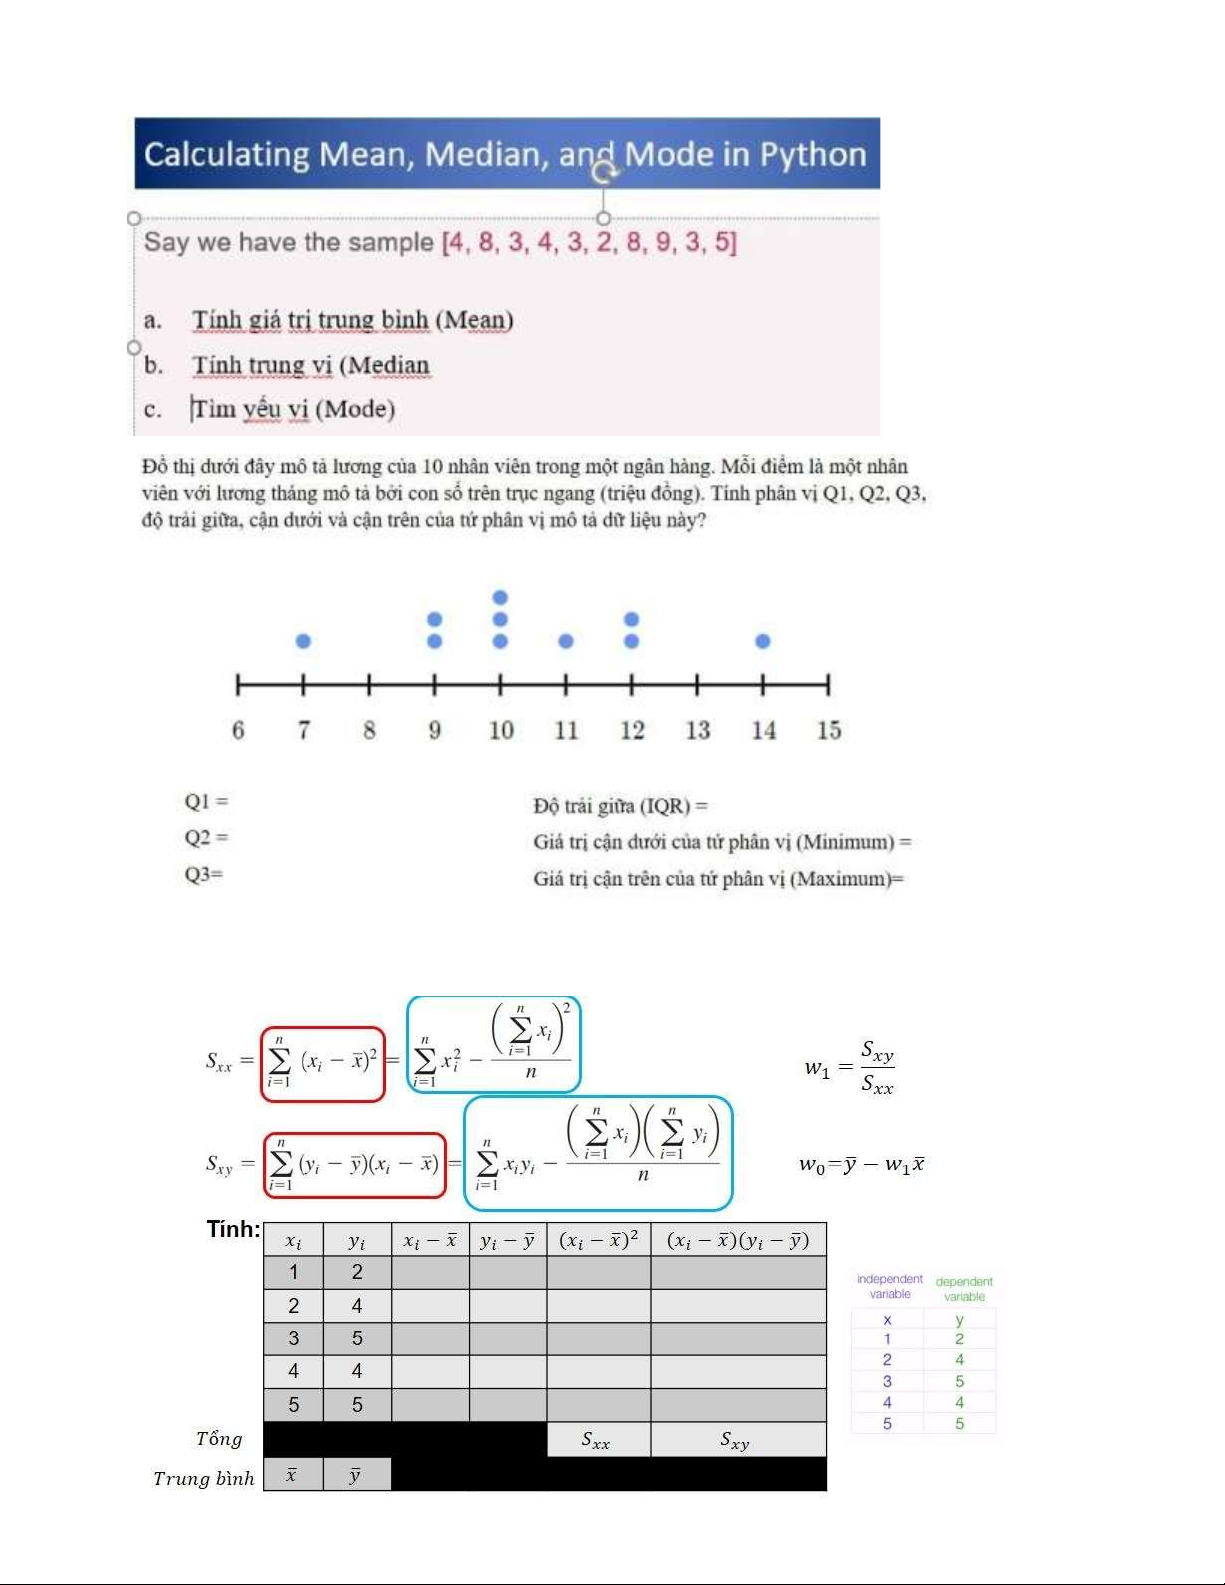
Ex 1: Entropy and Information Gain lOMoAR cPSD| 59735516 lOMoAR cPSD| 59735516 lOMoAR cPSD| 59735516 Ex 2:
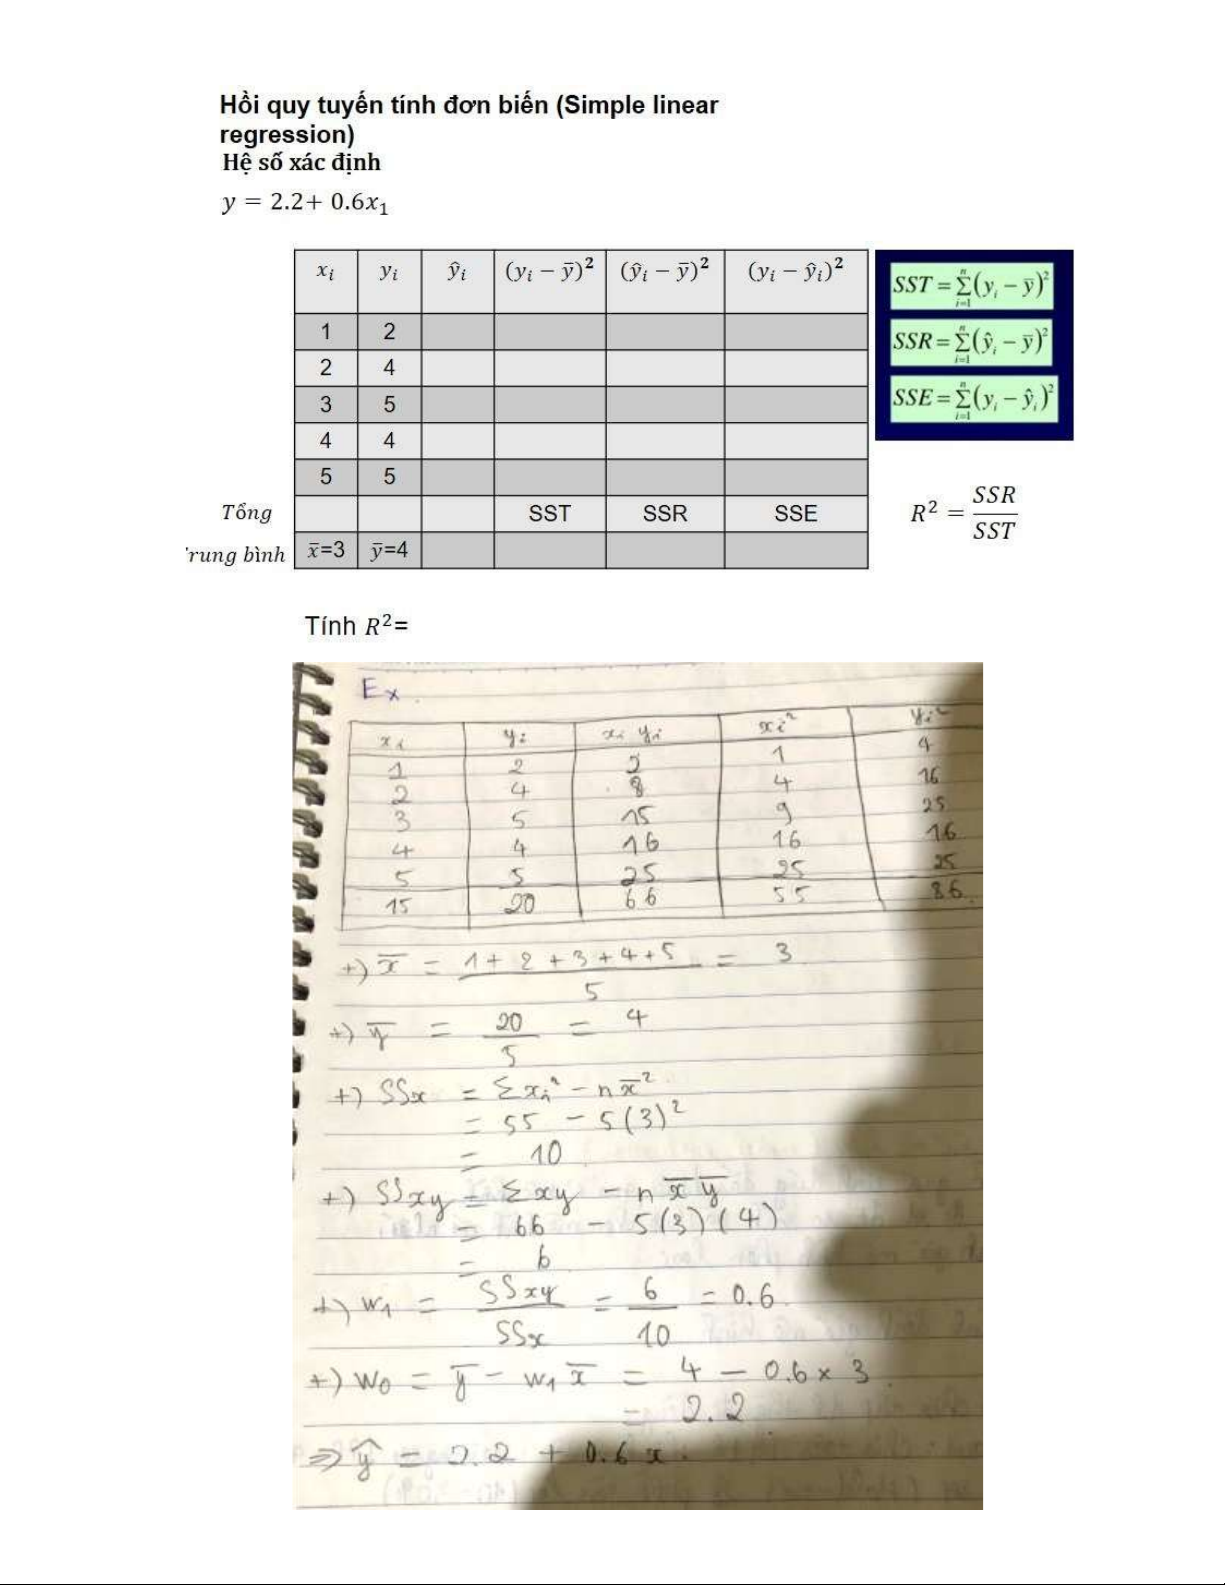
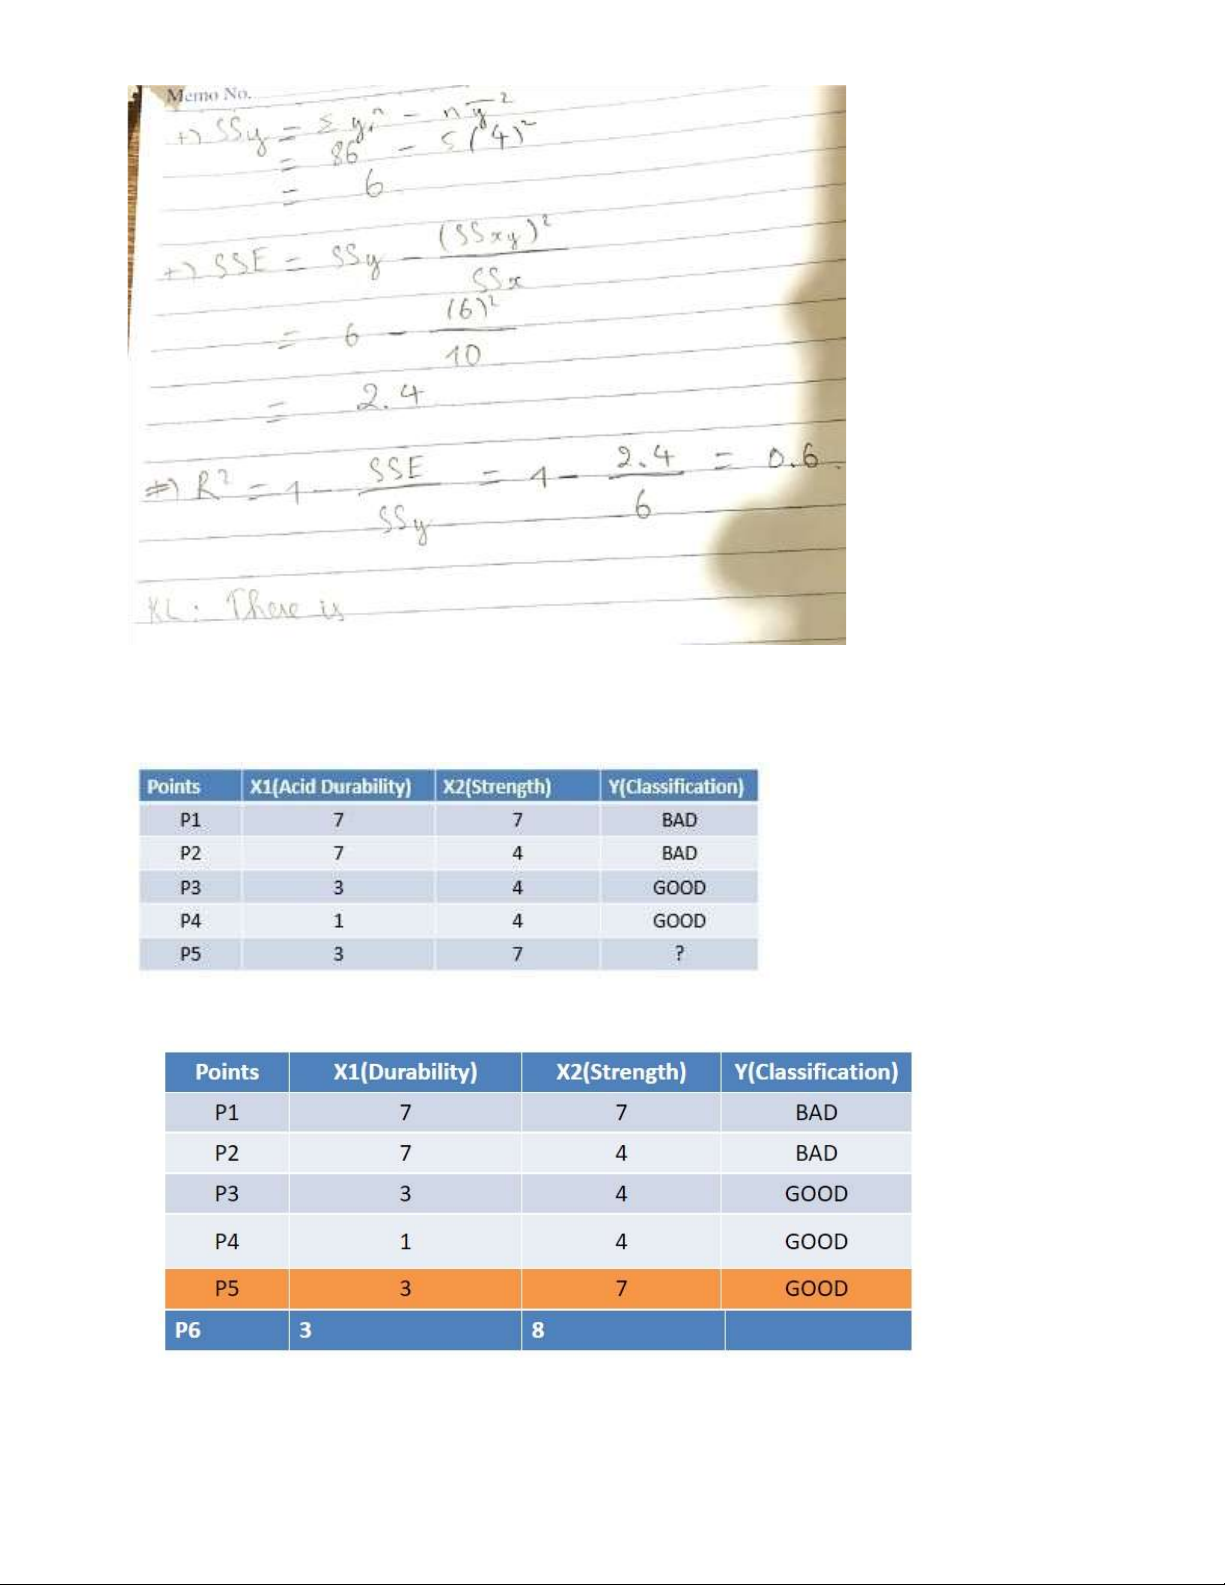
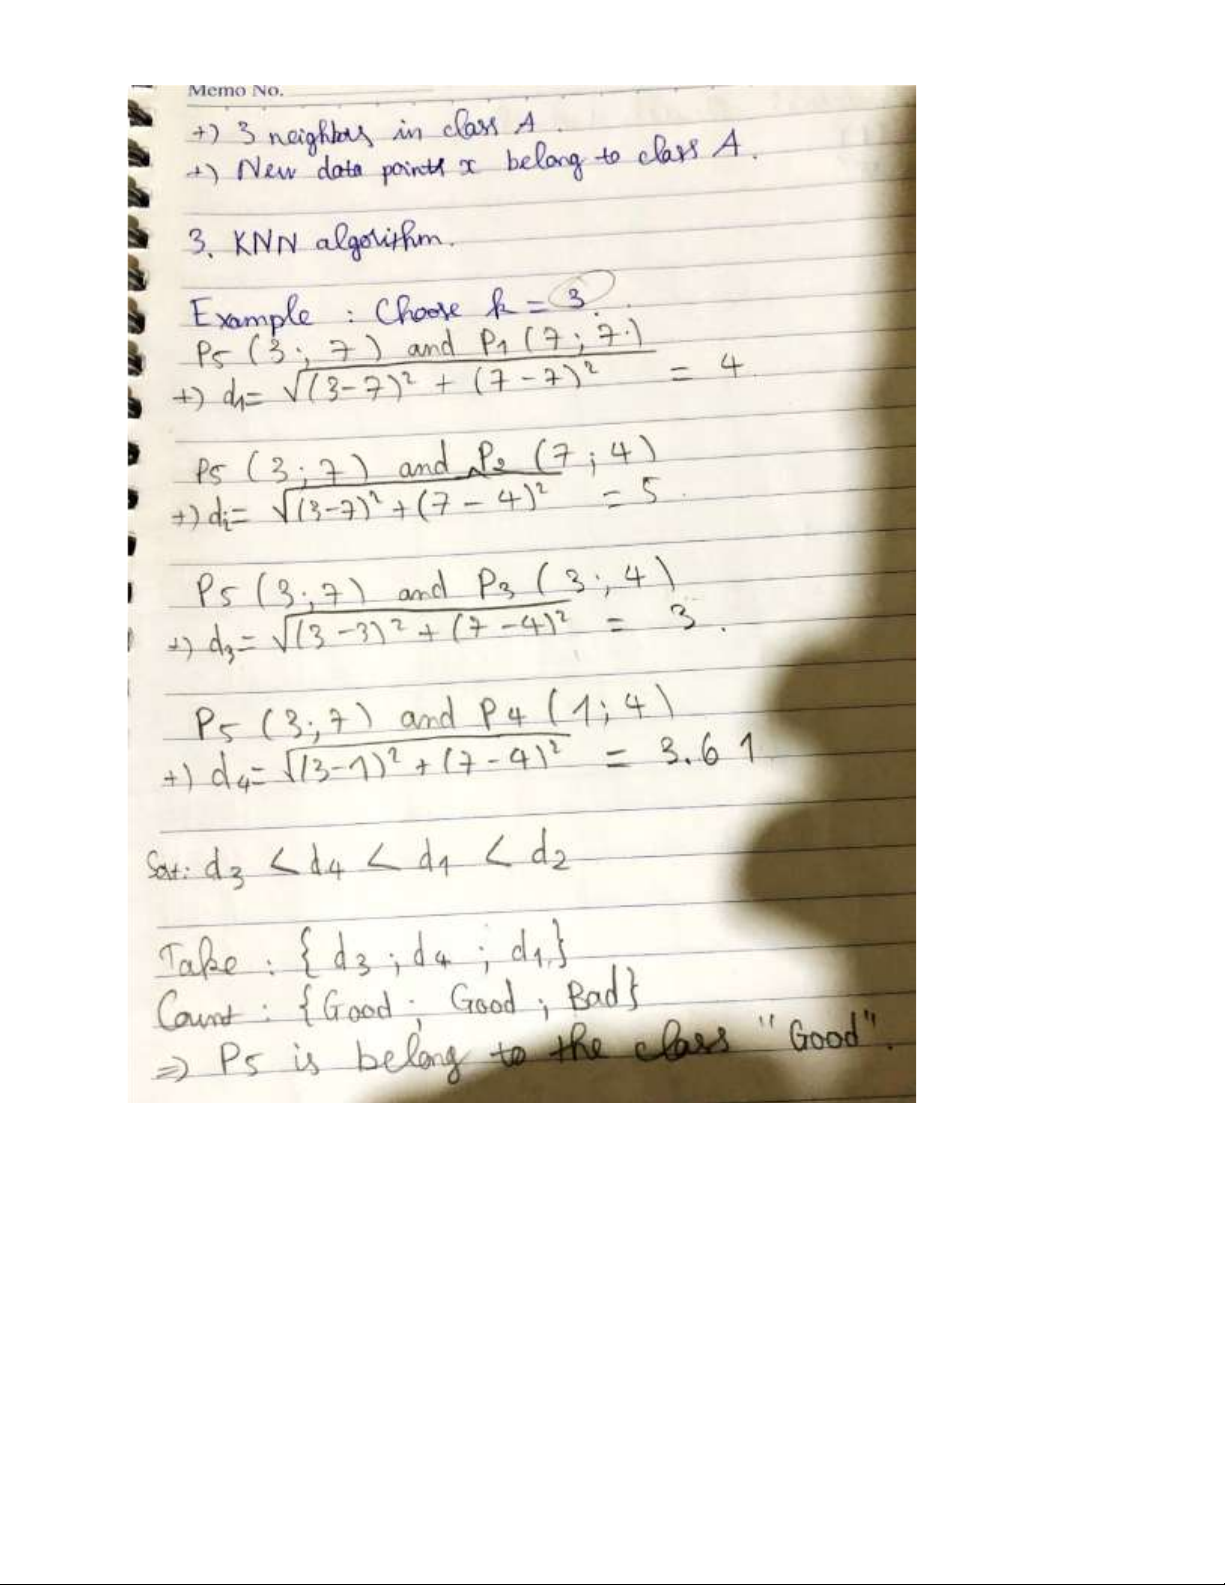
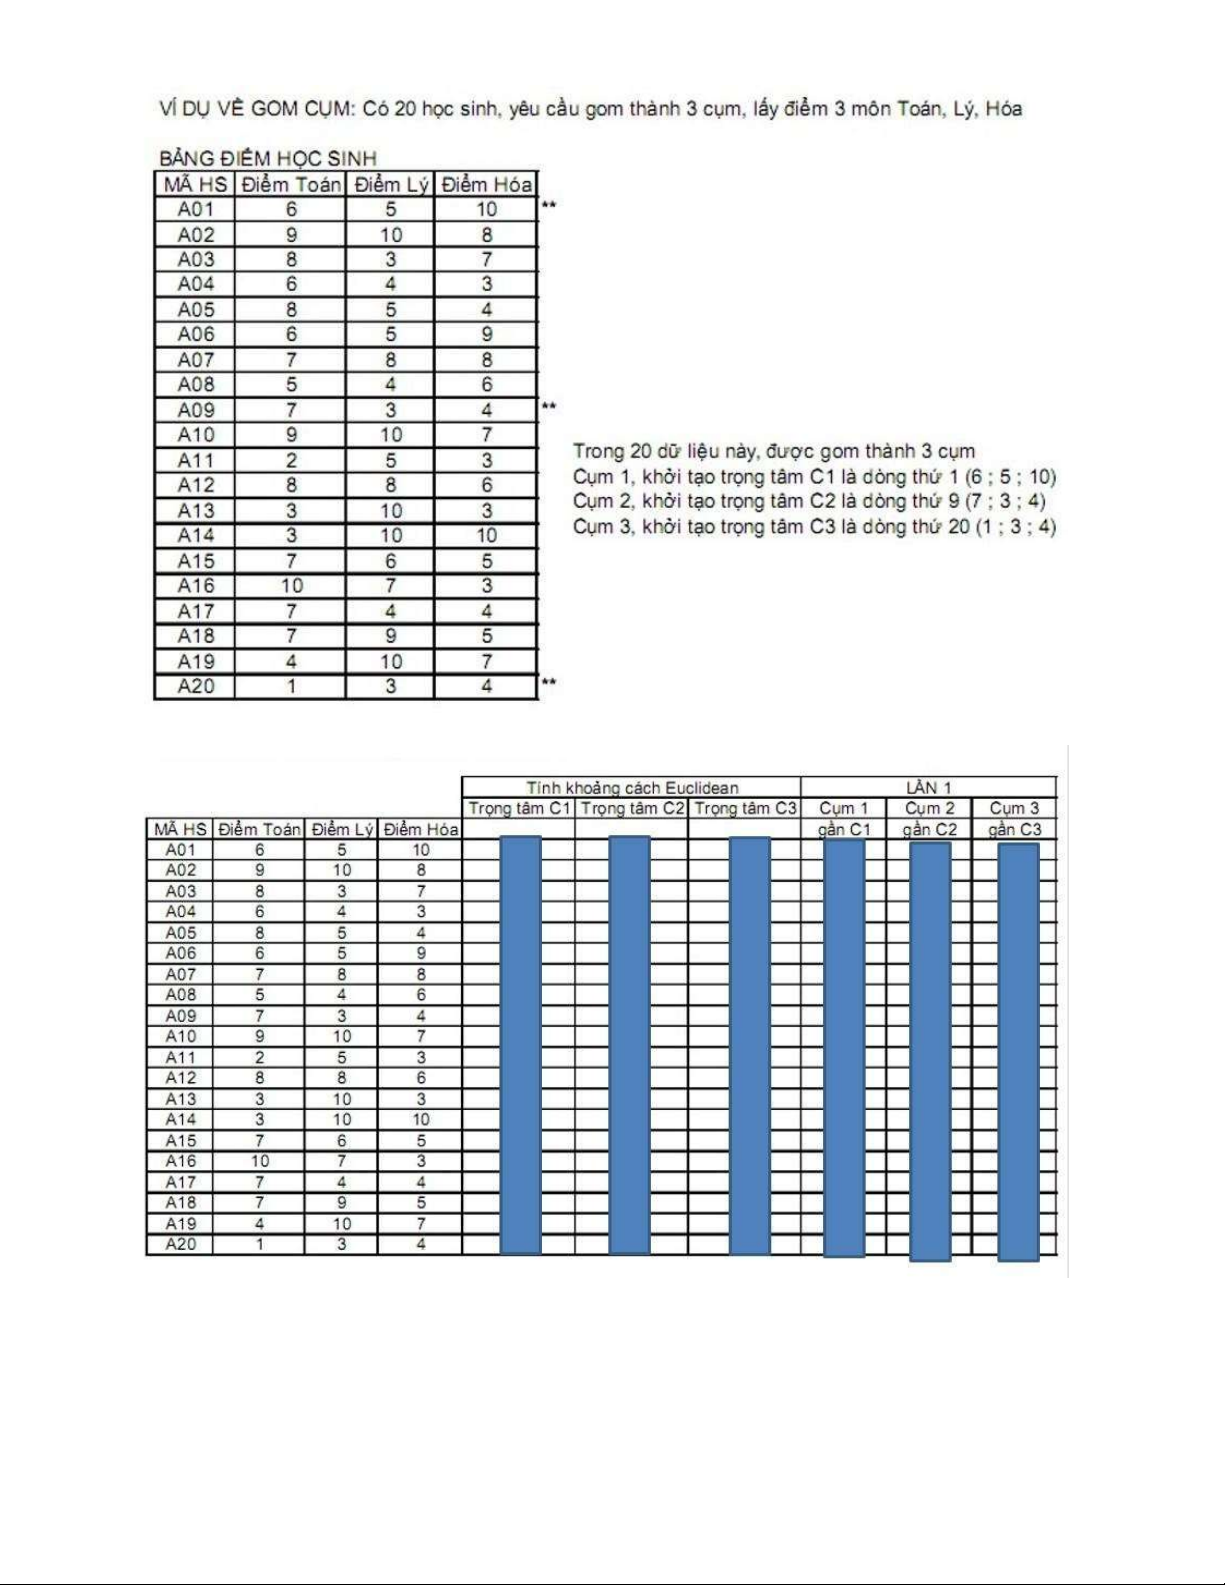
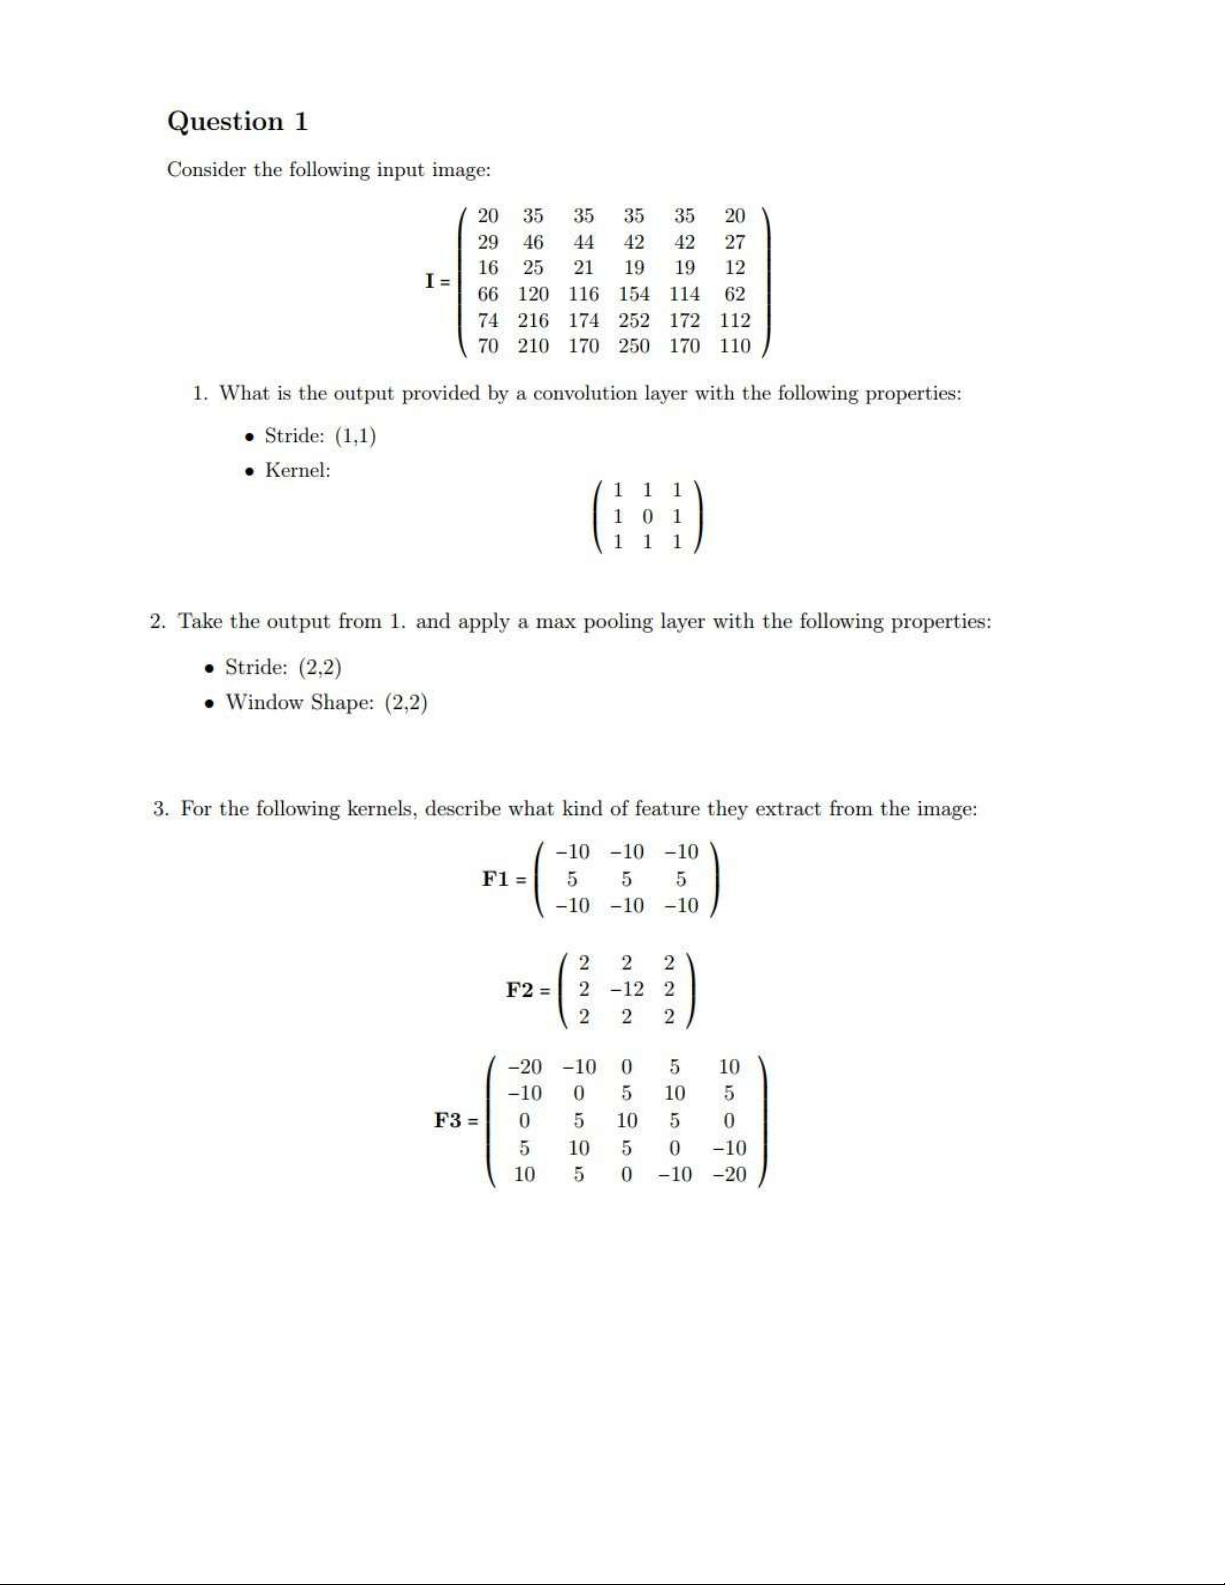
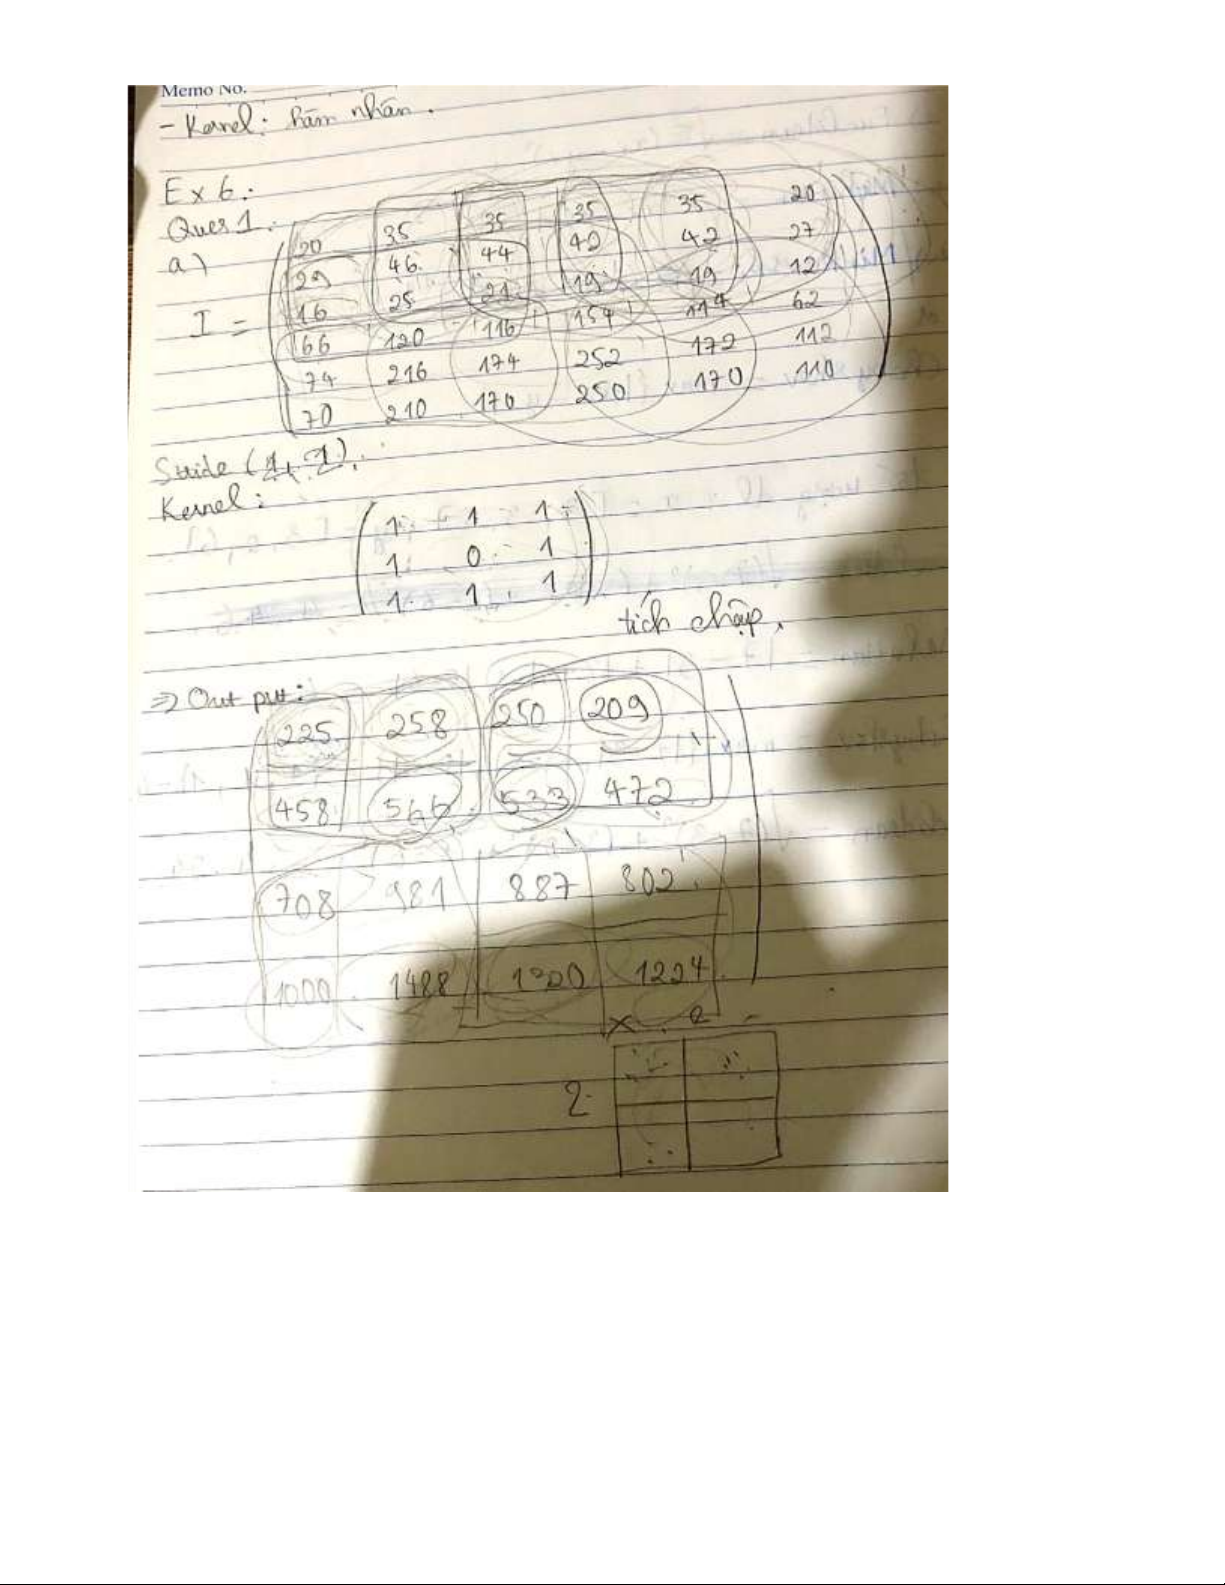
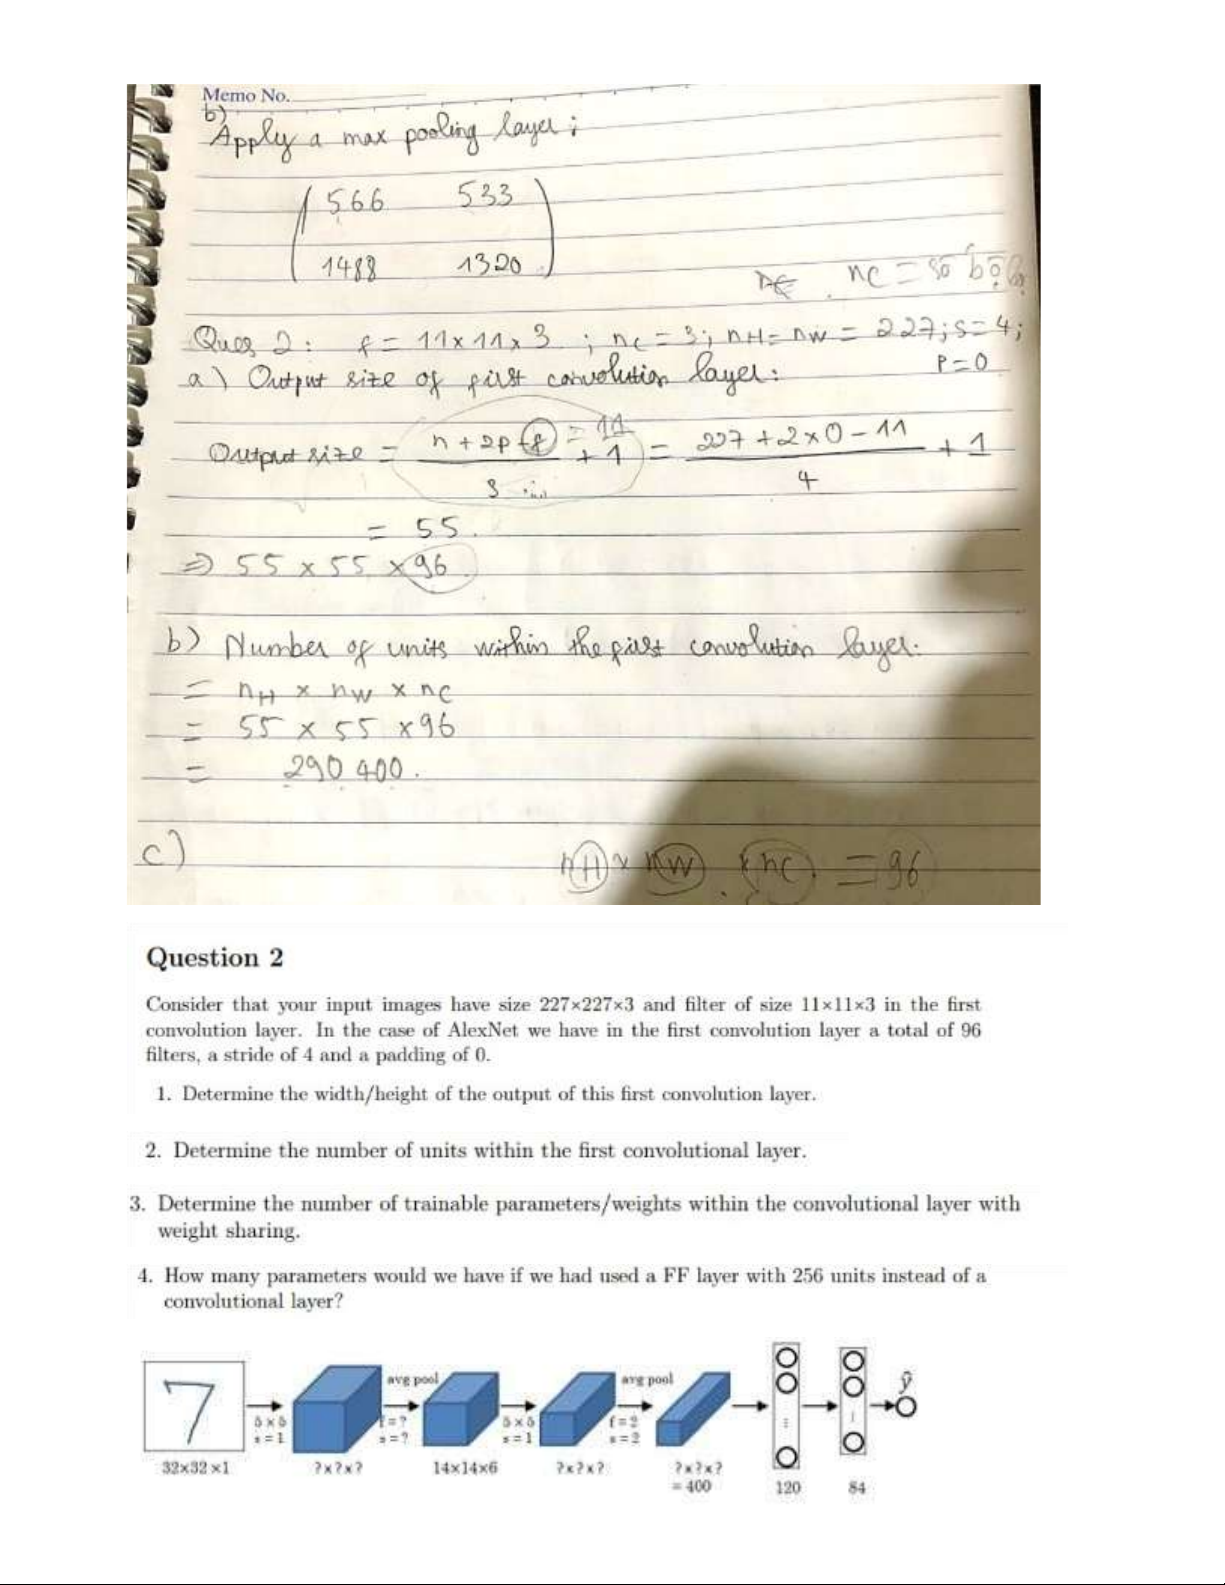
Ex 3: Simple Linear Regression lOMoAR cPSD| 59735516 lOMoAR cPSD| 59735516 Ex 4: K-NN a) b) lOMoAR cPSD| 59735516 Ex 5: K-means lOMoAR cPSD| 59735516 Ex 6: CNN lOMoAR cPSD| 59735516 lOMoAR cPSD| 59735516 lOMoAR cPSD| 59735516
Tài liệu liên quan:
-
Tien Xu Ly Du Lieu P2 - Nhập Môn Khai Phá Dữ Liệu. Môn Khai phá dữ liệu (UET) | Trường Đại học Công nghệ, Đại học Quốc gia Hà Nội.
101 51 -
DATA 8 Final Exam Instructions and Guidelines, Spring 2024. Môn Khai phá dữ liệu (UET) | Trường Đại học Công nghệ, Đại học Quốc gia Hà Nội.
119 60 -
DATA 8 Spring 2023 Foundations of Data Science Final Exam Guide. Môn Khai phá dữ liệu (UET) | Trường Đại học Công nghệ, Đại học Quốc gia Hà Nội.
115 58 -
Data 8 Fall 2024 Midterm Exam: Foundations of Data Science Insights. Môn Khai phá dữ liệu (UET) | Trường Đại học Công nghệ, Đại học Quốc gia Hà Nội.
126 63 -
Khai Phá Dữ Liệu Không Gian: Khảo Sát và Ứng Dụng (Chương 16). Môn Khai phá dữ liệu (UET) | Trường Đại học Công nghệ, Đại học Quốc gia Hà Nội.
91 46