Ey saf whitepaper final - english | Đại học Văn Lang
Ey saf whitepaper final - english | Đại học Văn Lang giúp sinh viên tham khảo, ôn luyện và phục vụ nhu cầu học tập của mình cụ thể là có định hướng, ôn tập, nắm vững kiến thức môn học và làm bài tốt trong những bài kiểm tra, bài tiểu luận, Ey saf whitepaper final - english | Đại học Văn Langbài tập kết thúc học phần, từ đó học tập tốt và có kết quả cao cũng như có thể vận dụng tốt những kiến thức mình đã học
Môn: English (EIIGH) 40 tài liệu
Trường: Trường Đại học Văn Lang 1.5 K tài liệu
Tác giả:


Preview text:
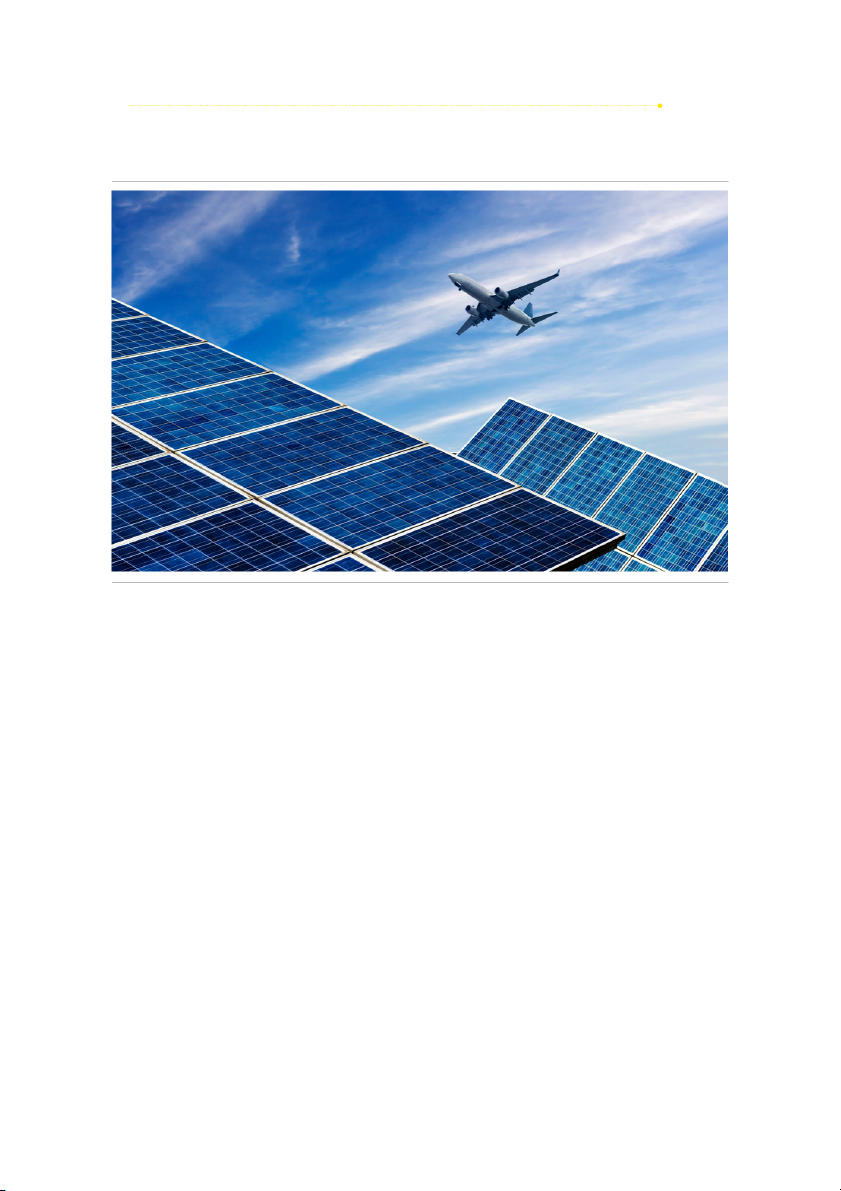
Sustainable aviation fuel (SAF) on the rise Sustainable development through a dynamic environment 01 SAF on the rise
Sustainable aviation fuel (SAF) has been on a slow rise to replace conventional jet fuel and is
widely accepted as the most promising path to achieve net zero air travel in the short to medium
term. From governments to airlines, aggressive SAF goals have been implemented, but actions
and policies required to meet these goals fall short. An unpredictable geopolitical and economic
environment over the next five years further adds to the complexity of widespread SAF adoption.
SAF adoption and capacity will likely be impacted as countries shift toward establishing bloc
alliances and focus on developing policies that strengthen technologies related to energy
independence and national security. It is critical to understand how different geopolitical
scenarios shape the future of SAF in order to participate in the SAF economy effectively and
capitalize on the promising opportunity it presents.
How SAF could be the key to greener skies
Recent advancements in green technology for the aviation sector are dramatically shifting sentiment away from the
often-held, but false, view that environmental sustainability and commercial air travel are conflicting concepts.
SAF has the potential to deliver the performance of petroleum-based jet fuel, with up to a 100% reduction in net CO , 2
giving airlines better footing for decoupling greenhouse gas emissions (GHGs) from air travel. SAF could also be a dynamic
investment opportunity for those looking for new ways to tap into the sustainability market.
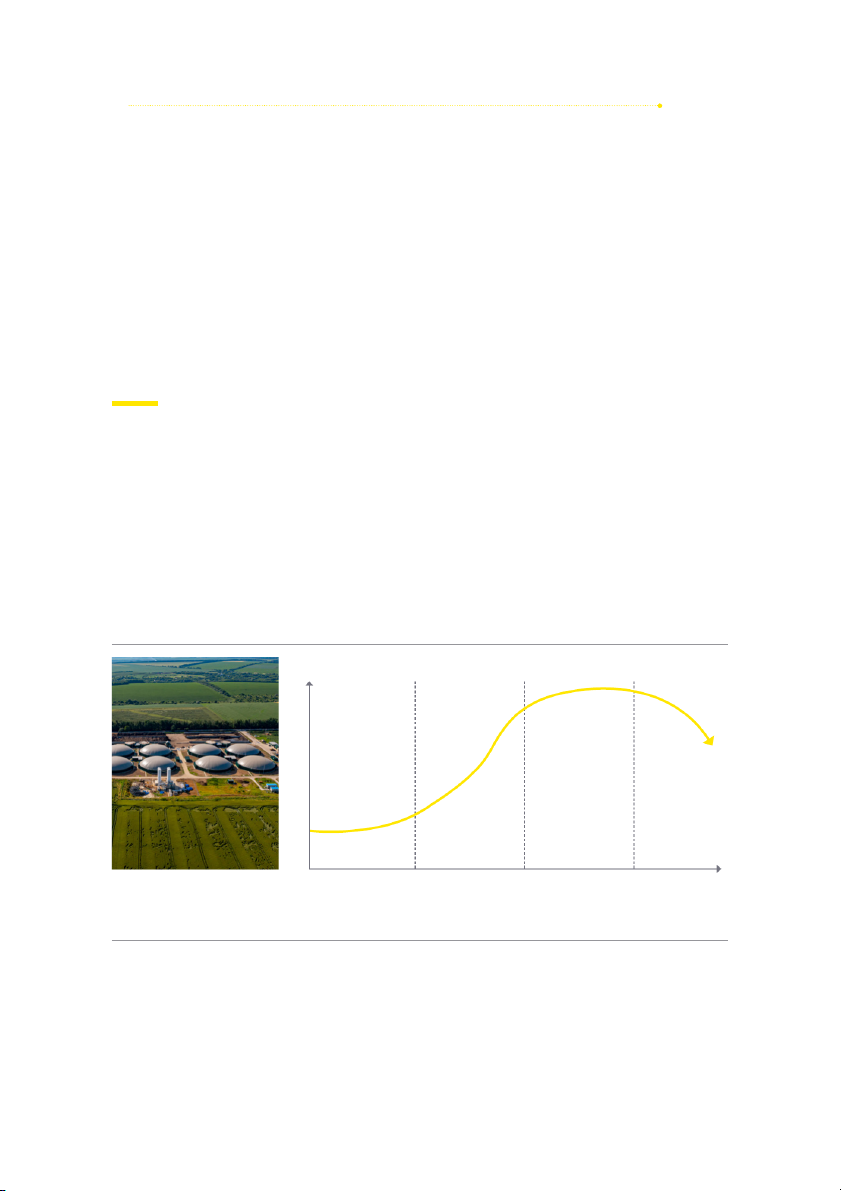
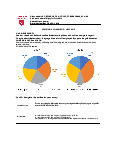
The EY SAF Survey 2022 explored SAF adoption trends and a five-year market outlook. The survey included responses
from industry practitioners, investors, travel industry partners and service providers. Seventy-six percent of the survey
respondents consider the SAF industry to be in the emerging phase. Being in the emerging phase means there are new SAF
producers entering the market rapidly to test new technology and gain market share.
76% of survey respondents think SAF is in the emerging phase of the technology lifecycle e c n a 19% 5% rm rfo Growth Mature e 0% P phase phase Declining phase 76% Emerging phase Lifecycle
Source: EY SAF Survey 2022
Emerging: early development and proof of concept stage for a novel technology
Growth: beyond proof of concept and available for use in small capacity
Mature: widely available and utilized as a preferred solution
Declining: losing demand in the market with risk of being replaced by an alternative technology 02 SAF on the rise
With the first flight with a SAF blend taking off in 2008, it
electrifying propulsion is the low specific energy (or mass-
has since seen a growing interest from energy producers,
based energy density) of batteries, which severely limits
aircraft original equipment manufacturers (OEMs) and
flight range. Electric aircraft would also require significant
airlines alike. To date, we have seen more than 450,000
infrastructural transformation, including improving
commercial flights with more than 50 airlines using SAF.
the electrical grid at airports to support high-powered
That number is still low, given approximately 38.9 million
charging required for electric aviation.
commercial departures in 2019 alone, but still encouraging
Hydrogen can play a strong role in the aviation fuel mix.
as SAF adoption is increasing. Although blended SAF flights
However, there are significant challenges in designing a
are taking off regularly, industry and regulators are now
hydrogen-powered aircraft for commercial aviation. Liquid
looking to transition to 100% “drop-in” SAF in the near
hydrogen has 2.8 times the specific energy of jet fuel
term. Currently available SAF has the potential to reduce
but the extra weight required for fuel storage becomes a
carbon emissions by up to 80%, having the potential to
major disadvantage for hydrogen. Fuel consumption may
reach 100% with future SAF technology in the near future.
decrease, engines will be smaller, engines will make less
Organizations and governments working to promote
noise, and there will be no CO emissions but hydrogen 2
sustainable air travel see SAF as having the most impact in
powered aircrafts will likely be limited to short-haul
achieving net zero carbon emission by 2050, while other
flights. Massive investment is needed to boost hydrogen
technologies are being explored. Electric and hydrogen
production. New aircraft and engines compatible with
technologies are often presented as alternatives to
hydrogen must be designed and manufactured. Although
conventional jet fuel along with SAF, but those technologies
short haul H powered demonstration flights are in 2
are relatively less mature, require major infrastructure
development, a wide adoption of hydrogen powered flights
changes for both aircraft and airport logistics, and, in the
may not be viable until 2040 or 2050.
case of electric, are unlikely to have sufficient range for
Given the limitations of electric and hydrogen aircraft,
long-haul commercial flights by 2050.
SAF remains the most viable solution to help the
Electric propulsion is in the very early stages of
commercial aviation industry reach its goal of achieving
development, and it may take until 2030–35 for
net zero carbon emission, which is in line with the Federal
short-range commercial aircraft to be technically
Aviation Agency (FAA) 2021 Aviation Climate Plan and
feasible and viable for short-range travel. The ability
International Civil Aviation Organization (ICAO) long-term
for electric aircraft to travel beyond regional/domestic
global aspirational goal report.
routes is likely even further away. The biggest challenge in 03 SAF on the rise The case for SAF
SAF can be produced from a number of sources
specialized players are witnessing increases in both the
(feedstocks), including waste oil and fats, agriculture
number and value of private investments, up from three
and municipal waste, and non-food crops. It can also be
transactions valued at $31m in 2008 to 11 transactions
produced synthetically via processes that capture carbon
and $651m in the first half of 2022. The combination
directly from the air. SAF feedstock is sustainably sourced
of historical underinvestment and rising demand has
since the raw feedstock does not compete with food
created an imbalance, thus creating a potential market
crops or water supplies and is not responsible for forest
for new entrants. Venture capital firms, corporates, and
degradation. Five million gallons of SAF were produced
government grants and loans are the major sources of
in the United States in 2021, while targets under the SAF
capital for these specialized entrants into the SAF market.
Grand Challenge, proposed by the Biden Administration
Increasing SAF demand has also driven M&A activity toward
in 2021, aim to produce 3 billion gallons by 2030. Given
renewable fuel, primarily in the oil and gas sector. The focus
the upward trend in current production levels, feedstock
has been on integration and market share expansion, as
availability and demand, this target is likely to be achieved
well as raw material procurement, supply chain integration
if positive momentum toward SAF development continues. and technology evolution.
An ecosystem of both specialized and diversified players
In addition to increased investment activity, commercial
is involved in SAF development. Diversified producers
aerospace companies and airlines are entering into
are defined as conventional fuel companies that have
partnership agreements with SAF manufacturers to meet
been producing traditional fuel and have been expanding
their net zero targets. Companies that rely on heavy
into SAF, while specialized producers are defined as fuel
business travel are entering “book-and-claim” agreements
companies focusing primarily on producing sustainable
with airlines to help offset their carbon footprint. Book-and- and renewable fuels.
claim agreements enable corporations to participate in SAF
While there are still concerns about supply for this new
economy especially when SAF is not physically available for
energy source, SAF technology continues moving forward.
their business travels. These agreements are on the rise
In line with characteristics of an industry in the emerging
across industries and will likely benefit the overall adoption
phase, 62% of experts we surveyed predict specialized SAF
of SAF by creating positive demand signals. Current
producers will be more successful in gaining market share
global SAF production capacity, including plants coming
in the next five to seven years, while diversified producers
live before 2024, is estimated to be at 0.8 billion gallons.
will be successful in seven or more years due to market
The overall global SAF production capacity is expected to
consolidation and acquisition in the SAF industry. SAF is
reach 2 billion gallons by 2027 as specialized producers
also growing as an investment opportunity. For example,
aggressively add to their production capacity and new
producers enter the SAF market. 04 SAF on the rise The technology of SAF
By 2030, the SAF industry is projected to have 3,815 megatons (Mt) per year of biomass feedstock available. This should
yield approximately 120% of the projected 2030 global jet fuel demand of 108 billion gallons per year. Notably, these
figures don’t account for technologies not reliant on biomass feedstock, such as Power-to-Liquid (PtL) pathway which relies
on carbon capture technology, to produce SAF. In order to meet SAF goals of 2030, feedstock availability is least likely to be
a constraint but will depend on the supply chain and geopolitical risk.
As sustainability and technology continue to become intertwined with the acceleration of decarbonization efforts, those
working toward bringing SAF into everyday use have an opportunity to lead the transformation of the aviation industry.
Work continues to accelerate to develop new feedstocks and new methods of making SAF a reality. Nine SAF technologies
have received American Society for Testing and Materials (ASTM) approval, meaning that they can be used for commercial
flight. In our report, we included four SAF technologies that are most likely to scale and attract industry attention: 2030 Feedstock Conversion ASTM Technology Description Feedstocks Maturity availability rate¹ approval Waste and residue Hydrotreated Hydro-processing lipids, vegetable 90% Esters and Fatty of oils and fats to oils, palm, camelina, 195 Mt/year 2011 Acids (HEFA) produce diesel fuel jatropha, and used cooking oil Classification/ Conversion of carbon Municipal solid 13%
Fischer Tropsch materials into synthesis waste, coal, ash, 2,290 Mt/year 2009 (FT) gas, then fuel and sawdust Sugarcane, sugar Alcohol-to-Jet Conversion of alcohol beet, sawdust, 20% using catalytic steps 1,330 Mt/year 2016 (AtJ) plant dry matter to produce jet fuel (biomass) Synthetic fuel Methanol Power-to-Liquid production through CO , water, 2 17% and other combining electricity renewable N/A (PtL) pathways under with CO and water to electricity 2 consideration produce hydrogen
Source: World Economic Forum, ASTM, EY analysis
1. Yield of total output (including aviation and road fuel) relative to feedstock
The current conversion rates, which are defined as a percentage of SAF yield from the feedstock, will improve with maturity
in technology and enhancement in production capacity, further promoting SAF adoption. Based on current maturity
levels, HEFA will drive a majority of SAF production in the short term, with other technologies such as PtL rising in their
contribution to SAF supply in the coming years as they mature. PtL supply depends on carbon capture and hydrogen
supply, both of which are forecast to far exceed demand scenarios for PtL. In particular, the projected scalability,
long-term cost decline, and feedstock availability of PtL will likely make this technology the primary pathway for SAF
production in the long term. The industry is executing strategic investments today in hydrogen and renewables to achieve this goal beyond 2030. 05 SAF on the rise Policy can also fuel adoption
A strong government push, in terms of mandates and incentives, is expected to have a significant impact on SAF production
and adoption. Based on our survey, 50% of respondents believe that increased policy incentives would be the highest impact
driver of adoption, while 35% believe that imposing tax burdens on traditional energy producers and users would have the
highest impact. Many countries are in the initial stages of framing policies for SAF adoption, with the US and EU leading the
way with tangible policies and goals to promote SAF production. Even though 135 member countries have submitted their
state action plans to reduce aviation-related carbon emissions to the ICAO to support its long-term aspirational goal of net
zero emissions by 2050, a majority of them lack targeted policies and tangible incentives for a widespread SAF adoption.
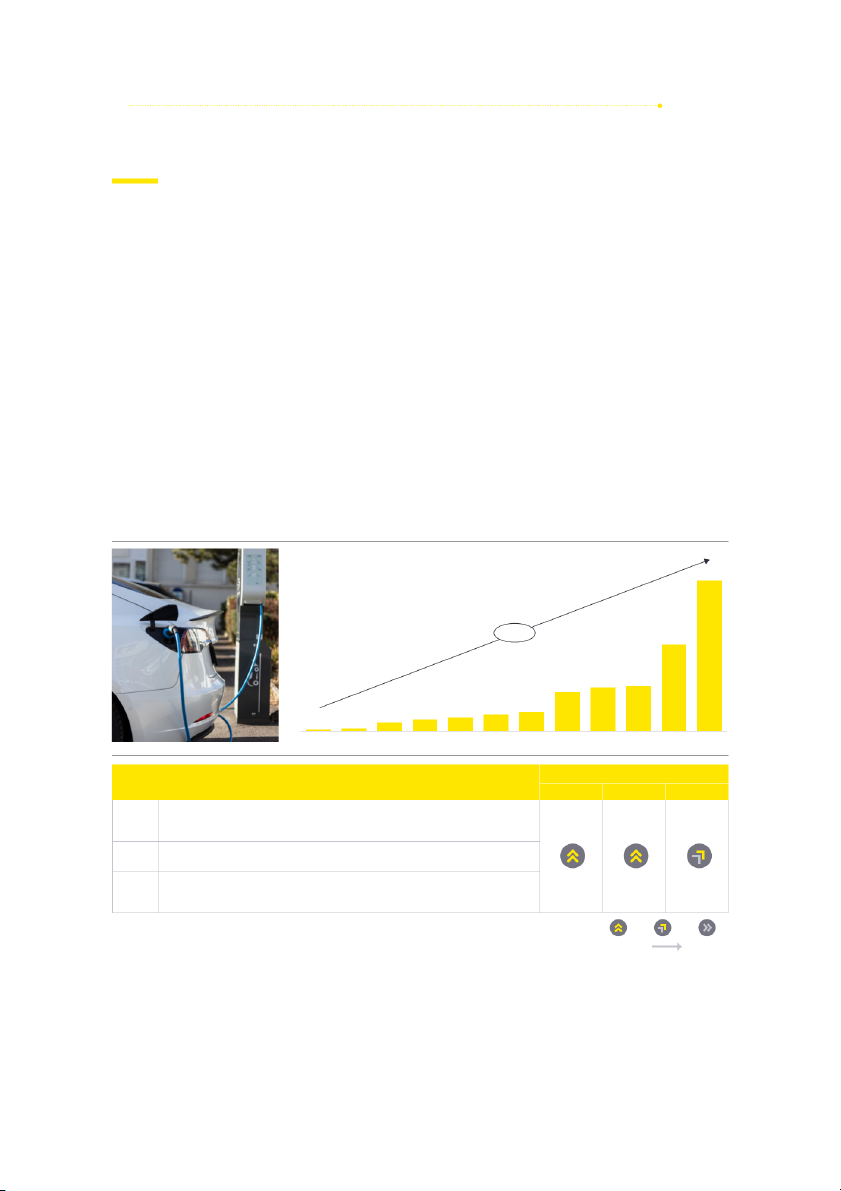
Strong policy measures have had a major impact on similar technologies in other sectors. Electric vehicles (EVs) and
residential solar power adoption have increased dramatically over the last 10 years. Major incentives and mandates have
been introduced in the United States that positively impacted production and affordability of these alternative technologies.
For example, EVs have been growing at the annualized rate of 46% over that period, with 2021 seeing the biggest jump. EV-
friendly policies and tax incentives introduced by the US government, both at the federal and state level, played a major role
in kick-starting the industry during 2009 and 2010. A study* published in 2016 found that more than 30% of EV sales were
attributed to the federal tax credit, with the impact going up to 49% for some vehicles. We continue to see a government
push toward EVs, with the government allocating billions of dollars toward EV manufacturing in the US as recently as 2022.
*Tal, G., & Nicholas, M. (2016). “Exploring the Impact of the Federal Tax Credit on the Plug-In Vehicle Market.” Transportation Research Record, 2572(1),
95–102. https://doi.org/10.3141/2572-11.
EV adoption in United States — number of cars sold 800k +49% 459k 207k 234k 239k 87k 104k 10k 15k 48k 64k 71k 2011 2012 2013 2014 2015 2016 2017 2018 2019 2020 2021 2022 Impact Electric vehicles Production Adoption Price
US government pledged $2.48b in federal grants to support the development of 2009
next-generation EVs and batteries, with the goal of becoming the first country to
have 1 million EVs on the road by 2015
Federal Income Tax Credit up to $7,500 on all newly purchased all electric and 2010 plug-in hybrid vehicles
Paris Agreement established and Zero Emission Vehicle Alliance partners commit to 2016
sustainable transport electrification, including at least 20% of all road transportation
to be powered by electric power by 2030
Source: International Energy Agency (IEA), Alternative Fuels Data Center (AFDC) Energy, EY analysis High positive Moderate 06 SAF on the rise
Solar power follows a similar trend as EVs, with the US government introducing tax credits and collaborative measures with
industry partners to develop solar capacity within the US. These actions played a key role in lowering prices and improving
mainstream adoption. The combination of grants, tax credits and direct investments led to an annualized growth rate of
47% of installed residential solar power in the from 2012 to 2019.
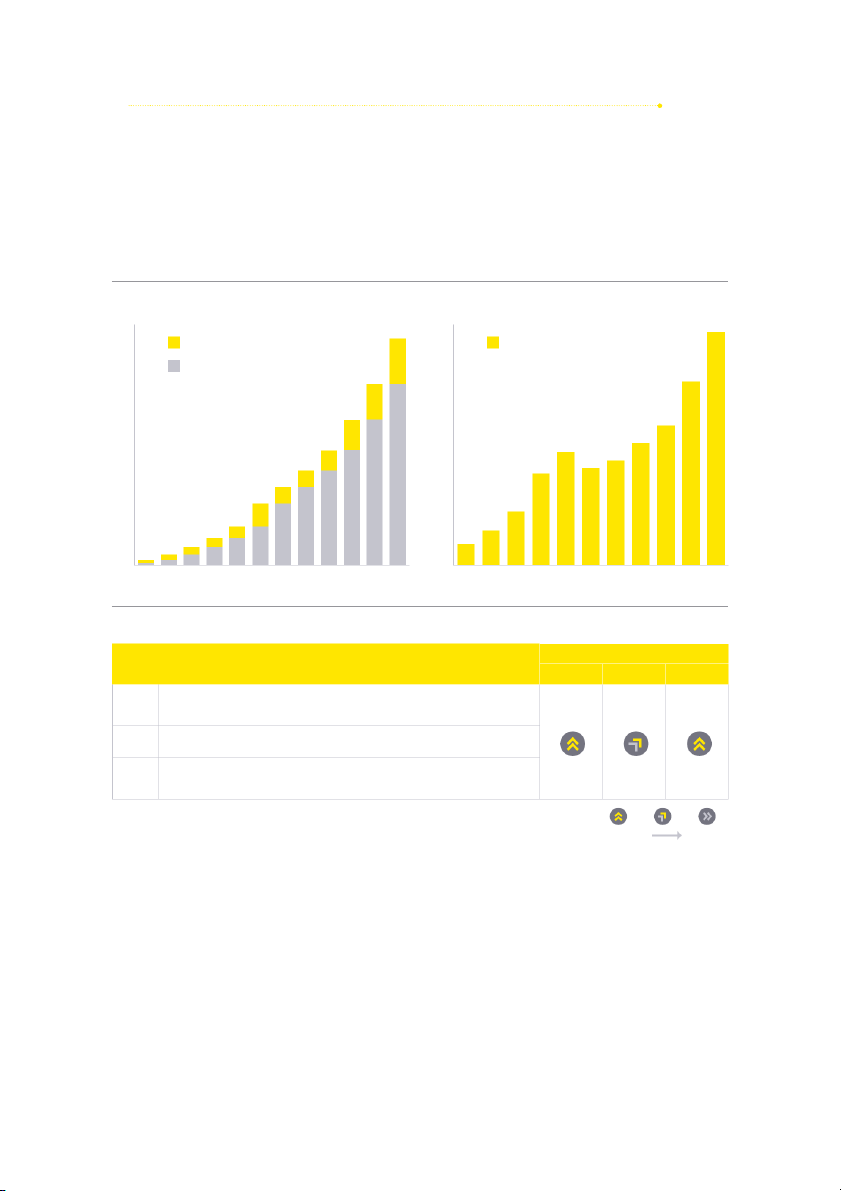
Solar Power Production in United States (GWp)
Installed Residential Solar Power Capacity in US 160 5.5 5.3k 151 New installation 5.0
Residential Capacity Installation (MW) 140 Existing capacity 4.5 121 4.2k 120 4.0 96 3.5 100 3.2k 3.0 2.8k 77 80 2.6k 2.5 2.4k 63 2.1k 2.2k 60 52 2.0 41 1.5 40 1.2k 26 1.0 0.8k 18 20 12 0.5k 7 0.5 4 0.0 1 201 2012 2013 2014 2015 2016 2017 2018 2019 2020 2021 2022 2012 2013 2014 2015 2016 2017 2018 2019 2020 2021 2022 Impact Solar energy Production Adoption Price
Per the Recovery and Reinvestment Act, the federal government funded 2010
104,733 projects totaling $24.9b
Federal tax credit for solar per the financial bailout bill is extended till 2016 to 2016
generate 28 gigawatts of solar power
SunShot Initiative to reduce the cost of solar power by 75% from 2010–20; the 2016
levelized cost of energy generated by large solar plants reduced by 82%
Source: Solar Energy Industries Association (SEIA), U.S. Department of Energy (DOE) High positive Moderate 07 SAF on the rise
Although SAF policies are still in development globally, the US and EU have been ramping up formal support and incentives
for SAF. For example, the Inflation Reduction Act passed in 2022 offers tax credits up to $1.75 a gallon for SAF production
and $297 million in grants projects related to production, transportation, blending or storage of SAF. In total, the US has
announced more than $5 billion in grants and incentives, including tax credits, to SAF producers and consumers. Similar
grants and targets have been launched in the EU along with a proposed SAF mandate, with global policy activity expected
to ramp up in the next five to seven years.
One of the challenges in gaining acceptance of new technology is that it is usually more expensive than the technology it
is trying to replace. As technological improvements are made and strategic investments come into play, the price gradually
becomes less prohibitive. Incentives and policies can have a significant impact on the success of the technology. Depending
on the feedstock and pathways, these incentives can be stacked to have a favorable impact on SAF adoption. SAF produced
using bio-mass based feedstock qualifies for Renewable Identification Numbers (RINs) under the Renewable Fuel Standard
(RFS2) which incentivizes purchase of SAF. This is in addition the blenders tax credit introduced by the Inflation Reduction
Act (IRA) in 2022 which provides the producers a range of tax credit from $1.25 to $1.75 per gallon based on lifecycle GHG
emissions of the SAF pathway. Additionally, the IRA has introduced and improved tax benefits to incentivize production of
clean hydrogen (45V) and carbon capture (45Q) in the United States which is particularly helpful for technologies such as
Power-to-Liquid (PtL). There are additional incentives at a state level such as California's Low Carbon Fuel Standard (LCSF)
that can utilized for SAF production in the state. 08 SAF on the rise
We provide a comparison scenario of potential tax benefits of SAF produced using FT and PtL pathways below.
Tax incentives introduced in the United States provide a tremendous benefit for fuel producers and is expected to
accelerate SAF adoption in the near term.
SAF Inventive Stack — Typical Scenario
Federal and State Incentive Stack — Fischer-Tropsch (FT)
Federal and State Incentive Stack — Power-to-Liquid (PtL)
US Dollars per gallon; Feedstock: MSW, Ag, Forest Residue
US Dollars per gallon; Feedstock: Direct Air Capture (DAC) $5.6 $4.9 $1.3 $1.5 $3.6 $4.1 $0.0 $0.0 $1.1 $1.2 $2.5 $4.9 $5.6 $1.2 $3.6 $4.1 $2.5 $1.6 $0.0 US SAF 45Q 45V Federal LCFS Federal + US SAF 45Q 45V Federal LCFS Federal + EPA BTC (Cabon (Green Incentives (CA) State EPA BTC (Cabon (Green Incentives (CA) State RIN (CFPC) Capture) H2) Incentive RIN (CFPC) Capture) H2) Incentive
Source: ASCENT, International Energy Agency, EY Analysis 09 SAF on the rise
Federal regulations and incentives, along with improvements in technology readiness, will likely be more effective at
driving SAF adoption than mandates. While both solar and EVs continue to see billions of dollars’ worth of investment from
the government to accelerate production and adoption, SAF has yet to see incentives and programs of that magnitude
specifically targeted to increase SAF production. Aggressive SAF goals, set by governments and organizations, that are
accompanied by major incentives, will be required to accelerate the supply of SAF in the United States, since there is no
shortage of SAF demand. The number of commercial SAF offtake agreements has risen globally in an effort to decarbonize
the industry. In terms of intake agreements, 59 have been signed in 2021–22, compared to only nine in 2019–20. For SAF
adoption to take off, governments across the world will need to align their incentives and programs to the ambitious goals
they have set to reach net zero travel through SAF.
However, there are still challenges to be overcome before SAF becomes the standard fuel for the aviation industry.
SAF policy development timeline
• Inflation Reduction Act — Incentives to use
SAF up to $1.75 per gallon. Infrastructure grant of $245m
• SAF Grand Challenge — 3b gallons of SAF and
• Sustainable Aviation Tax Credit — Build Back
aviation emissions reduced 20% by 2030
Better Agenda with tax credit for 50% or more
• $4.3b for SAF opportunities, including $3b lifecycle GHG reduction s te • Energy Policy Act — loan guarantee
• Renewable Diesel and Sustainable Aviation ta US Renewable Fuel
• $175m in research funding for technologies
Fuel Parity Act — EIA to report production S d Standard (RFS) created to reduce SAF carbon emission
and import of renewable diesel and SAF ite updates through Energy
• >$61m to advance biofuels and support
• New sustainable aviation goal n Independence Act 2007 U
low-cost SAF pathways by the FAA 2022 2005 2021 2009 n 2016 io • Renewable Energy n Directive (RED) — EU 2019 U
• EC 2016 — EU energy and climate n 2021 a countries to source
goals for 2030, renewable energy • Dutch Sustainable e p at least 10% of their
target of at least 27% of total EU Aviation
• ReFuelEU Aviation — Fit for 55 ro transportation energy energy consumption by 2030 u Agreement — zero
package. Proposal to provide 2% E from renewable
• Initiative Towards Sustainable Kerosene CO emission SAF by 2025, 63% SAF by 2050 2 source by 2020
For Aviation (ITAKA) — collaborative from domestic
• The UK government launched
project for a large-scale European aviation by 2050
£15m “Green Fuels, Green Skies” drop-in HEFA SAF supply chain
competition to provide funding to
• Aviation Initiative for Renewable early-stage development of UK
Energy in Germany (AIREG) 2016 — SAF plants
support the production and use of SAF,
with a bio jet target of 10% of jet fuel consumption by 2025 in Germany
Source: ICAO report, IATA report, EY secondary research, EIA: Energy Information Administration, FAA, S&P Global 10 SAF on the rise
Impact of geopolitical environment on SAF adoption
The global political environment continues to be unpredictable, and emerging technologies like SAF are not immune
to this. It is critical to look at SAF through the dynamic geopolitical lens, since adoption of new technologies like SAF
depends heavily on these factors. Factors such as government policies, production capacity and demand, and price parity
with traditional jet fuel are all variables that react heavily to the geopolitical environment. The added pressure of energy
independence and supply chain resiliency further add to this dynamic and complex environment. Understanding how
SAF outlook changes based on the events of the world prepares us to participate in SAF adoption in a variety of geopolitical scenarios.
Global scenario analysis reveals diverging paths for geopolitics, economic policies and company strategies. The trajectory
of geopolitics will shape these trends and the global business environment across aerospace and defense (A&D), and
SAF in the next five years is uncertain.
We highlight four geopolitical scenarios, the economic outcome and their impact on SAF adoption:
Geopolitical scenario outlooks
Probability of outcome (%) based on EY SAF Survey 2022 Loose Isolationism 5% Open environment 14% alliances
Macro impact: Trade significantly reduced for most
Macro impact: Favorable open market
companies and more mature firms drive sector
encourages global technology sharing and
activity and development due to lack of capital cooperation across sectors
SAF impact: SAF development benefits due to
SAF impact: SAF development positively impacted
growing pressure for energy self-sufficiency;
through expanded economic opportunities and
however, operations limited to domestic market
global cooperation on supporting infrastructure Geopolitical relations Cold War II 29% Status quo 52%
Macro impact: Priority placed on development
Macro impact: Global environment facilitates some
of “strategic industries“ tied to security and
international cooperation, with priority being placed
cooperation strictly limited to allied blocs on allied blocs
SAF impact: Sustainability initiatives de-prioritized
SAF impact: SAF development continues along
relative to security, with global SAF cooperation and
current trajectory, with growth aligned to broader
infrastructure severely limited to blocs aviation sector trends Distinct blocs Nationalist competition Economic policy stance
Internationalist liberalization Source: EY analysis 11 SAF on the rise
While recent shocks have created momentum toward a Cold War II scenario, events in the near and medium term could shift
the trajectory toward another scenario. Open environment scenario, with a lower probability of occurrence, would be the
most preferable for SAF development.
Here, we take a closer look at the four scenarios and their impact on SAF through a variety of prisms. What is the
investor viewpoint on SAF? How does SAF influence sustainability if countries choose isolationism? What effect does
SAF have on jobs and how does the outcome shift in open environment versus Cold War II? Here’s our analysis of how things could play out.
Tài liệu liên quan:
-

300 câu trắc nghiệm english theo chủ đề -Trường đại học Văn Lang
470 235 -
Lesson 3 Writing Task 0 - English | Đại học Văn Lang
326 163 -
Production Plan - English | Đại học Văn Lang
281 141 -
Template Writing assignment 2 - English ( EIIGH) | Đại học Văn Lang
357 179 -
Template Writing assignment - Đại học Văn Lang
440 220