Focus Notes: Key Concepts & Analysis Techniques | Môn Investment Banking - Trường Đại học Quốc tế, Đại học Quốc gia Thành phố Hồ Chí Minh
Focus Notes: Key Concepts & Analysis Techniques Môn Investment Banking. Tài liệu được sưu tầm gồm 27 trang, giúp bạn ôn tập tốt hơn. Mời các bạn đón xem.
Môn: Investment Banking 7 tài liệu
Trường: Trường Đại học Quốc tế, Đại học Quốc gia Thành phố Hồ Chí Minh 2 K tài liệu
Tác giả:


Preview text:
lOMoAR cPSD| 58562220
Investment Banking Focus Notes JOSHUA ROSENBAUM JOSHUA PEARL Copyright ©
by Joshua Rosenbaum and Joshua Pearl. All rights reserved.
Published by John Wiley & Sons, Inc., Hoboken, New Jersey.
Published simultaneously in Canada.
No part of this publication may be reproduced, stored in a retrieval system, or transmitted in any form or by any means, electronic, mechanical, photocopying,
recording, scanning, or otherwise, except as permitted under Section 107 or 108 of the 1976 United States Copyright Act, without either the prior written
permission of the Publisher, or authorization through payment of the appropriate per-copy fee to the Copyright Clearance Center, Inc., 222 Rosewood Drive,
Danvers, MA 01923, (978) 750-8400, fax (978) 646-8600, or on the Web at www.copyright.com. Requests to the Publisher for permission should be addressed
to the Permissions Department, John Wiley & Sons, Inc., 111 River Street, Hoboken, NJ 07030, (201) 748-6011, fax (201) 748-6008, or online at
http://www.wiley.com/go/permissions.
Limit of Liability/Disclaimer of Warranty: While the publisher and author have used their best efforts in preparing this book, they make no representations or
warranties with respect to the accuracy or completeness of the contents of this book and specifically disclaim any implied warranties of merchantability or
fitness for a particular purpose. No warranty may be created or extended by sales representatives or written sales materials. The advice and strategies contained
herein may not be suitable for your situation. You should consult with a professional where appropriate. Neither the publisher nor author shall be liable for any
loss of profit or any other commercial damages, including but not limited to special, incidental, consequential, or other damages.
For general information on our other products and services or for technical support, please contact our Customer Care Department within the United States at
(800) 762-2974, outside the United States at (317) 572-3993 or fax (317) 572-4002. lOMoAR cPSD| 58562220
Wiley also publishes its books in a variety of electronic formats. Some content that appears in print may not be available in electronic books. For more
information about Wiley products, visit our web site at www.wiley.com.
ISBN 978-1-118-58608-2 (Paperback); ISBN 978-1-118-71084-5 (ePDF); ISBN 978-1-118-71093-7 (ePub)
Printed in the United States of America 10 9 8 7 6 5 4 3 2 1 Contents About the Authors vii Introduction viii
Chapter 1: Comparable Companies Analysis 8
Overview of Comparable Companies Analysis 3
Step I: Select the Universe of Comparable Companies 4
Step II: Locate the Necessary Financial Information 8 lOMoAR cPSD| 58562220
Step III: Spread Key Statistics, Ratios, and Trading Multiples 9
Step IV: Benchmark the Comparable Companies 27 Step V: Determine Valuation 33 Key Pros and Cons 38
Chapter 2: Precedent Transactions Analysis 39
Overview of Precedent Transactions Analysis 41
Step I. Select the Universe of Comparable Acquisitions 42
Step II. Locate the Necessary Deal-Related and Financial Information 46 iii lOMoAR cPSD| 58562220
Step III. Spread Key Statistics, Ratios, and Transaction Multiples 49
Step IV. Benchmark the Comparable Acquisitions 64 Step V. Determine Valuation 66 Key Pros and Cons 67
Chapter 3: Discounted Cash Flow Analysis 69
Overview of Discounted Cash Flow Analysis 71
Step I. Study the Target and Determine Key Performance Drivers Step II. 73 Project Free Cash Flow 75
Step III. Calculate Weighted Average Cost of Capital 91 106
Step IV. Determine Terminal Value 112
Step V. Calculate Present Value and Determine Valuation Key Pros 118 and Cons 119
Chapter 4: Leveraged Buyouts 121 Overview of Leveraged Buyouts 122 Key Participants 127
Characteristics of a Strong LBO Candidate Economics of 132 LBOs lOMoAR cPSD| 58562220 iv lOMoAR cPSD| 58562220 v lOMoAR cPSD| 58562220 Organization and Preparation 209 First Round 218 Second Round 229 Negotiations 236 Closing 241 Negotiated Sale 246
Chapter 7: Buy-Side M&A 247 Overview of Buy-Side M&A 248 Buyer Motivation 250
Acquisition Strategies 254 Form of Financing 259 Deal Structure 264 Buy-Side Valuation 273 Merger Consequences Analysis 278 Index 295 vi Introduction lOMoAR cPSD| 58562220
Investment Banking: FOCUS NOTES provides a comprehensive, yet streamlined, review of the basic skills and concepts discussed
in Investment Banking: Valuation, Leveraged Buyouts, and Mergers & Acquisitions, Second Edition. The focus notes are
designed for use both as a companion to the main book, as well as on a standalone basis. The Investment Banking suite of products,
including the primary hardcover text, valuation models, workbook and focus notes, is centered on the primary valuation
methodologies currently used on Wall Street—namely, comparable companies analysis, precedent transactions analysis, discounted
cash flow (DCF) analysis, and leveraged buyout (LBO) analysis—as well as detailed mergers & acquisitions (M&A) analysis from
both a sell-side and buy-side perspective.
FOCUS NOTES seek to help solidify knowledge of these core financial topics as true mastery must be tested, honed, and
retested over time. It is the ultimate self-help tool for students, job seekers, and existing finance professionals, as well as in formal
classroom and training settings.
FOCUS NOTES is designed to optimize mastering the critical financial tools discussed in Investment Banking, Second Edition
and therefore corresponds to its chapters, as shown below:
◾ Chapter 1: Comparable Companies Analysis
◾ Chapter 2: Precedent Transactions Analysis
◾ Chapter 3: Discounted Cash Flow Analysis
◾ Chapter 4: Leveraged Buyouts ◾ Chapter 5: LBO Analysis
◾ Chapter 6: Sell-Side M&A
◾ Chapter 7: Buy-Side M&A lOMoAR cPSD| 58562220 Chapter 1
Comparable Companies Analysis lOMoAR cPSD| 58562220
Comparable Companies Analysis Steps Step I.
Select the Universe of Comparable Companies
Step II. Locate the Necessary Financial Information
Step III. Spread Key Statistics, Ratios, and Trading Multiples
Step IV. Benchmark the Comparable Companies Step V. Determine Valuation Focus on lOMoAR cPSD| 58562220
Overview of Comparable Companies Analysis
◾ Provides a market benchmark against which a banker can establish valuation for private company or analyze the value of
public company at given point in time
◾ Built upon premise that similar companies provide highly relevant reference point for valuing a target company – Share
key business and financial characteristics, performance drivers, and risks
– Valuation parameters can be established for the target by determining relative positioning among peers
◾ Broad range of applications, most notably for various M&A situations, IPOs, restructurings, and investment decisions
◾ Selecting universe of comparable companies for target is core of analysis
– Peers are benchmarked against each another and the target based on various financial statistics and ratios
– Valuation multiples utilize a measure of value in numerator and operating metric in denominator
◾ Designed to reflect “current” valuation based on prevailing market conditions and sentiment
– Market trading levels may be subject to periods of irrational investor sentiment that skew valuation either too high or too low
– No two companies are exactly the same
– May fail to accurately capture a given company’s true value lOMoAR cPSD| 58562220
Step I: Select the Universe of Comparable Companies Study the Target
◾ Process of learning the in-depth “story” of target should be exhaustive
◾ Read and study as much company- and sector- specific material as possible Public Targets Private Targets
◾ Annual (10-K) and quarterly (10-Q) SEC
◾ Greater challenge to locate information filings (unless company has public debt)
◾ Consensus research estimates
◾ Corporate websites, sector research
reports, news runs, and trade journals
◾ Equity and fixed income research reports Focus on lOMoAR cPSD| 58562220
◾ Press releases, earnings call transcripts,
◾ Public competitors’ SEC filings, research investor presentations, and corporate
reports, and investor presentations websites
◾ Banker is provided with detailed business
and financial information in organized M&A sale process
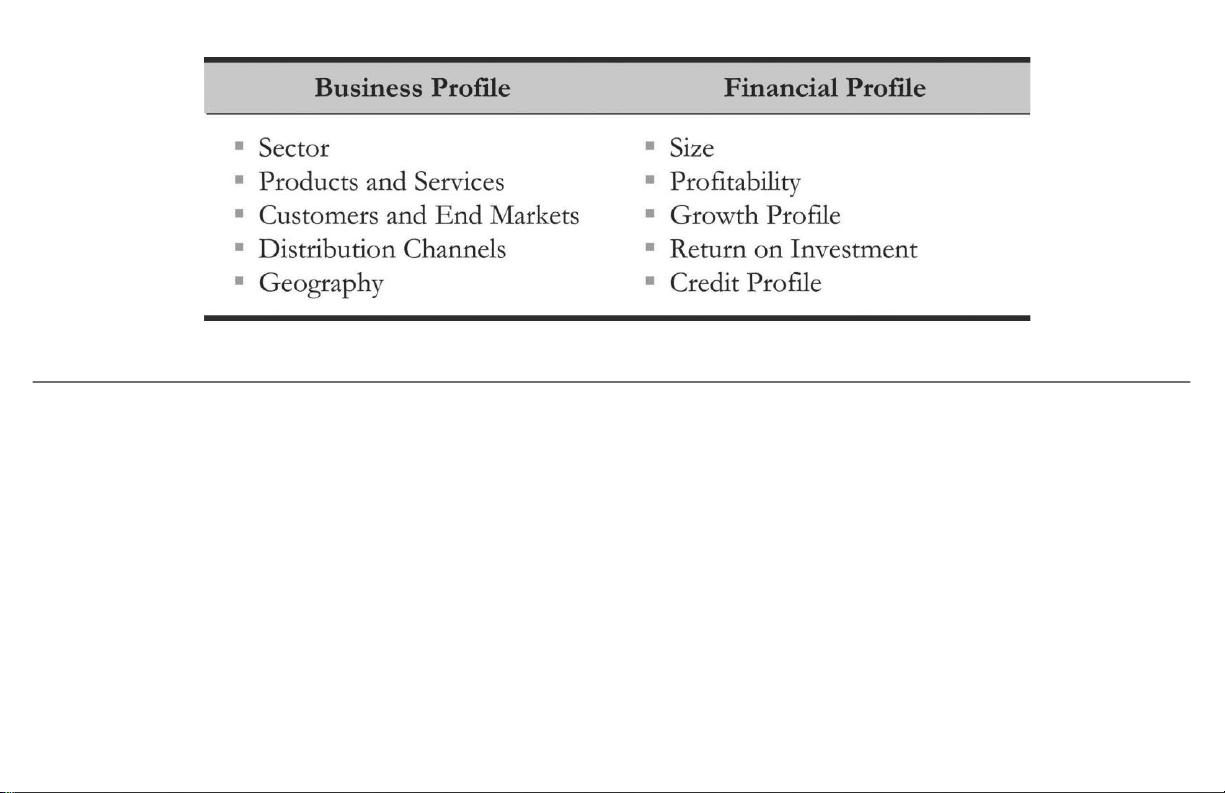
Step I: Select the Universe of Comparable Companies
Identify Key Characteristics of the Target for Comparison Purposes
Business and Financial Profile Framework lOMoAR cPSD| 58562220
Step I: Select the Universe of Comparable Companies
Screen for Comparable Companies
◾ Begin screen after target’s basic business and financial characteristics are researched and understood
◾ Examination of target’s public competitors is usually best place to begin
◾ Competitors share key business and financial characteristics and are susceptible to similar opportunities and risks – Focus
on identifying companies with similar business profile
– More detailed financial benchmarking is performed in Step IV lOMoAR cPSD| 58562220 ◾ Sources
– 10-Ks, annual proxy statement, investor presentations, and credit rating agencies reports (e.g., Moody’s, S&P, and Fitch)
– Equity research reports, especially initiating coverage reports
– Excerpts from fairness opinion contained in proxy statement for recent M&A transaction
– Bloomberg Industry Classification Standard (“BICS”) codes
◾ Potential to tier selected companies by size, business focus, or geography
◾ Difficult to locate “pure” comparable companies
◾ Often as much “art” as “science” Focus on lOMoAR cPSD| 58562220
Step II: Locate the Necessary Financial Information
◾ Valuation is driven on basis of both historical performance (e.g., last twelve months (LTM) financial data) and expected
future performance (e.g., consensus estimates for future calendar years)
◾ SEC Filings – Historical Financials
– Used as source for historical financial information (both annual and LTM), balance sheet data, basic shares outstanding,
stock options/warrants data, and information on non-recurring items
– 10-K (Annual Report) – annual audited report, provides comprehensive overview of company and prior year performance
– 10-Q (Quarterly Report) – quarterly unaudited report, provides overview of most recent quarter and year-todate (YTD) period
– 8-K (Current Report) – reports occurrence of material corporate events or changes (“triggering event”)
– Proxy Statement – contains material information regarding matters shareholders are expected to vote on
◾ Equity Research – Estimates
– Research reports – provide individual analyst estimates of future company performance and include estimates of sales,
EBITDA and/or EBIT, and EPS for future quarters and future two- or three-year period
– Initiating coverage research reports are more comprehensive
– Consensus estimates (e.g., Bloomberg) are used as basis for calculating forward-looking trading multiples in trading comps lOMoAR cPSD| 58562220
Step III: Spread Key Statistics, Ratios, and Trading Multiples
Step II: Locate the Necessary Financial Information (continued)
◾ Press Releases and News Runs
– News of earnings announcements, declaration of dividends, management changes, and M&A and capital markets transactions
◾ Financial Information Services (e.g., Bloomberg)
– Key source for obtaining SEC filings, research reports, consensus estimates, and press releases lOMoAR cPSD| 58562220 Focus on
◾ Once the necessary financial information for each of the comparables has been located, it is entered into an input page.
◾ The input page data, in turn, feeds into output sheets that are used to benchmark the comparables. Input Sheet Output Sheets
◾ Enter a company’s financial data into an input
◾ Summary of key financial data for each page comparable company
◾ Feeds into summary output sheets used to ◾ Data is
presented in clear and succinct format for benchmark the comparables easy comparison
◾ Designed to assist in calculating the key financial ◾
Serves as basis for identifying, analyzing and statistics,
ratios, and multiples for comparing comparable
companies the comparables universe lOMoAR cPSD| 58562220
Step III: Spread Key Statistics, Ratios, and Trading Multiples
Calculation of Key Financial Statistics and Ratios
◾ Market Valuation: equity value and enterprise value Size
◾ Key Financial Data: sales, gross profit, EBITDA, EBIT, and net income Profitability
◾ Gross profit, EBITDA, EBIT, and net income margins Growth Profile
◾ Historical and estimated growth rates Return on
◾ ROIC, ROE, ROA, and dividend yield Investment lOMoAR cPSD| 58562220
Step III: Spread Key Statistics, Ratios, and Trading Multiples Credit Profile
◾ Leverage ratios, coverage ratios, and credit ratings Focus on
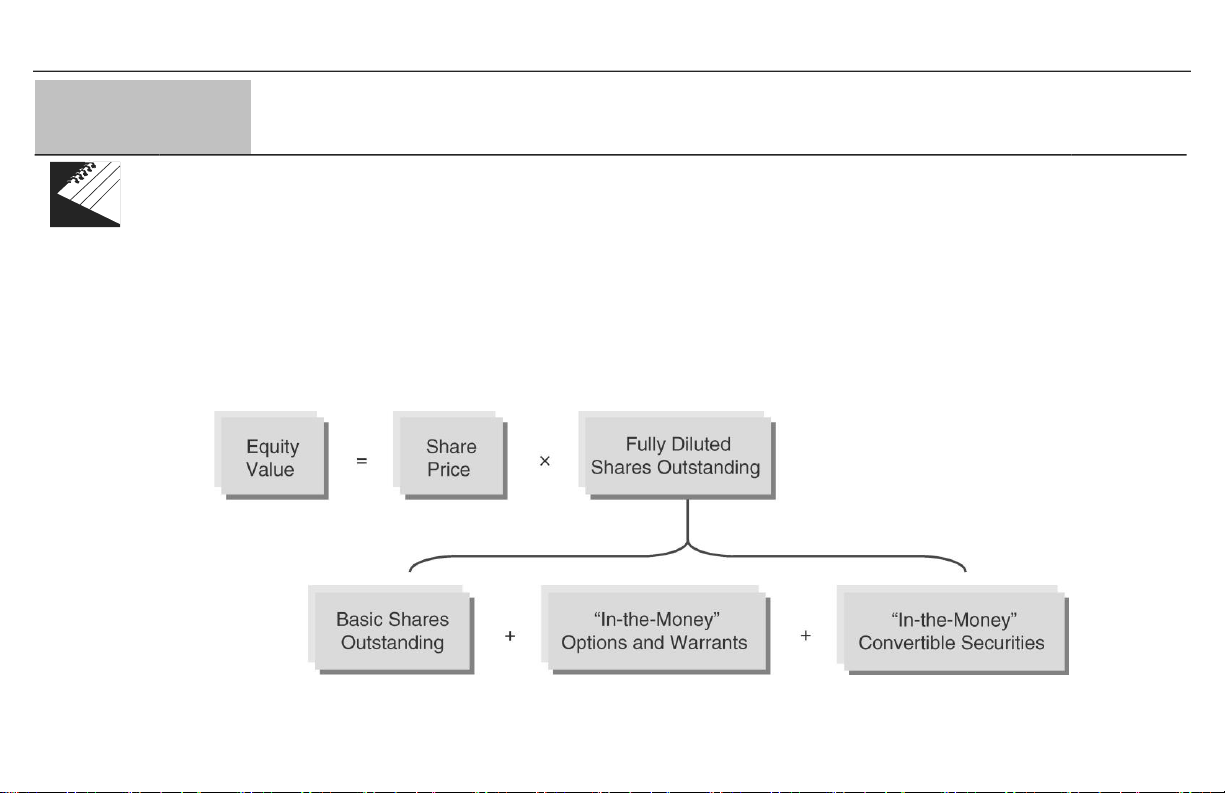
Size: Market Valuation
◾ Equity Value (“market capitalization”)
– Value represented by company’s basic shares outstanding plus “in-the-money” stock options, warrants, and convertible
securities—collectively, “fully diluted shares outstanding”
– Calculated by multiplying company’s current share price by fully diluted shares outstanding
Tài liệu liên quan:
-
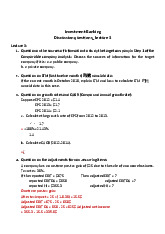
Discussion Questions Lecture 3 | Môn Investment Banking - Trường Đại học Quốc tế, Đại học Quốc gia Thành phố Hồ Chí Minh
95 48 -

Law on Credit instituion | Môn Investment Banking - Trường Đại học Quốc tế, Đại học Quốc gia Thành phố Hồ Chí Minh
80 40 -
Cost of Equity Calculation | Môn Investment Banking - Trường Đại học Quốc tế, Đại học Quốc gia Thành phố Hồ Chí Minh
83 42 -
Portfolio Risk and Return Part II - Exam Questions and Answers | Môn Investment Banking - Trường Đại học Quốc tế, Đại học Quốc gia Thành phố Hồ Chí Minh
87 44