Portfolio Risk and Return Part II - Exam Questions and Answers | Môn Investment Banking - Trường Đại học Quốc tế, Đại học Quốc gia Thành phố Hồ Chí Minh
Portfolio Risk and Return Part II - Exam Questions and Answers Môn Investment Banking. Tài liệu được sưu tầm gồm 43 trang, giúp bạn ôn tập tốt hơn. Mời các bạn đón xem.
Môn: Investment Banking 7 tài liệu
Trường: Trường Đại học Quốc tế, Đại học Quốc gia Thành phố Hồ Chí Minh 2 K tài liệu
Tác giả:


Preview text:
lOMoAR cPSD| 58562220 Question #1 of 92 Question ID: 1573227
Which of the following terms refer to the same type of risk?
A) Systematic risk and rm-speci c risk.
B) Total risk and the variance of returns.
C) Undiversi able risk and unsystematic risk. Explanation
Variance is a measure of total risk. (Module 21.1, LOS 21.c) Question #2 of 92 Question ID: 1573251
Portfolios that plot on the security market line in equilibrium: A) must be well diversi ed.
B) may be concentrated in only a few stocks.
C) have only systematic (beta) risk. Explanation
According to the capital asset pricing model, in equilibrium all securities and portfolios plot on the SML. A
security or portfolio is not priced in equilibrium if it plots above the SML (i.e., is undervalued) or below
the SML (i.e., is overvalued). (Module 21.2, LOS 21.f) Question #3 of 92 Question ID: 1573207
Portfolios on the capital market line:
A) include some positive allocation to the risk-free asset.
B) each contain di erent risky assets.
C) are perfectly positively correlated with each other. Explanation lOMoAR cPSD| 58562220
The introduction of a risk-free asset changes the Markowitz efficient frontier into a straight line. This
straight efficient frontier line is called the capital market line (CML). Since the line is straight, the math
implies that the returns on any two portfolios on this line will be perfectly, positively correlated with each = W s + W s
other. Note: When ra,b = 1, then the equation for risk changes to sport A A B B, which is a straight
line. The risky assets for each portfolio on the CML are the same, the tangency (or market) portfolio of
risky assets. The CML includes lending portfolios with positive allocations to the risk-free asset, the market
portfolio with no allocation to the risk-free asset, and borrowing portfolios with negative allocations to the risk-free asset. (Module 21.1, LOS 21.b) Question #4 of 92 Question ID: 1573242
The slope of the characteristic line is used to estimate: A) risk aversion. B) a risk premium. C) beta. Explanation
Beta for an individual security can be estimated by the slope of its characteristic line, a least-squares
regression of the security's excess returns against the market's excess returns. (Module 21.1, LOS 21.e) Question #5 of 92 Question ID: 1573203
James Franklin, CFA, has high risk tolerance and seeks high returns. Based on capital market
theory, Franklin would most appropriately hold:
a high-beta portfolio of risky assets nanced in part by borrowing at the riskA) free rate.
B) a high risk biotech stock, as it will have high expected returns in equilibrium.
C) the market portfolio as his only risky asset. Explanation
According to capital market theory, all investors will choose a combination of the market portfolio and
borrowing or lending at the risk-free rate; that is, a portfolio on the CML. (Module 21.1, LOS 21.a) lOMoAR cPSD| 58562220 Question #6 of 92 Question ID: 1573238
The expected rate of return is twice the 12% expected rate of return from the market. What is the beta if the risk-free rate is 6%? A) 2. B) 3. C) 4. Explanation 24 = 6 + β (12 – 6) 18 = 6β β = 3 (Module 21.1, LOS 21.e) Question #7 of 92 Question ID: 1573214
What is the risk measure associated with the CML? A) Beta. B) Market risk. C) Standard deviation. Explanation
In the context of the CML, the measure of risk (x-axis) is total risk, or standard deviation. Beta (systematic
risk) is used to measure risk for the security market line (SML). (Module 21.1, LOS 21.b) Question #8 of 92 Question ID: 1573225
Which type of risk is positively related to expected excess returns according to the CAPM? A) Systematic. B) Unique. C) Diversi able. Explanation lOMoAR cPSD| 58562220
The CAPM concludes that expected returns are a positive (linear) function of systematic risk. (Module 21.1, LOS 21.c) Question #9 of 92 Question ID: 1573213
In the context of the CML, the market portfolio includes:
A) 12-18 stocks needed to provide maximum diversi cation. B) all existing risky assets. C) the risk-free asset. Explanation
The market portfolio has to contain all the stocks, bonds, and risky assets in existence. Because this
portfolio has all risky assets in it, it represents the ultimate or completely diversified portfolio. (Module 21.1, LOS 21.b) Question #10 of 92 Question ID: 1573222
Which of the following statements about risk is NOT correct?
A) The market portfolio has only systematic risk.
B) Total risk = systematic risk - unsystematic risk.
C) Unsystematic risk is diversi able risk. Explanation
Total risk = systematic risk + unsystematic risk (Module 21.1, LOS 21.c) Question #11 of 92 Question ID: 1573277 lOMoAR cPSD| 58562220
An investor believes Stock M will rise from a current price of $20 per share to a price of $26 per share
over the next year. The company is not expected to pay a dividend. The following information pertains: RF = 8% ERM = 16% Beta = 1.7
Should the investor purchase the stock?
A) No, because it is overvalued.
B) No, because it is undervalued.
C) Yes, because it is undervalued. Explanation
In the context of the SML, a security is underpriced if the required return is less than the holding period
(or expected) return, is overpriced if the required return is greater the holding period (or expected)
return, and is correctly priced if the required return equals the holding period (or expected) return.
Here, the holding period (or expected) return is calculated as: (ending price – beginning price + any cash
flows/dividends) / beginning price. The required return uses the equation of the SML: risk free rate + Beta
× (expected market rate − risk free rate).
ER = (26 – 20) / 20 = 0.30 or 30%, RR = 8 + (16 – 8) × 1.7 = 21.6%. The stock is underpriced therefore purchase. (Module 21.2, LOS 21.h)
Question #12 of 92 Question ID: 1573211 Portfolios that represent combinations of the risk-free
asset and the market portfolio are plotted on the: A) utility curve.
B) capital asset pricing line. C) capital market line. Explanation
The introduction of a risk-free asset changes the Markowitz efficient frontier into a straight line. This straight
efficient frontier line is called the capital market line (CML). Investors at point Rf have 100% of their funds
invested in the risk-free asset. Investors at point M have 100% of their funds invested in market portfolio M.
Between Rf and M, investors hold both the risk-free asset and portfolio M. To the right of M, investors hold lOMoAR cPSD| 58562220
more than 100% of portfolio M. All investors have to do to get the risk and return combination that suits them
is to simply vary the proportion of their investment in the risky portfolio M and the riskfree asset.
Utility curves reflect individual preferences. (Module 21.1, LOS 21.b) Question #13 of 92 Question ID: 1573286
Which of the following statements regarding the Sharpe ratio is most accurate? The Sharpe ratio measures:
A) excess return per unit of risk.
B) peakedness of a return distribution.
C) total return per unit of risk. Explanation
The Sharpe ratio measures excess return per unit of risk. Remember that the numerator of the Sharpe
ratio is (portfolio return – risk free rate), hence the importance of excess return. Note that peakedness of
a return distribution is measured by kurtosis. (Module 21.2, LOS 21.i)
Question #14 of 92 Question ID: 1573241 The expected rate of return is 1.5 times the 16%
expected rate of return from the market.
What is the beta if the risk free rate is 8%? A) 2. B) 3. C) 4. Explanation 24 = 8 + β (16 – 8) 24 = 8 + 8β 16 = 8β 16 / 8 = β β = 2 lOMoAR cPSD| 58562220 (Module 21.1, LOS 21.e) Question #15 of 92 Question ID: 1573201
A plot of the expected returns and standard deviations of each possible portfolio that combines a risky
asset and a risk-free asset will be:
A) a curve that approaches an upper limit. B) convex to the origin. C) a straight line. Explanation
The possible portfolios of a risky asset and a risk-free asset have a linear relationship between expected
return and standard deviation. (Module 21.1, LOS 21.a) Question #16 of 92 Question ID: 1573250
One of the assumptions underlying the capital asset pricing model is that: A) there are no transactions costs or taxes.
B) only whole shares or whole bonds are available.
C) each investor has a unique time horizon. Explanation
The CAPM assumes frictionless markets, i.e., no taxes or transactions costs. Among the other assumptions
of the CAPM are that all investors have the same one-period time horizon and that all investments are infinitely divisible. (Module 21.2, LOS 21.f) Question #17 of 92 Question ID: 1573274 lOMoAR cPSD| 58562220
The stock of Mia Shoes is currently trading at $15 per share, and the stock of Video Systems is currently
trading at $18 per share. An analyst expects the prices of both stocks to increase by $2 over the next year
and neither company pays dividends. Mia Shoes has a beta of 0.9 and Video Systems has a beta of (-0.3).
If the expected market return is 15% and the risk-free rate is 8%, which trading strategy does the CAPM
indicate for these two stocks? Mia Shoes Video Systems A) Buy Buy B) Buy Sell C) Sell Buy Explanation
The required return for Mia Shoes is 0.08 + 0.9 × (0.15-0.08) = 14.3%. The forecast return is $2/$15 =
13.3%. The stock is overvalued and the investor should sell it. The required return for Video Systems is
0.08 - 0.3 × (0.15-0.08) = 5.9%. The forecast return is $2/$18 =
11.1%. The stock is undervalued and the investor should buy it. (Module 21.2, LOS 21.h) Question #18 of 92 Question ID: 1573267
Which of the following statements about the security market line (SML) is least accurate?
The independent variable in the SML equation is the standard deviation of the A) market portfolio.
B) Securities plotting above the SML are undervalued.
The SML measures risk using the standardized covariance of the stock with the C) market. Explanation
The SML uses either the covariance between assets and the market or beta as the measure of risk. Beta is
the covariance of a stock with the market divided by the variance of the market. Securities that plot above
the SML are undervalued and securities that plot below the SML are overvalued. (Module 21.2, LOS 21.h) lOMoAR cPSD| 58562220 Question #19 of 92 Question ID: 1573289
Over a sample period, an investor gathers the following data about three mutual funds. Mutual Fund Portfolio Return Portfolio Standard Deviation Portfolio Beta P 13% 18% 1.2 Q 15% 20% 1.4 R 18% 24% 1.8
The risk-free rate is 5%. Based solely on the Sharpe measure, an investor would prefer: A) Fund P. B) Fund R. C) Fund Q. Explanation
The Sharpe measure for a portfolio is calculated as the (mean portfolio return − mean return on the risk-
free asset)/portfolio standard deviation. The Sharpe measures for the three mutual funds are:
mutual fund P = (13 − 5) / 18 = 0.44 mutual fund
Q = (15 − 5) / 20 = 0.50 mutual fund R = (18 − 5) / 24 = 0.54
Assuming that investors prefer return and dislike risk, they should prefer portfolios with large Sharpe
ratios to those with smaller ratios. Thus, the investor should prefer mutual fund R. (Module 21.2, LOS 21.i) Question #20 of 92 Question ID: 1573290
An investor's wealth is approximately 50% in bonds and broad-based equities and 50% in shares of a
company she founded. Which of the following measures of risk-adjusted returns is least appropriate for this investor's portfolio? A) M-squared. B) Sharpe ratio. C) Jensen’s alpha. Explanation
Jensen's alpha is based on systematic risk and is not appropriate for a portfolio with a 50% concentration
in a single entity (i.e., not well diversified). Both the Sharpe ratio and the Msquared measure are based on
total portfolio risk and are appropriate for a portfolio that is not well diversified. (Module 21.2, LOS 21.i) lOMoAR cPSD| 58562220 Question #21 of 92 Question ID: 1573265
Given the following information, what is the required rate of return on Bin Co? inflation premium = 3% real risk-free rate = 2% Bin Co. beta = 1.3 market risk premium = 4% A) 10.2%. B) 16.7%. C) 7.6%. Explanation
Use the capital asset pricing model (CAPM) to find the required rate of return. The approximate risk-free
rate of interest is 5% (2% real risk-free rate + 3% inflation premium). k = 5% + 1.3(4%) = 10.2%. (Module 21.2, LOS 21.g) Question #22 of 92 Question ID: 1573262
What is the expected rate of return on a stock that has a beta of 1.4 if the market risk premium is 9% and the risk-free rate is 4%? A) 13.0%. B) 16.6%. C) 11.0%. Explanation
Using the security market line (SML) equation: 4% + 1.4(9%) = 16.6%. (Module 21.2, LOS 21.g) lOMoAR cPSD| 58562220
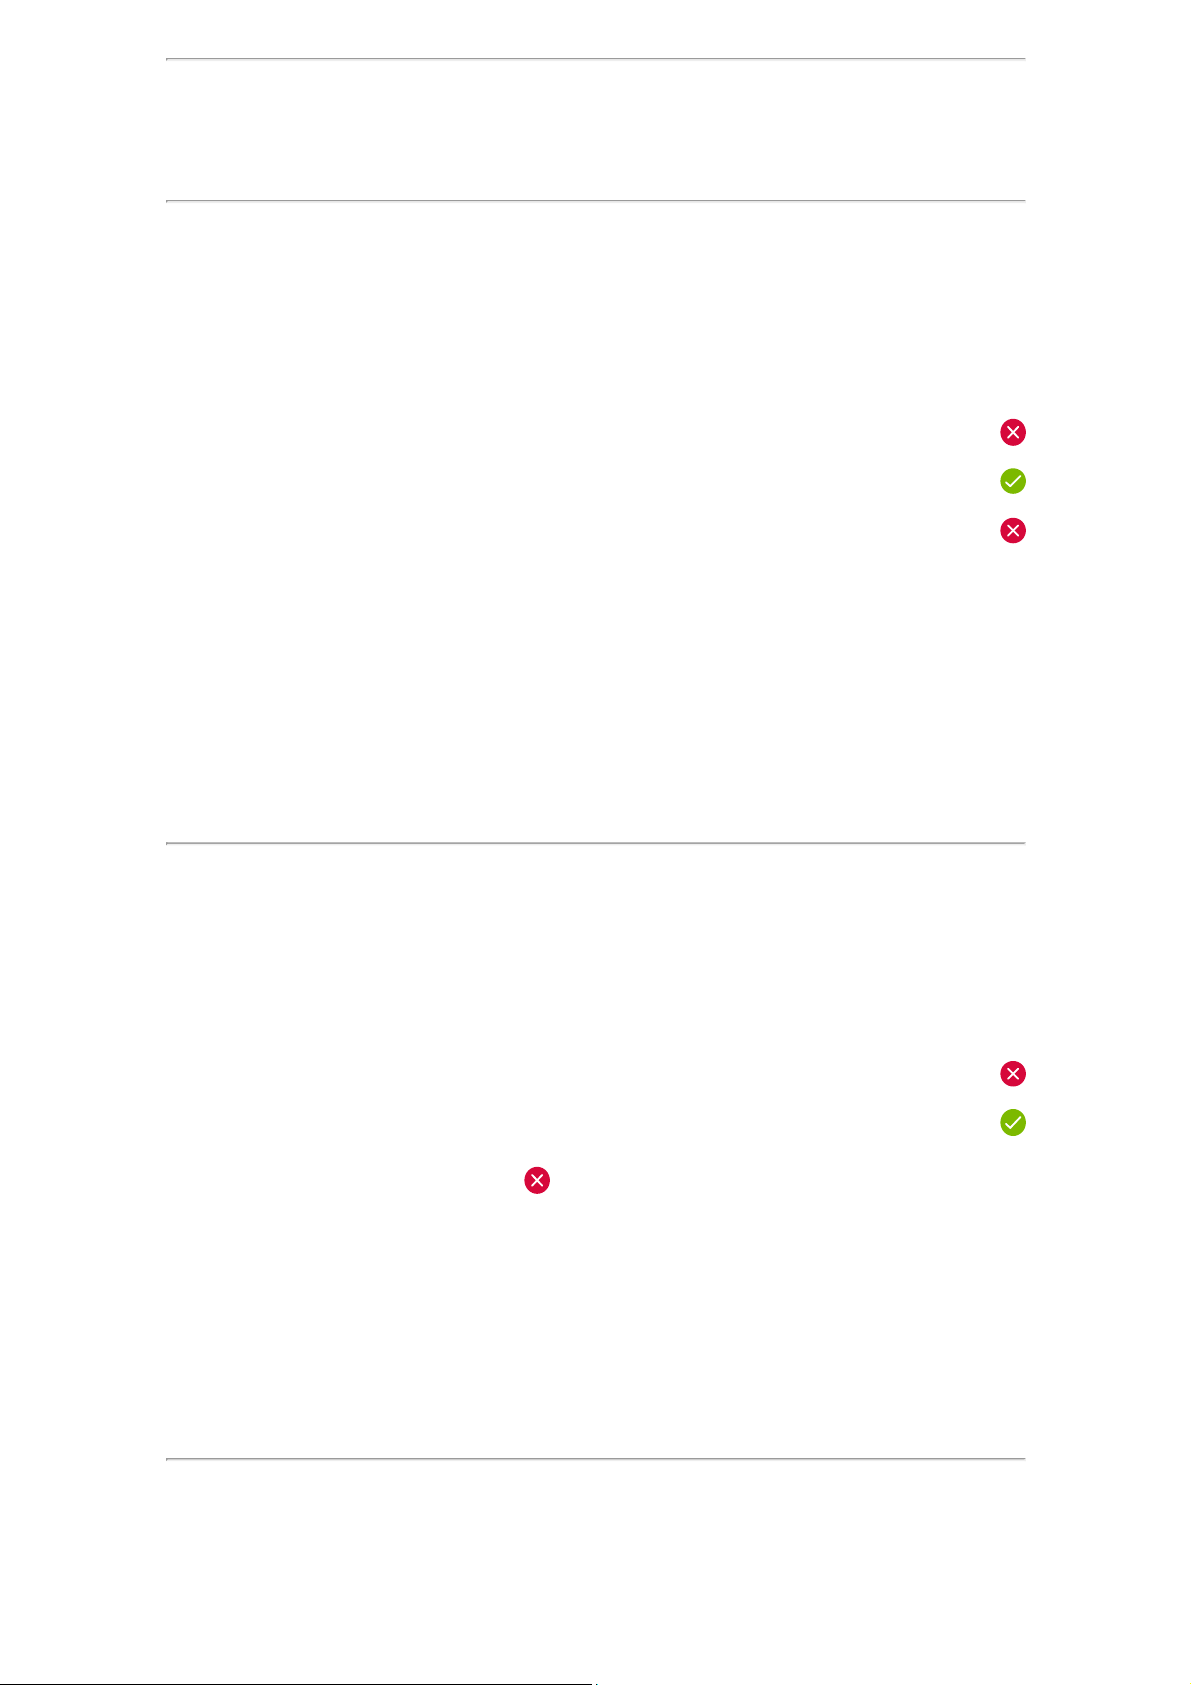
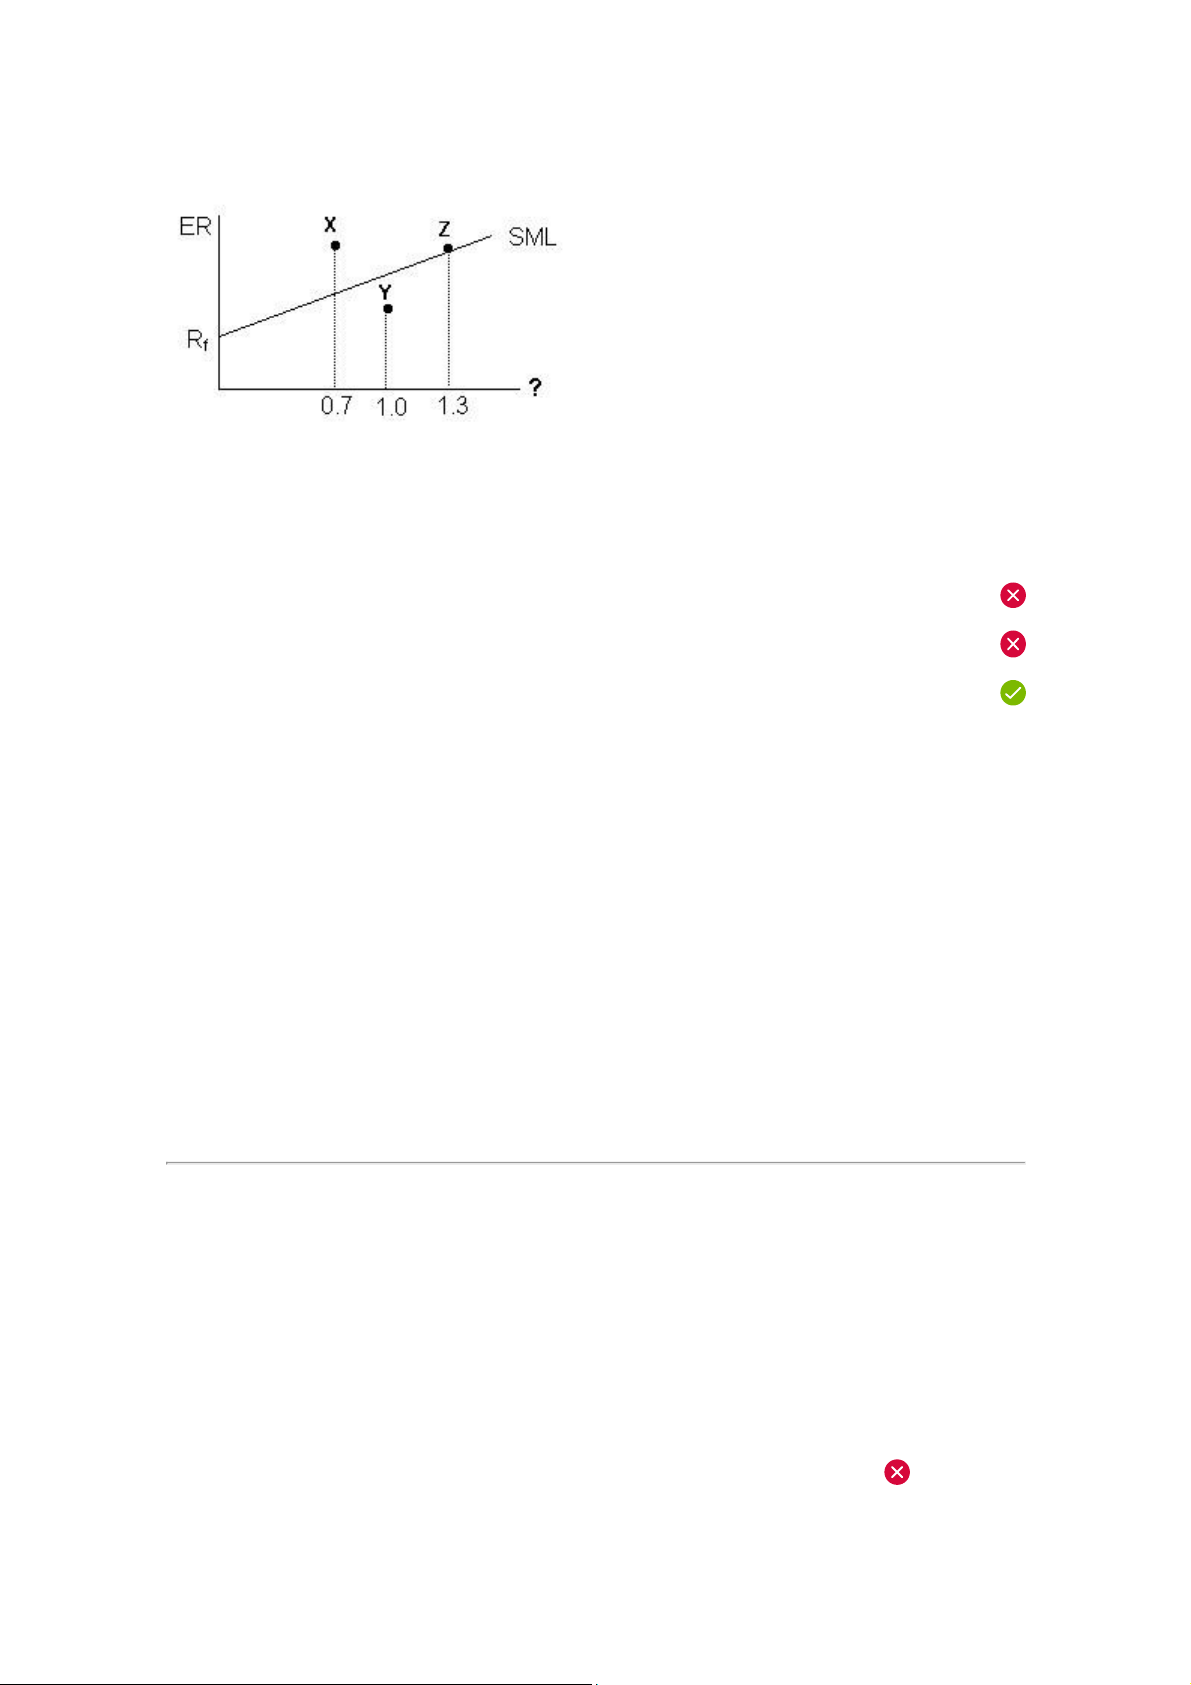
Question #23 of 92 Question ID: 1573275 Consider the following graph of the Security Market Line
(SML). The letters X, Y, and Z represent risky asset portfolios and an analyst's forecast for their returns over
the next period. The SML crosses the y-axis at 0.07.
The expected market return is 13.0%.
Using the graph above and the information provided, the analyst most likely believes that:
A) Portfolio X's required return is greater than its forecast return.
B) Portfolio Y is undervalued.
C) the expected return for Portfolio Z is 14.8%. Explanation
Portfolio Z has a beta of 1.3 and its required return can be calculated as 7.0% + 1.3 × (13.0% − 7.0%) =
14.8%. Because it plots on the SML, its expected (forecast) return and required return are equal.
The SML plots beta (systematic risk) versus expected equilibrium (required) return. The analyst believes
that Portfolio Y is overvalued – any portfolio located below the SML has a forecast return less than its
required return and is overpriced in the market. Since
Portfolio X plots above the SML, it is undervalued and the statement should read,
"Portfolio X's required return is less than its forecast return." (Module 21.2, LOS 21.h) Question #24 of 92 Question ID: 1573202
When a risk-free asset is combined with a portfolio of risky assets, which of the following is least accurate?
The expected return for the newly created portfolio is the weighted average of
A) the return on the risk-free asset and the expected return on the risky asset portfolio.
The standard deviation of the return for the newly created portfolio is the lOMoAR cPSD| 58562220
B) standard deviation of the returns of the risky asset portfolio multiplied by its portfolio weight.
The variance of the resulting portfolio is a weighted average of the returns C) variances of
the risk-free asset and of the portfolio of risky assets. Explanation
This statement is not correct; the standard deviation of returns for the resulting portfolio is a weighted
average of the returns standard deviation of the risk-free asset (zero) and the returns standard deviation of the risky-asset portfolio. (Module 21.1, LOS 21.a) Question #25 of 92 Question ID: 1573268
The following information is available for the stock of Park Street Holdings:
The price today (P0) equals $45.00.
The expected price in one year (P1) is $55.00. The stock's beta is 2.31.
The firm typically pays no dividend.
The 3-month Treasury bill is yielding 4.25%.
The historical average S&P 500 return is 12.5%.
Park Street Holdings stock is:
A) undervalued by 1.1%. B) undervalued by 3.7%. C) overvalued by 1.1%. Explanation
To determine whether a stock is overvalued or undervalued, we need to compare the expected return (or
holding period return) and the required return (from Capital Asset Pricing Model, or CAPM).
Step 1: Calculate Expected Return (Holding period return):
The formula for the (one-year) holding period return is:
HPR = (D1 + S1 – S0) / S0, where D = dividend and S = stock price.
Here, HPR = (0 + 55 – 45) / 45 = 22.2%
Step 2: Calculate Required Return:
The formula for the required return is from the CAPM:
RR = Rf + (ERM – Rf) × Beta lOMoAR cPSD| 58562220
RR = 4.25% + (12.5 – 4.25%) × 2.31 = 23.3%.
Step 3: Determine over/under valuation:
The required return is greater than the expected return, so the security is overvalued.
The amount = 23.3% – 22.2% = 1.1%. (Module 21.2, LOS 21.h) Question #26 of 92 Question ID: 1573264
Given a beta of 1.25 and a risk-free rate of 6%, what is the expected rate of return assuming a 12% market return? A) 31%. B) 10%. C) 13.5%. Explanation
ki = Rf + βi(RM – Rf) k = 6% + 1.25(12% – 6%) = 13.5% (Module 21.2, LOS 21.g) Question #27 of 92 Question ID: 1573288
A higher Sharpe ratio indicates:
A) a higher excess return per unit of risk.
B) a lower risk per unit of return.
C) lower volatility of returns. Explanation
The Sharpe ratio is excess return (return – Rf) per unit of risk (defined as the standard deviation of returns). (Module 21.2, LOS 21.i) lOMoAR cPSD| 58562220 Question #28 of 92 Question ID: 1573246
Which of the following is an assumption of capital market theory? All investors:
A) have multiple-period time horizons.
B) see the same risk/return distribution for a given stock.
select portfolios that lie above the e cient frontier to optimize the risk-return C) relationship. Explanation
All investors select portfolios that lie along the efficient frontier, based on their utility functions. All
investors have the same one-period time horizon, and have the same risk/return expectations. (Module 21.2, LOS 21.f) Question #29 of 92 Question ID: 1573252
According to the capital asset pricing model (CAPM):
an investor who is risk averse should hold at least some of the risk-free asset in A) his portfolio.
a stock with high risk, measured as standard deviation of returns, will have high B) expected returns in equilibrium.
C) all investors who take on risk will hold the same risky-asset portfolio. Explanation
One of the assumptions of the CAPM is that all investors who hold risky assets will hold the same portfolio
of risky assets (the market portfolio). Risk aversion means an investor will accept more risk only if
compensated with a higher expected return. In capital market theory, all investors exhibit risk aversion,
even an investor who is short the risk-free asset. In the CAPM, a stock's risk is measured as its beta, not its
standard deviation of returns. (Module 21.2, LOS 21.f) Question #30 of 92 Question ID: 1573269
A stock that plots below the Security Market Line most likely: lOMoAR cPSD| 58562220 A) is overvalued. B) has a beta less than one. C) is below the e cient frontier. Explanation
Since the equation of the SML is the capital asset pricing model, you can determine if a stock is over- or
underpriced graphically or mathematically. Your answers will always be the same.
Graphically: If you plot a stock's expected return on the SML and it falls below the line, it indicates that
the stock is currently overpriced, causing its expected return to be too low. If the plot is above the line, it
indicates that the stock is underpriced. If the plot falls on the SML, it indicates the stock is properly priced.
Mathematically: In the context of the SML, a security is underpriced if the required return is less than the
holding period (or expected) return, is overpriced if the required return is greater the holding period (or
expected) return, and is correctly priced if the required return equals the holding period (or expected) return. (Module 21.2, LOS 21.h)
Question #31 of 92 Question ID: 1573260 The beta of Stock A is 1.3. If the expected return of the
market is 12%, and the risk-free rate of return is 6%, what is the expected return of Stock A? A) 14.2%. B) 15.6%. C) 13.8%. Explanation
RRStock = Rf + (RMarket - Rf) × BetaStock, where RR= required return, R = return, and Rf = risk-free rate
Here, RRStock = 6 + (12 - 6) × 1.3 = 6 + 7.8 = 13.8%. (Module 21.2, LOS 21.g) Question #32 of 92 Question ID: 1573209
Which of the following is the most accurate description of the market portfolio in Capital Market Theory?
The market portfolio consists of all:
A) equity securities in existence.
B) risky and risk-free assets in existence. lOMoAR cPSD| 58562220 C) risky assets in existence. Explanation
The market portfolio, in theory, contains all risky assets in existence. It does not contain any risk-free assets. (Module 21.1, LOS 21.b) Question #33 of 92 Question ID: 1573199
An equally weighted portfolio of a risky asset and a risk-free asset will exhibit:
A) half the returns standard deviation of the risky asset.
B) less than half the returns standard deviation of the risky asset.
C) more than half the returns standard deviation of the risky asset. Explanation
A risk free asset has a standard deviation of returns equal to zero and a correlation of returns with any
risky asset also equal to zero. As a result, the standard deviation of returns of a portfolio of a risky asset
and a risk-free asset is equal to the weight of the risky asset multiplied by its standard deviation of
returns. For an equally weighted portfolio, the weight of the risky asset is 0.5 and the portfolio standard
deviation is 0.5 × the standard deviation of returns of the risky asset. (Module 21.1, LOS 21.a) Question #34 of 92 Question ID: 1573276
Charlie Smith holds two portfolios, Portfolio X and Portfolio Y. They are both liquid, welldiversified
portfolios with approximately equal market values. He expects Portfolio X to return 13% and Portfolio Y to
return 14% over the upcoming year. Because of an unexpected need for cash, Smith is forced to sell at
least one of the portfolios. He uses the security market line to determine whether his portfolios are
undervalued or overvalued. Portfolio X's beta is 0.9 and Portfolio Y's beta is 1.1. The expected return on
the market is 12% and the risk-free rate is 5%. Smith should sell: lOMoAR cPSD| 58562220 A) portfolio Y only.
B) both portfolios X and Y because they are both overvalued.
C) either portfolio X or Y because they are both properly valued. Explanation
Portfolio X's required return is 0.05 + 0.9 × (0.12-0.05) = 11.3%. It is expected to return 13%. The portfolio
has an expected excess return of 1.7%
Portfolio Y's required return is 0.05 + 1.1 × (0.12-0.05) = 12.7%. It is expected to return 14%. The portfolio
has an expected excess return of 1.3%.
Since both portfolios are undervalued, the investor should sell the portfolio that offers less excess return.
Sell Portfolio Y because its excess return is less than that of Portfolio X. (Module 21.2, LOS 21.h) Question #35 of 92 Question ID: 1573273 lOMoAR cPSD| 58562220
An analyst wants to determine whether Dover Holdings is overvalued or undervalued, and by how much
(expressed as percentage return). The analyst gathers the following information on the stock:
Market standard deviation = 0.70
Covariance of Dover with the market = 0.85 Dover's
current stock price (P0) = $35.00
The expected price in one year (P1) is $39.00
Expected annual dividend = $1.50
3-month Treasury bill yield = 4.50%.
Historical average S&P 500 return = 12.0%. Dover Holdings stock is:
A) undervalued by approximately 2.1%.
B) overvalued by approximately 1.8%.
C) undervalued by approximately 1.8%. Explanation
To determine whether a stock is overvalued or undervalued, we need to compare the expected return (or
holding period return) and the required return (from Capital Asset Pricing Model, or CAPM).
Step 1: Calculate Expected Return (Holding period return)
The formula for the (one-year) holding period return is:
HPR = (D1 + S1 – S0) / S0, where D = dividend and S = stock price.
Here, HPR = (1.50 + 39 – 35) / 35 = 15.71%
Step 2: Calculate Required Return
The formula for the required return is from the CAPM:
RR = Rf + (ERM – Rf) × Beta
Here, we are given the information we need except for Beta. Remember that Beta can be calculated with:
Betastock = [covS,M] / [σ2M].
Here we are given the numerator and the denominator, so the calculation is: 0.85 / 0.702 =
1.73. RR = 4.50% + (12.0 – 4.50%) × 1.73 = 17.48%.
Step 3: Determine over/under valuation
The required return is greater than the expected return, so the security is overvalued.
The amount = 17.48% – 15.71% = 1.77%. (Module 21.2, LOS 21.h) Question #36 of 92 Question ID: 1573284 lOMoAR cPSD| 58562220
A portfolio's excess return per unit of systematic risk is known as its: A) Jensen’s alpha. B) Sharpe ratio. C) Treynor measure. Explanation
The Treynor measure is excess return relative to beta. The Sharpe ratio measures excess return relative to
standard deviation. Jensen's alpha measures a portfolio's excess return relative to return of a portfolio on
the SML that has the same beta. (Module 21.2, LOS 21.i) Question #37 of 92 Question ID: 1573217
All portfolios that lie on the capital market line:
A) have some unsystematic risk unless only the risk-free asset is held.
B) contain at least some positive allocation to the risk-free asset.
C) contain the same mix of risky assets unless only the risk-free asset is held. Explanation
All portfolios on the CML include the same tangency portfolio of risky assets, except the intercept (all
invested in risk-free asset). The tangency portfolio contains none of the riskfree asset and "borrowing
portfolios" can be constructed with a negative allocation to the risk-free asset. Portfolios on the CML are
efficient (well-diversified) and have no unsystematic risk. (Module 21.1, LOS 21.c) Question #38 of 92 Question ID: 1573248
Which of the following statements regarding the Capital Asset Pricing Model is least accurate?
A) It is useful for determining an appropriate discount rate.
B) It is when the security market line (SML) and capital market line (CML) converge.
C) Its accuracy depends upon the accuracy of the beta estimates. Explanation lOMoAR cPSD| 58562220
The CML plots expected return versus standard deviation risk. The SML plots expected return versus beta
risk. Therefore, they are lines that are plotted in different twodimensional spaces and will not converge. (Module 21.2, LOS 21.f) Question #39 of 92 Question ID: 1573220
In the context of the capital market line (CML), which of the following statements is CORRECT?
A) Firm-speci c risk can be reduced through diversi cation.
B) Market risk can be reduced through diversi cation.
C) The two classes of risk are market risk and systematic risk. Explanation
The other statements are false. Market risk cannot be reduced through diversification; market risk =
systematic risk. The two classes of risk are unsystematic risk and systematic risk. (Module 21.1, LOS 21.c) Question #40 of 92 Question ID: 1573287
A portfolio of options had a return of 22% with a standard deviation of 20%. If the risk-free rate is 7.5%,
what is the Sharpe ratio for the portfolio? A) 0.147. B) 0.568. C) 0.725. Explanation
Sharpe ratio = (22% – 7.50%) / 20% = 0.725. (Module 21.2, LOS 21.i) Question #41 of 92 Question ID: 1573229
The market model of the expected return on a risky security is best described as a(n):
Tài liệu liên quan:
-
Discussion Questions Lecture 3 | Môn Investment Banking - Trường Đại học Quốc tế, Đại học Quốc gia Thành phố Hồ Chí Minh
95 48 -
Focus Notes: Key Concepts & Analysis Techniques | Môn Investment Banking - Trường Đại học Quốc tế, Đại học Quốc gia Thành phố Hồ Chí Minh
93 47 -
Law on Credit instituion | Môn Investment Banking - Trường Đại học Quốc tế, Đại học Quốc gia Thành phố Hồ Chí Minh
80 40 -

Cost of Equity Calculation | Môn Investment Banking - Trường Đại học Quốc tế, Đại học Quốc gia Thành phố Hồ Chí Minh
83 42