Ghi chú cho kỳ thi giữa kỳ và Phân tích Hồi quy | Môn Kinh tế lượng - Đại học Ngoại Thương
Ghi chú cho kỳ thi giữa kỳ và Phân tích Hồi quy Môn Kinh tế lượng. Tài liệu được sưu tầm gồm 8 trang, giúp bạn ôn tập tốt hơn. Mời các bạn đón xem.
Môn: Kinh tế lượng (KTE3090) 13 tài liệu
Trường: Trường Đại học Ngoại Thương 1.1 K tài liệu
Tác giả:
Preview text:
lOMoAR cPSD| 58562220
Lecturer: PhD. Vu T. Phuong Mai Class code: KTEE309.2 Mail: maivp@ftu.edu.vn
15 buổi (9 buổi lý thuyết; 6 buổi thực hành)
3 – 5 members, report, research applied econometrics App: Stata
Submit for Mid – term: Report + Do-file (Stata)
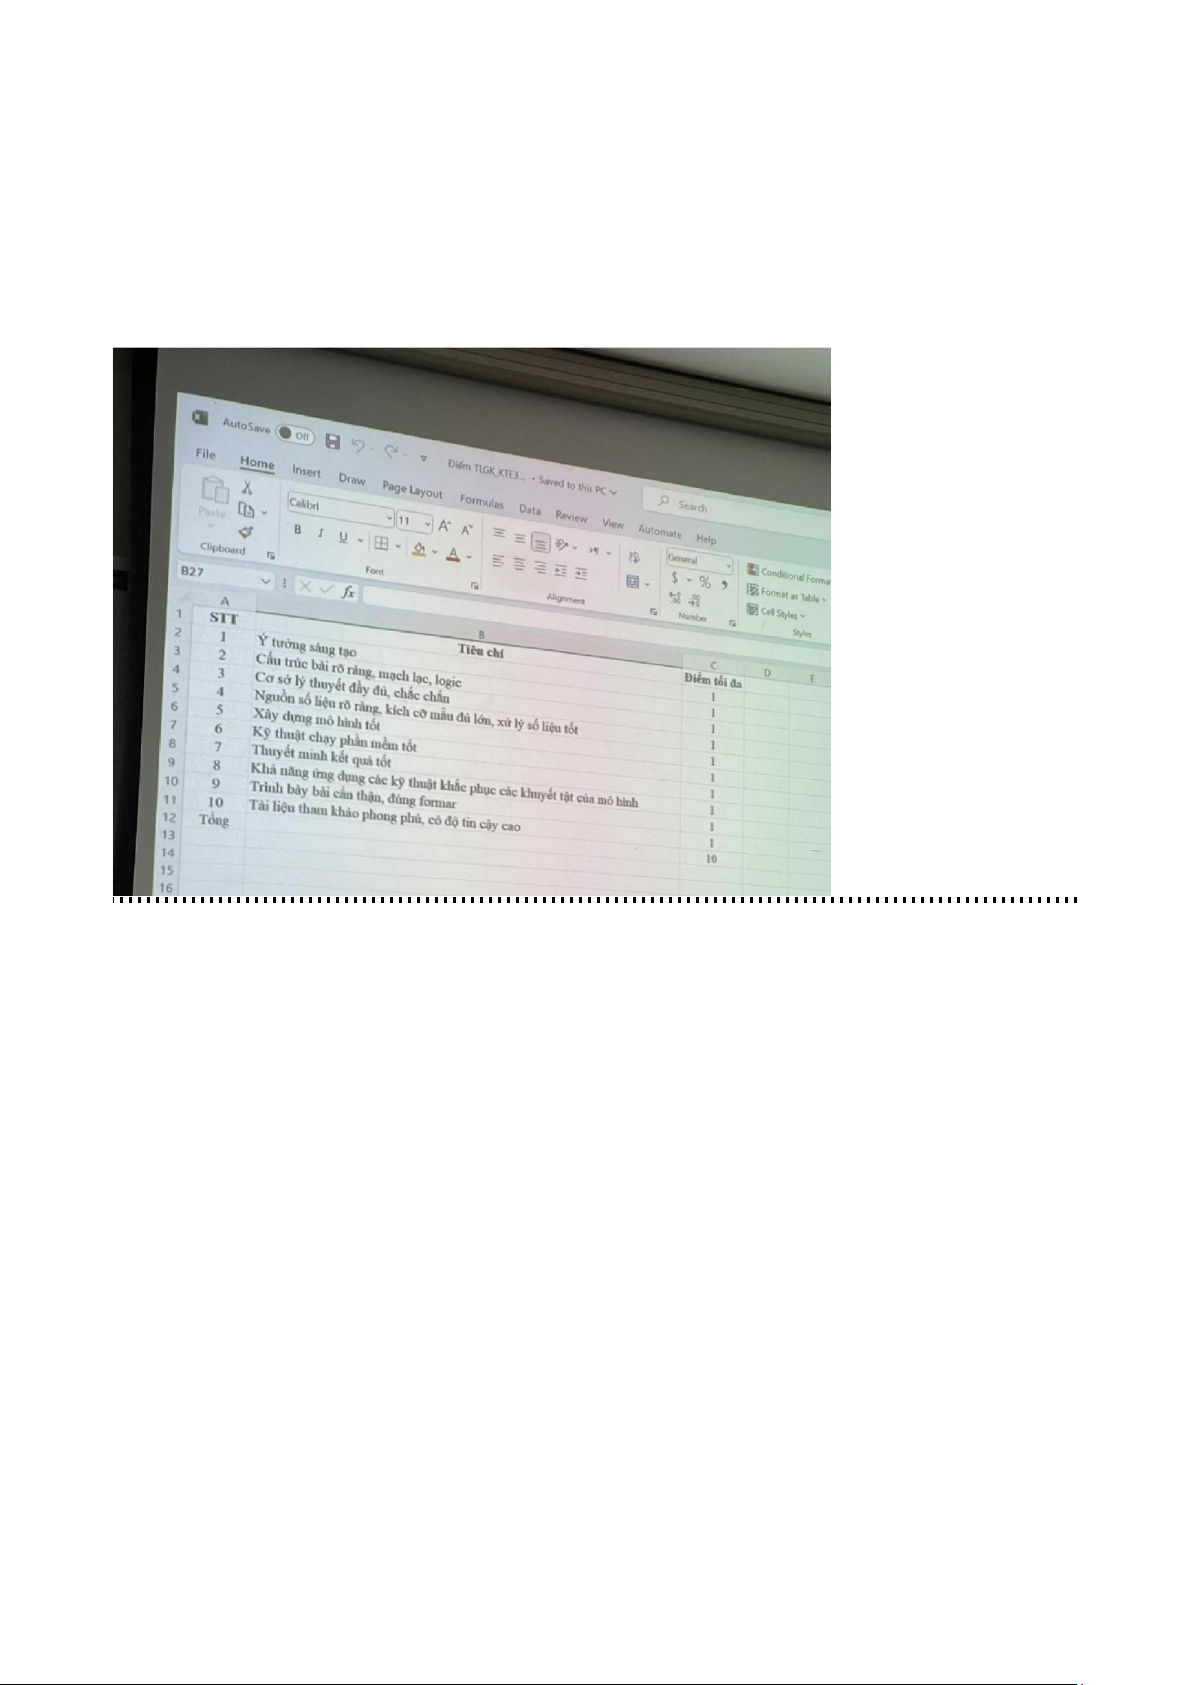
Tiêu chí đánh giá Report:
Chapter 1: INTRODUCTION TO ECONOMETRICS Lesson 1, 2 (24-26/10/2023) I. Why study econometrics?
- Econometrics – a bridge between economic theories and reality
- Econometrics provides the tools needed to see if the theory is correct
- Econometrics is economic measurements, but econometrics is much broader II. What is Econometrics?
- Mô hình phải được phát triển dựa trên 1 lý thuyết nào đấy - Econometrics = Economics + Metrics - Definitions:
• Econometrics may be defined as the quantitative analysis of actual economic phenomena
based on the concurrent development of theory and observation, related by appropriate
methods of inference. (Methodology of Mathematical Economics and Econometrics, 1968)
• Econometrics may be defined as the social science in which the tools of economic theory,
mathematics, and statistical inference are applied to the analysis of economic phenomena. (Econometric Theory, 1964)
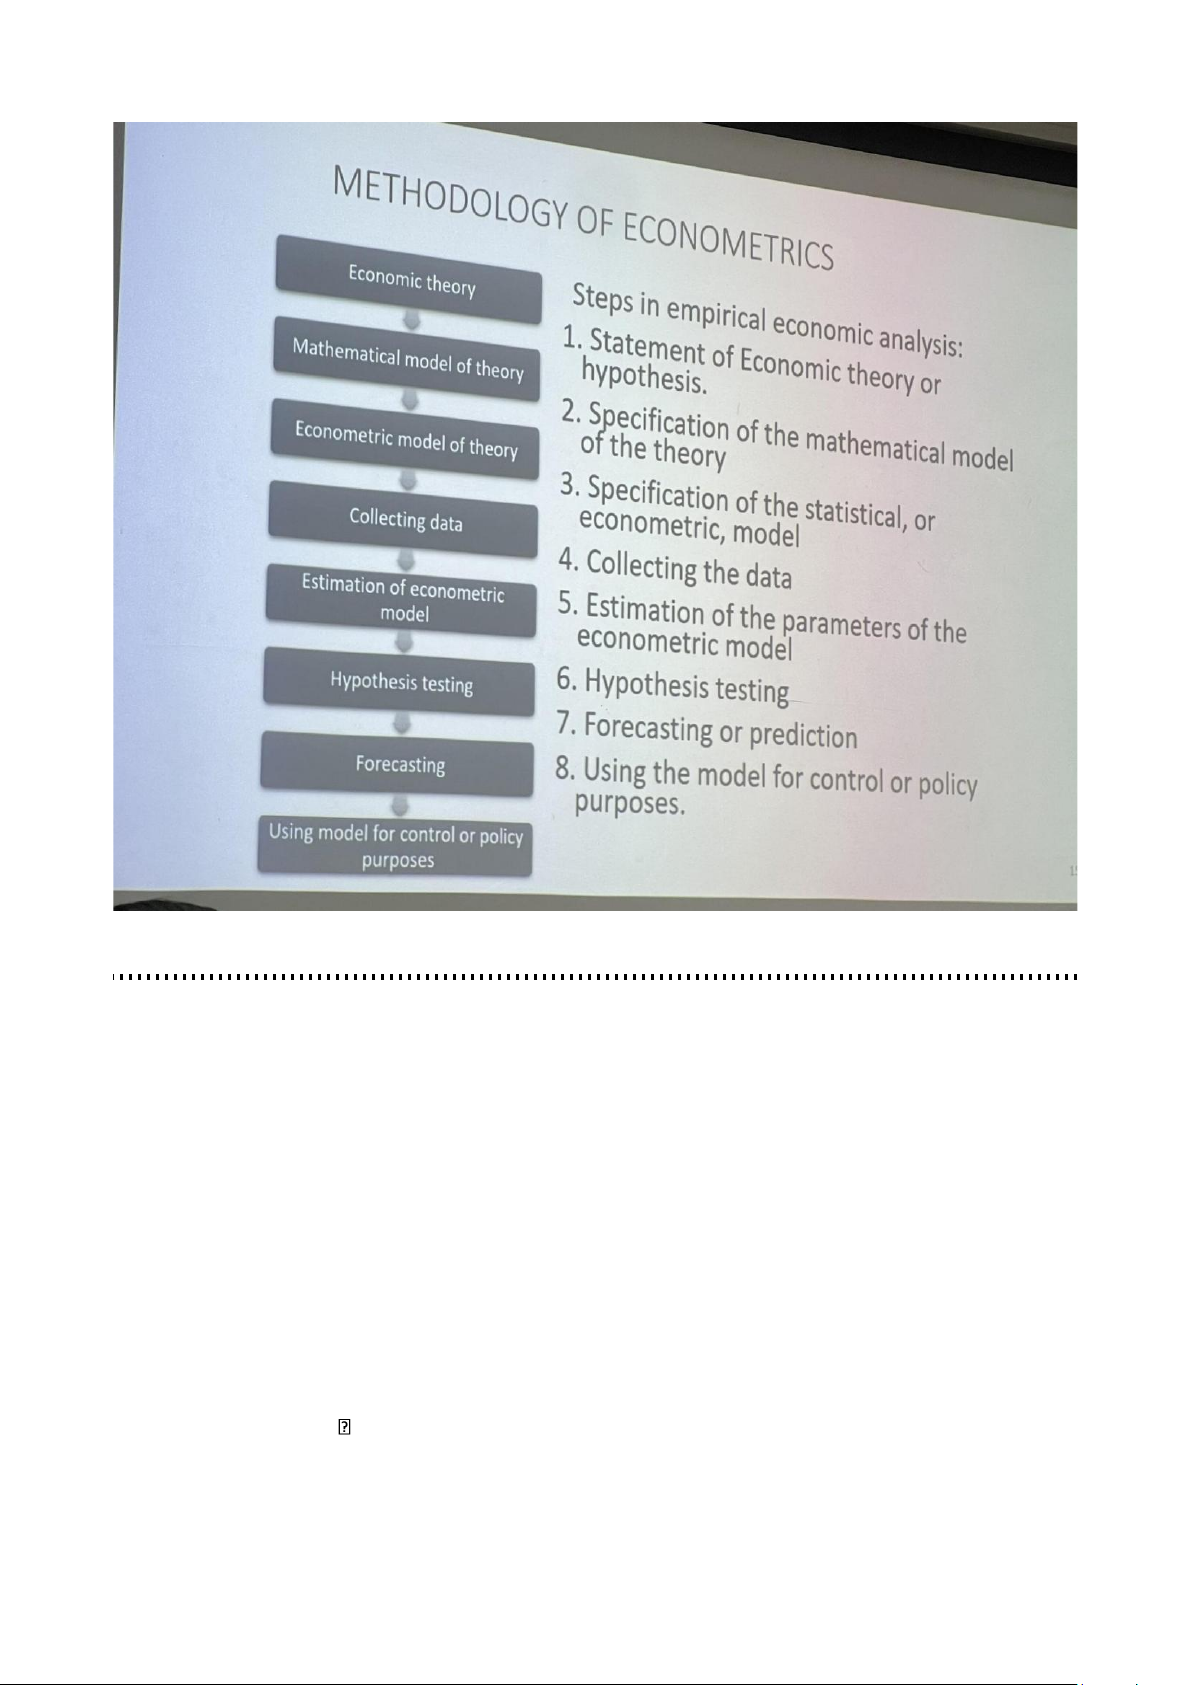
III. Methodology of Econometrics lOMoAR cPSD| 58562220
Lecturer: PhD. Vu T. Phuong Mai Class code: KTEE309.2 Mail: maivp@ftu.edu.vn
Ví dụ: Determinants of GPA (in notebook)
Chapter 2: The nature of Regression Analysis Lesson 1 (31/10/2023)
Regression: Hồi quy
I. Historical origin of the term Regression
- The term regression was introduced by Francis Galton.
- Galton found that, although there was a tendency for tall parents to have tall children and for
short parents to have short children, the average height of children born of parents of a
- given height tended to move or “regress” toward the average height in the population as a whole.
- In other words, the height of the children of unusually tall or unusually short parents tends to
move toward the average height of the population.
- Regression line regression to mediocrity (quy về giá trị trung bình) lOMoAR cPSD| 58562220
Lecturer: PhD. Vu T. Phuong Mai Class code: KTEE309.2 Mail: maivp@ftu.edu.vn
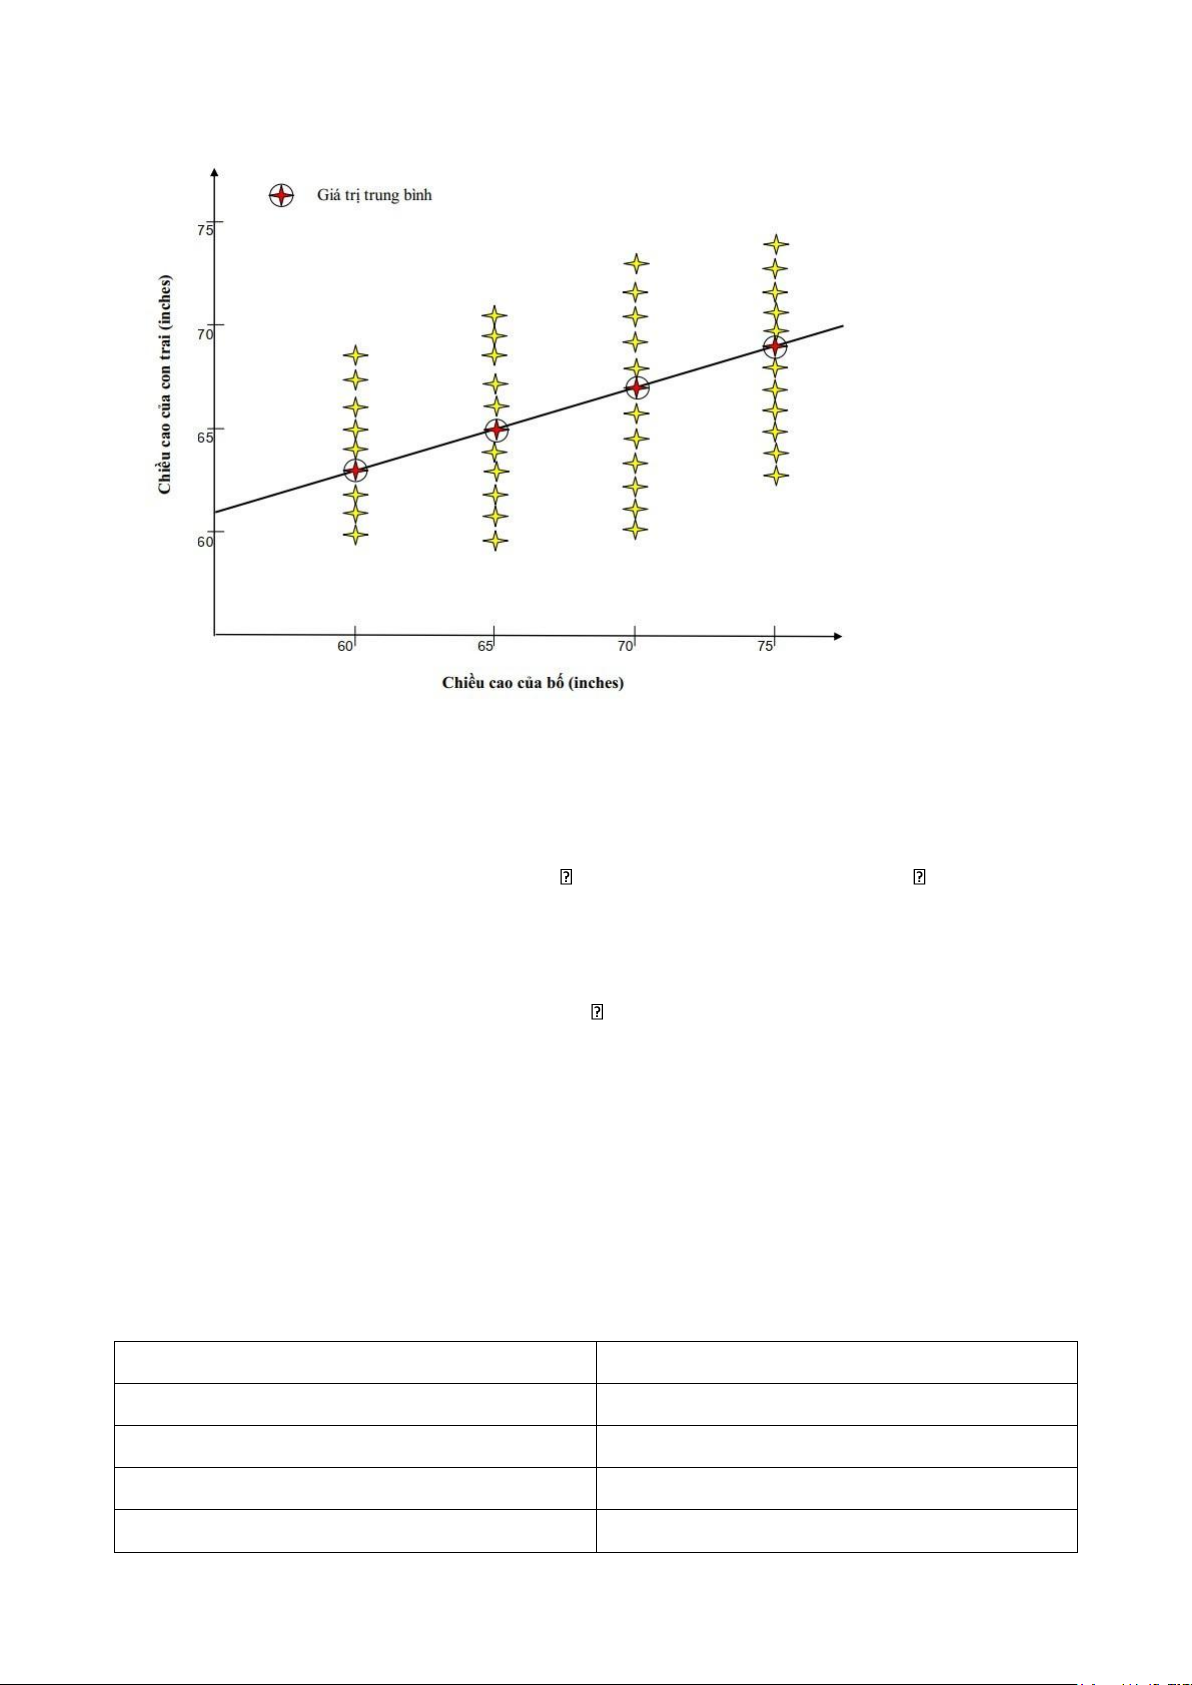
• Biểu đồ thể hiện sự phân bổ chiều cao của con trai tương ứng với chiều cao của bố
• Despite the variability of the height of sons for a given value of father’s height, the average
height of sons increases as the height of the father increases
• The circled crosses in the figure
• indicate the average height of sons corresponding to a given height of the father.
• Connecting these averages, we obtain
• the line shown in the figure. This line
• is known as the regression line →
• shows how the average height of sons increases with the father’s height. II. Regression analysis
- Regression analysis is concerned with the study of the dependence of one variable, the
dependent variable, on one or more other variables, the explanatory variables, with a view
to estimating and/or predicting the (population) mean or average value of the former in terms
of the known or fixed (in repeated sampling) values of the latter. - Examples:
• The dependence of the quantity demanded on the price of a good.
• The dependence of personal consumption on personal income.
• The dependence of output on labor, capital and technology. Dependent Variable (Y)
Independent Variable (X) Explained variable Explanatory variable Endogenous variable Exogenous variable Regressand Regressor Response Stimulus lOMoAR cPSD| 58562220
Lecturer: PhD. Vu T. Phuong Mai Class code: KTEE309.2 Mail: maivp@ftu.edu.vn Examples: Examples:
- Price, income, other goods’ prices - Quantity demanded
- Temperature, rainfall, sunshine, - Crop yield fertilizer - Consumption
- Income, wealth, personal, needs, age
III. Different types of relationships
1. Statistical (Thống kê) vs. Deterministic (Bất định) Relationships
Deterministic (functional) relationship
Statistical relationship
Variables are not stochastic (ngẫu nhiên)
Deals with stochastic variables
For one value of X, there is only one
For one value of X, there are a lot of corresponding value of Y corresponding values of Y
Example: With the income of 8m dongs per Example: y = 3x
month, the level of expenditure for each
individual can be 4, 5, 7, or 10m dongs
The relationship between economic variables are statiscal (viết nốt)
Chapter 3: Two – variable Regression Analysis: Some Basic Ideas Lesson 1 (02/11/2023) I. A hypothetical example
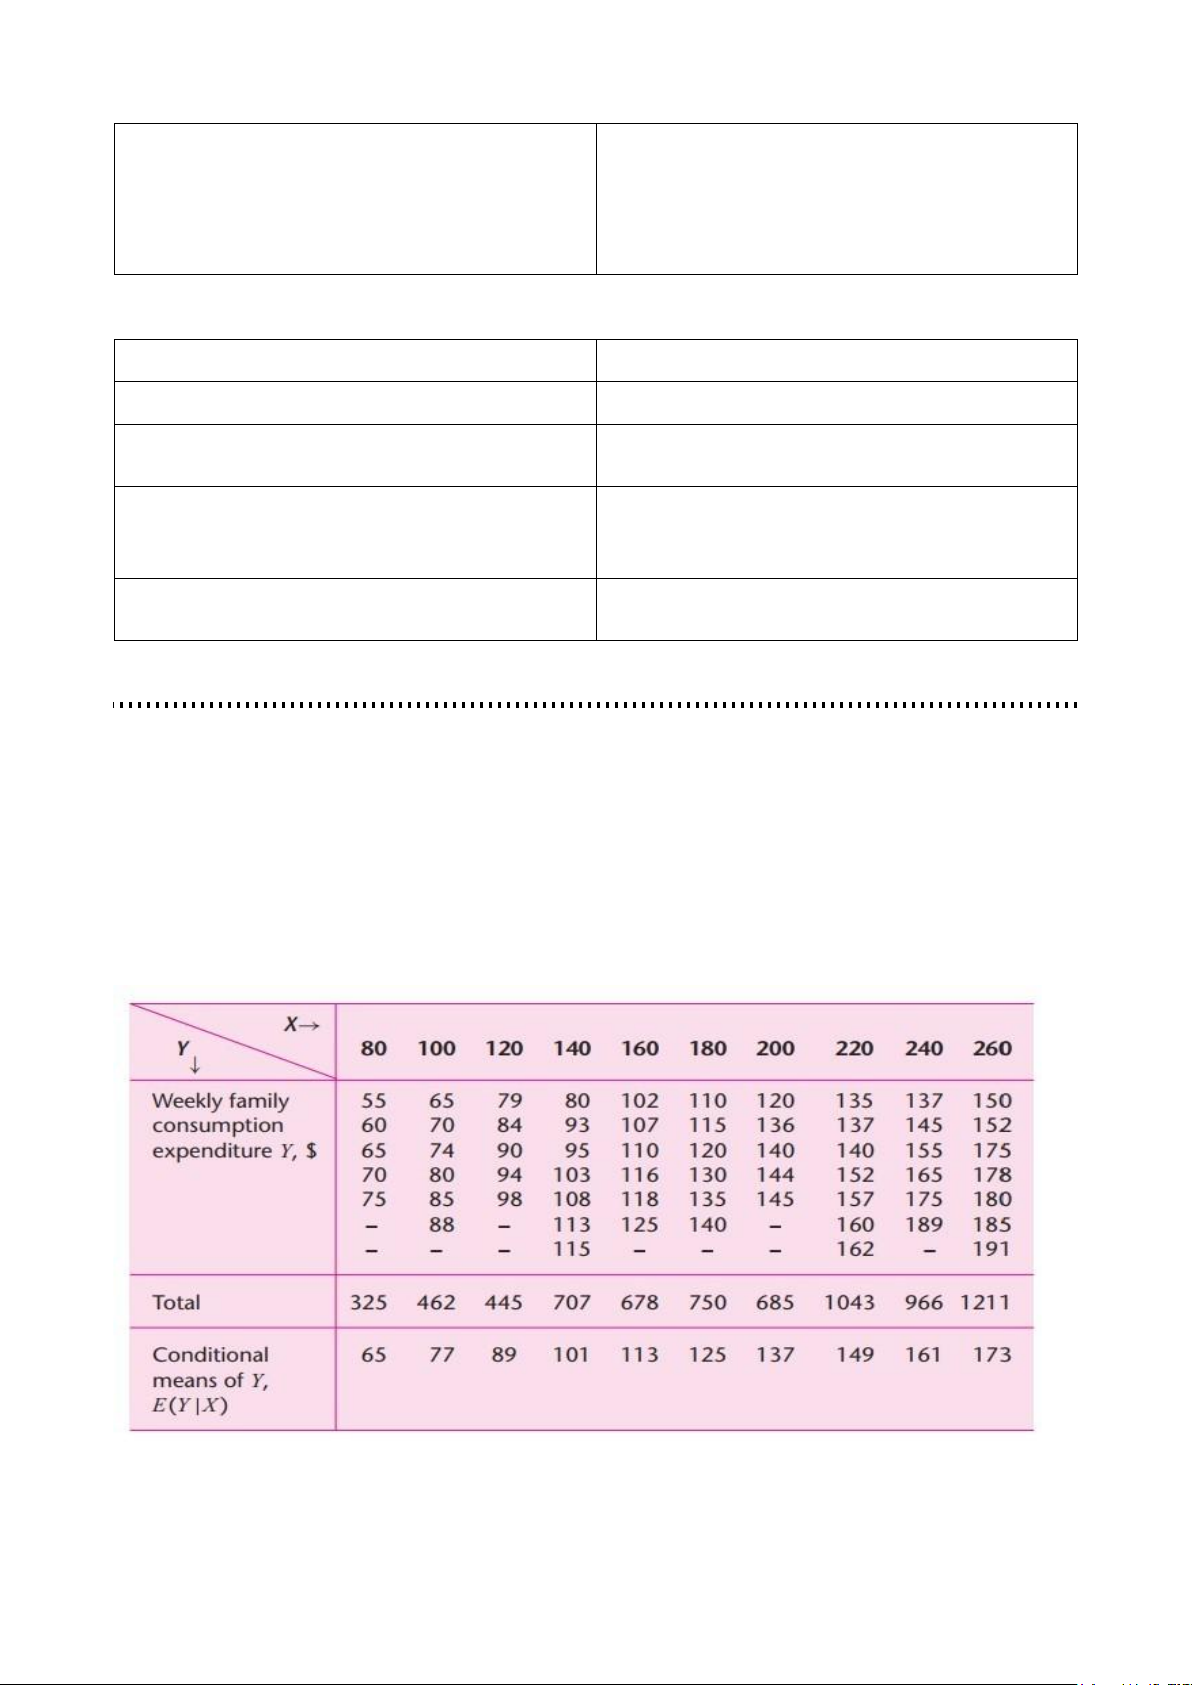
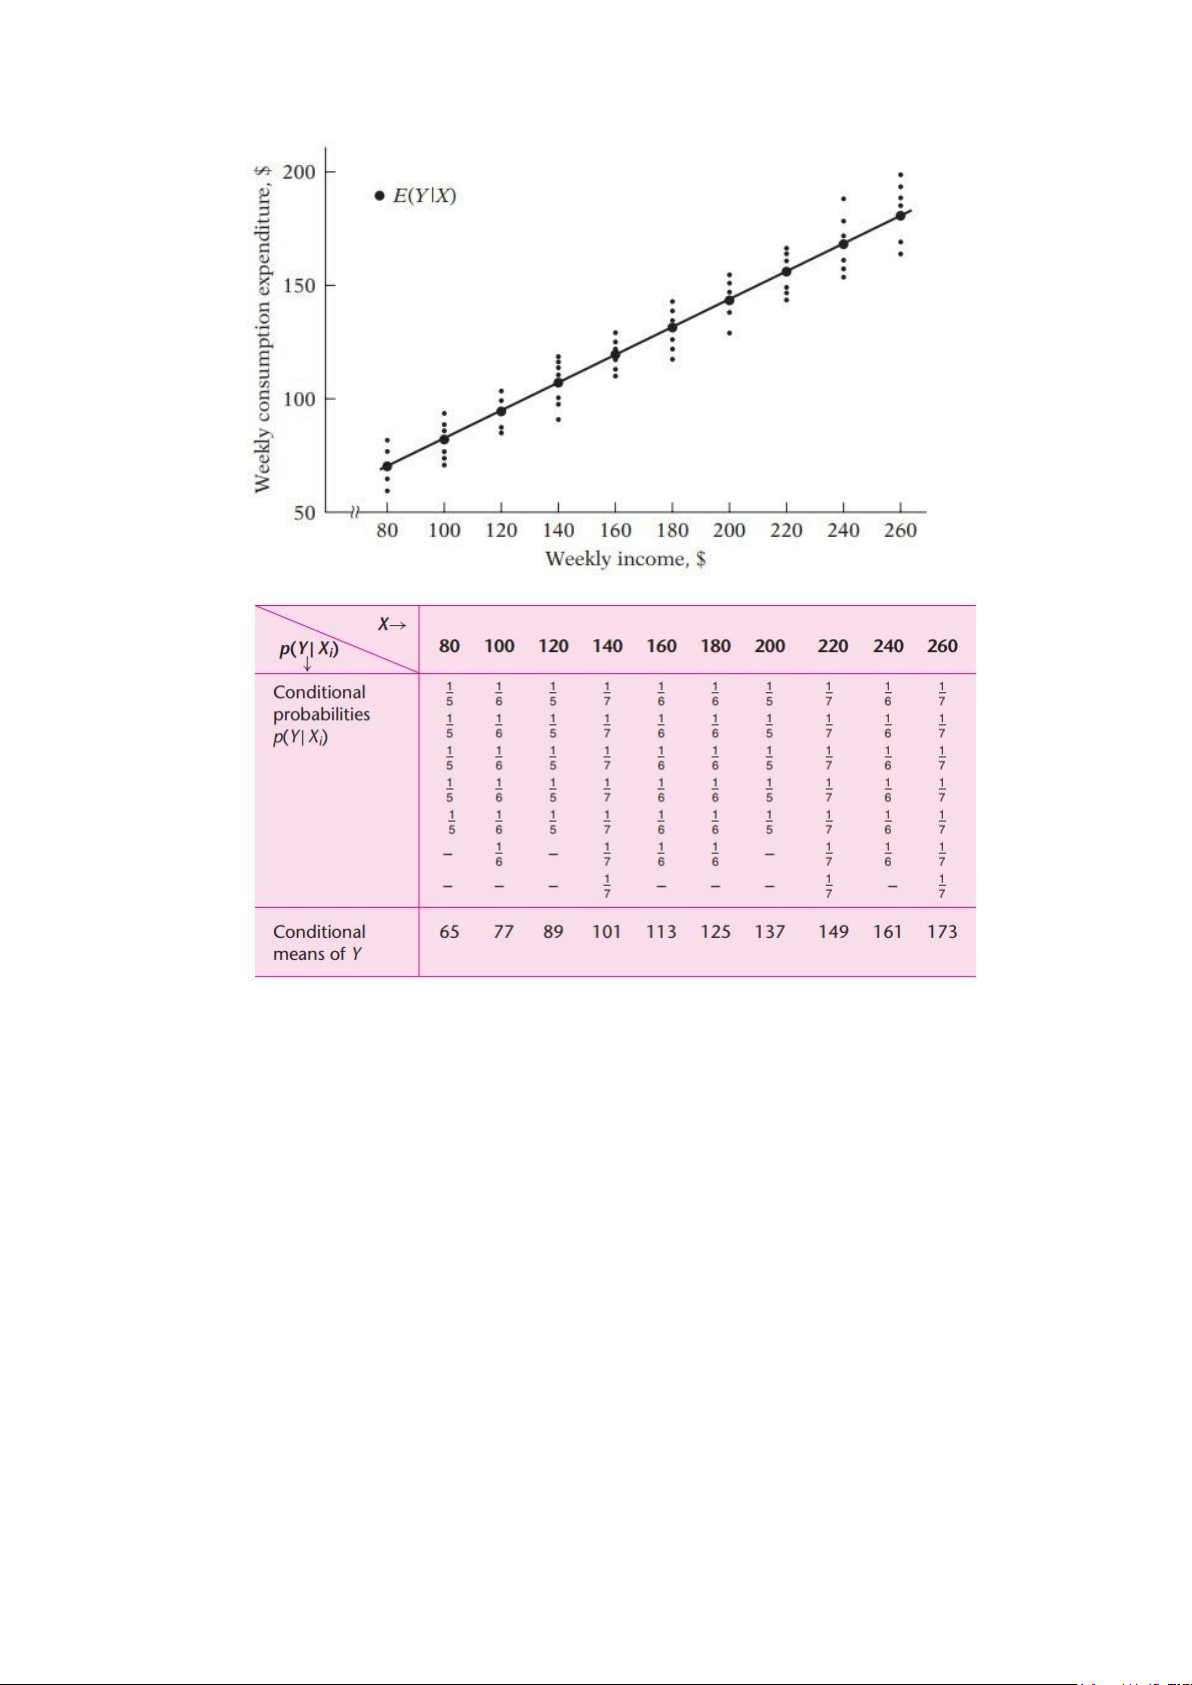
- Consider a total population of 60 families in a hypothetical community and their weekly
income (X) and weekly assumption expenditure (Y), both in dollars
- The 60 families are divided into 10 income groups (from $80 to $260) and weekly assumption expenditure - Cách tính: Trong vở
- Sau khi tìm ra conditional mean, ta có các giá trị trung bình, biểu diễn trên biểu đồ: lOMoAR cPSD| 58562220
Lecturer: PhD. Vu T. Phuong Mai Class code: KTEE309.2 Mail: maivp@ftu.edu.vn
II. The Concept of Population Regression Function (PRF) (vở)
III. The Meaning of the Term LINEAR
- The term LINEAR regression will always mean a regression that is linear in the parameters;
the β’s (that is, the parameters are raised to the first power only). It may or may not be linear
in the explanatory variables; the X’s. 1. Linearity in the Variables
- That is “the conditional expectation of Y is a linear function of Xi”
- Geometrically, the regression curve in this case is a straight line - Example: (vở)
2. Linearity in the Parameters
- That is “the conditional expectation of Y, E(Y/Xi), is a linear function of the parameters, the
β’s; it may not be linear in the variable X - Example (vở)
IV. Stochastic Specification of PRF
- It is clear that, as family income increases, family consumption expenditure on the average increases, too
- But what about the consumption expenditure of an individual family in relation to its (fixed) level of income? lOMoAR cPSD| 58562220
Lecturer: PhD. Vu T. Phuong Mai Class code: KTEE309.2 Mail: maivp@ftu.edu.vn
- It is obvious that an individual family’s consumption expenditure does not necessarily
increase as the income level increases
- For example, corresponding to the income level of $100 there is one family whose
consumption expenditure of $65 is less than the consumption expenditures of two families
whose weekly income is only $80
- Therefore, … (đến hết mục này) trong vở
V. The significance of the Stochastic Disturbance term
- The disturbance term ui is a surrogate (vật thay thế, vật đại diện) for all those variables that
are omitted from the model but that collectively affect Y. - Question: Why ui?
• Ignorance about other variables affecting Y • Unavailability of data
• Randomness in human behavior
• We would like to keep our regression model as simple as possible
• Wrong functional form: missing important varibles
VI. The Sample Regression Function (SRF) 1. Population vs. Sample
- Population is the set of entities under study
- Sample is a subset of the population
- Ví dụ: Consider all FTU students • Population: FTU students
• Sample: 1 lớp tín chỉ nào đó
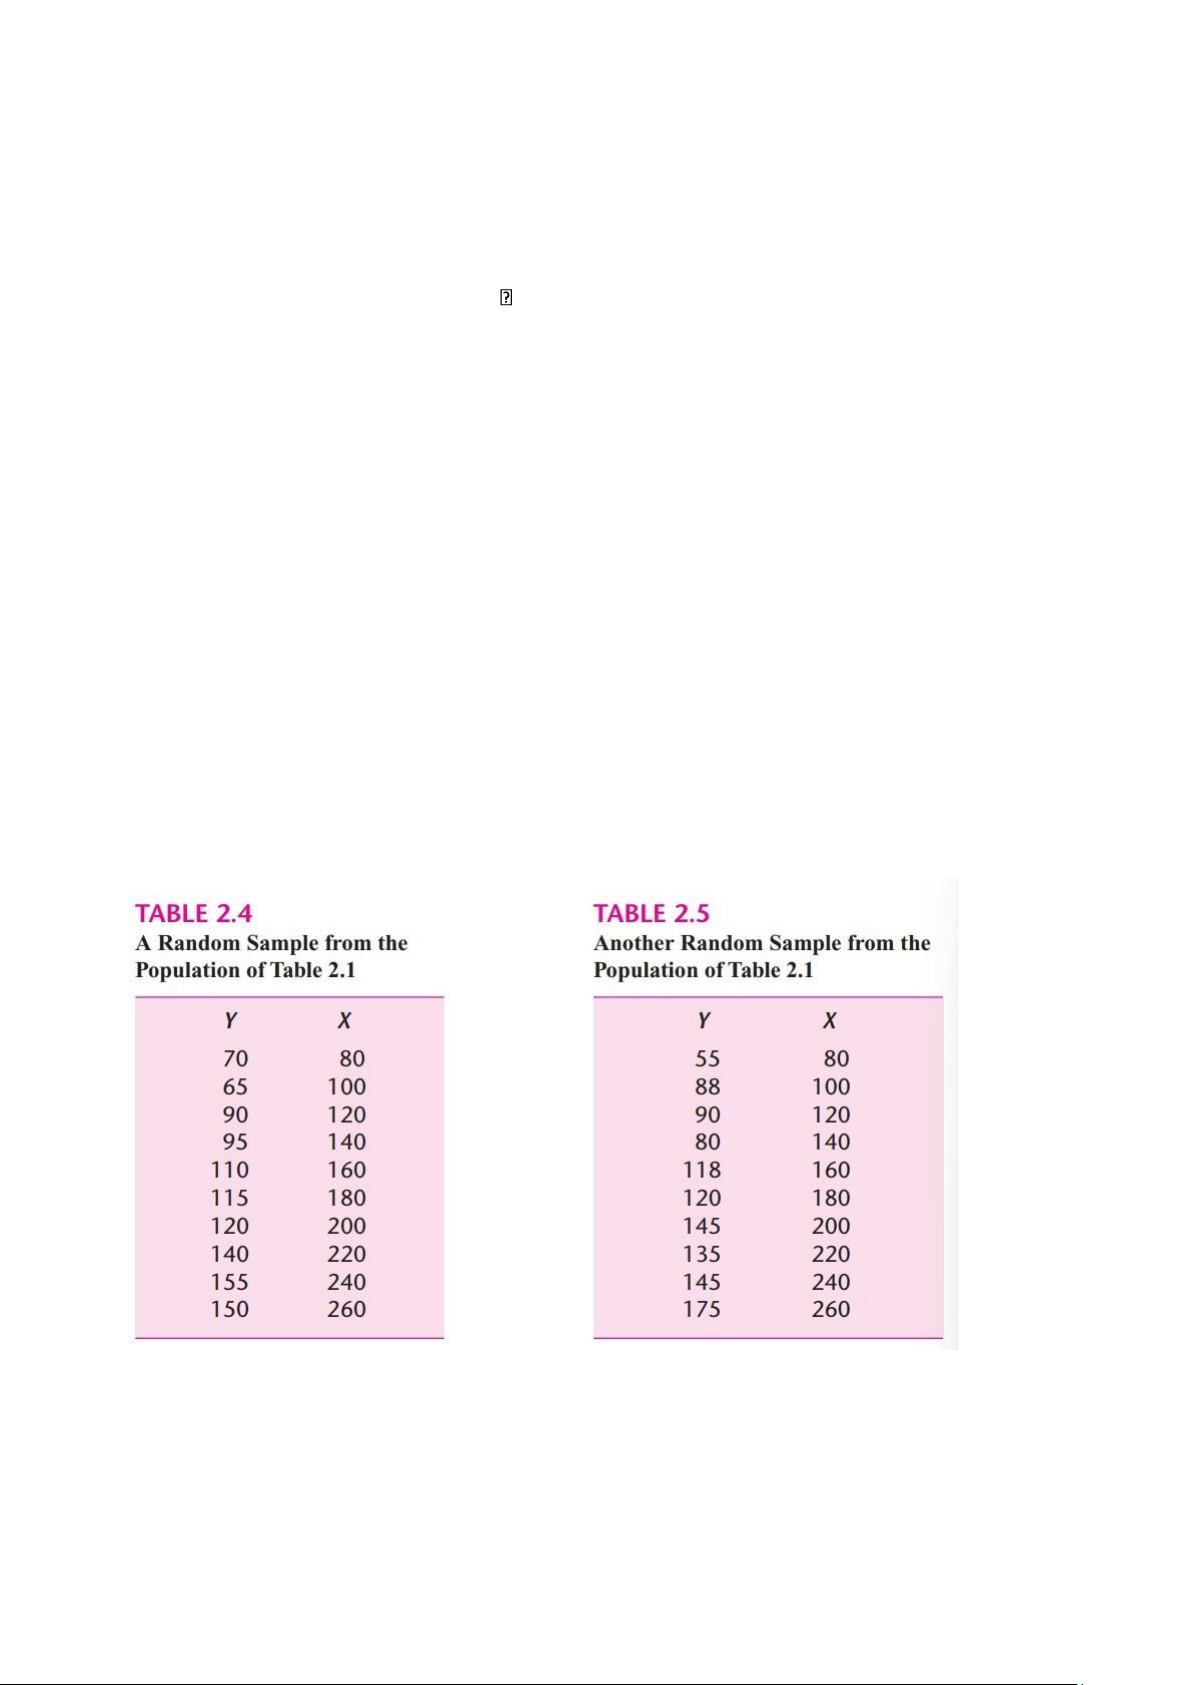
- Ví dụ 2: 2 random sample tables
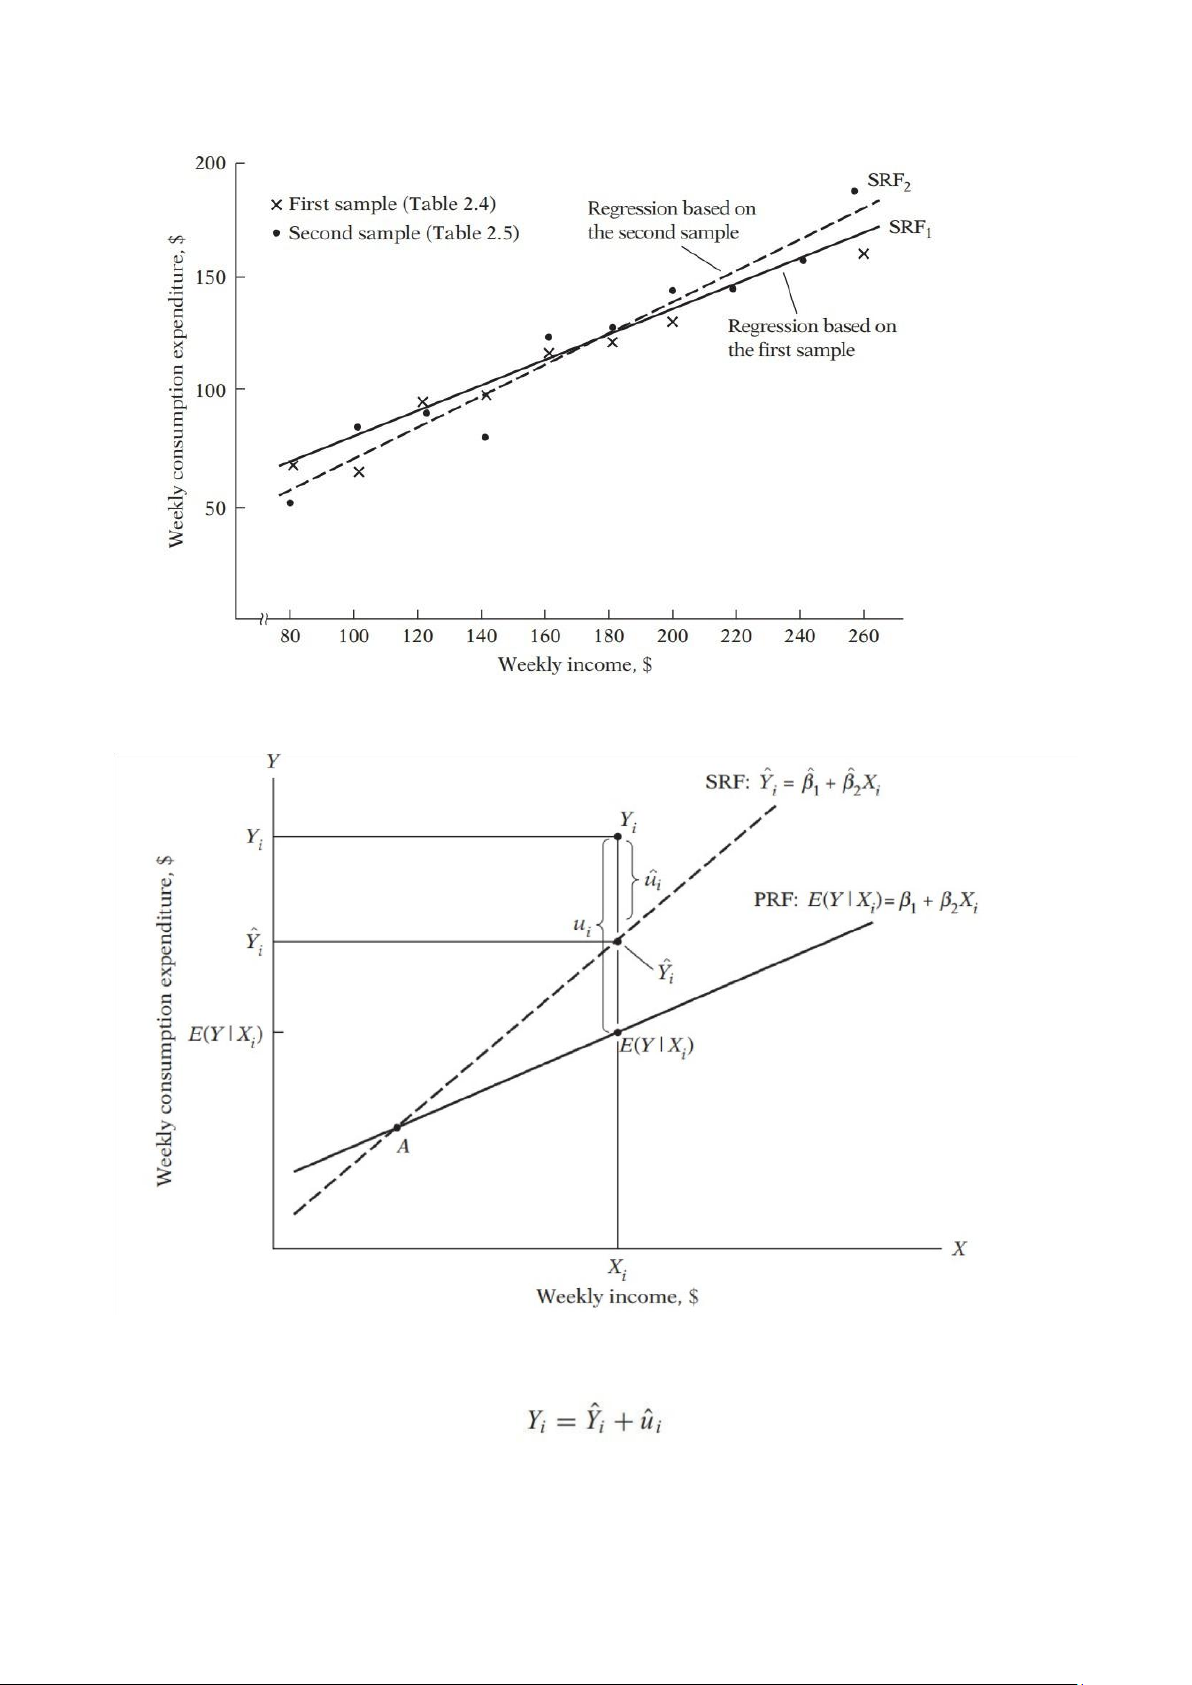
Plotting the data of Table 2.4 and Table 2.5, we obtain the scattergram given in the below figure. In
the scattergram, two sample regression lines are drawn so as to “fit” the scatters reasonably well:
SRF1 is based on the first sample, and the SRF2 is based on the second sample. lOMoAR cPSD| 58562220
Lecturer: PhD. Vu T. Phuong Mai Class code: KTEE309.2 Mail: maivp@ftu.edu.vn
2. Population Regression model vs. Sample Regression model
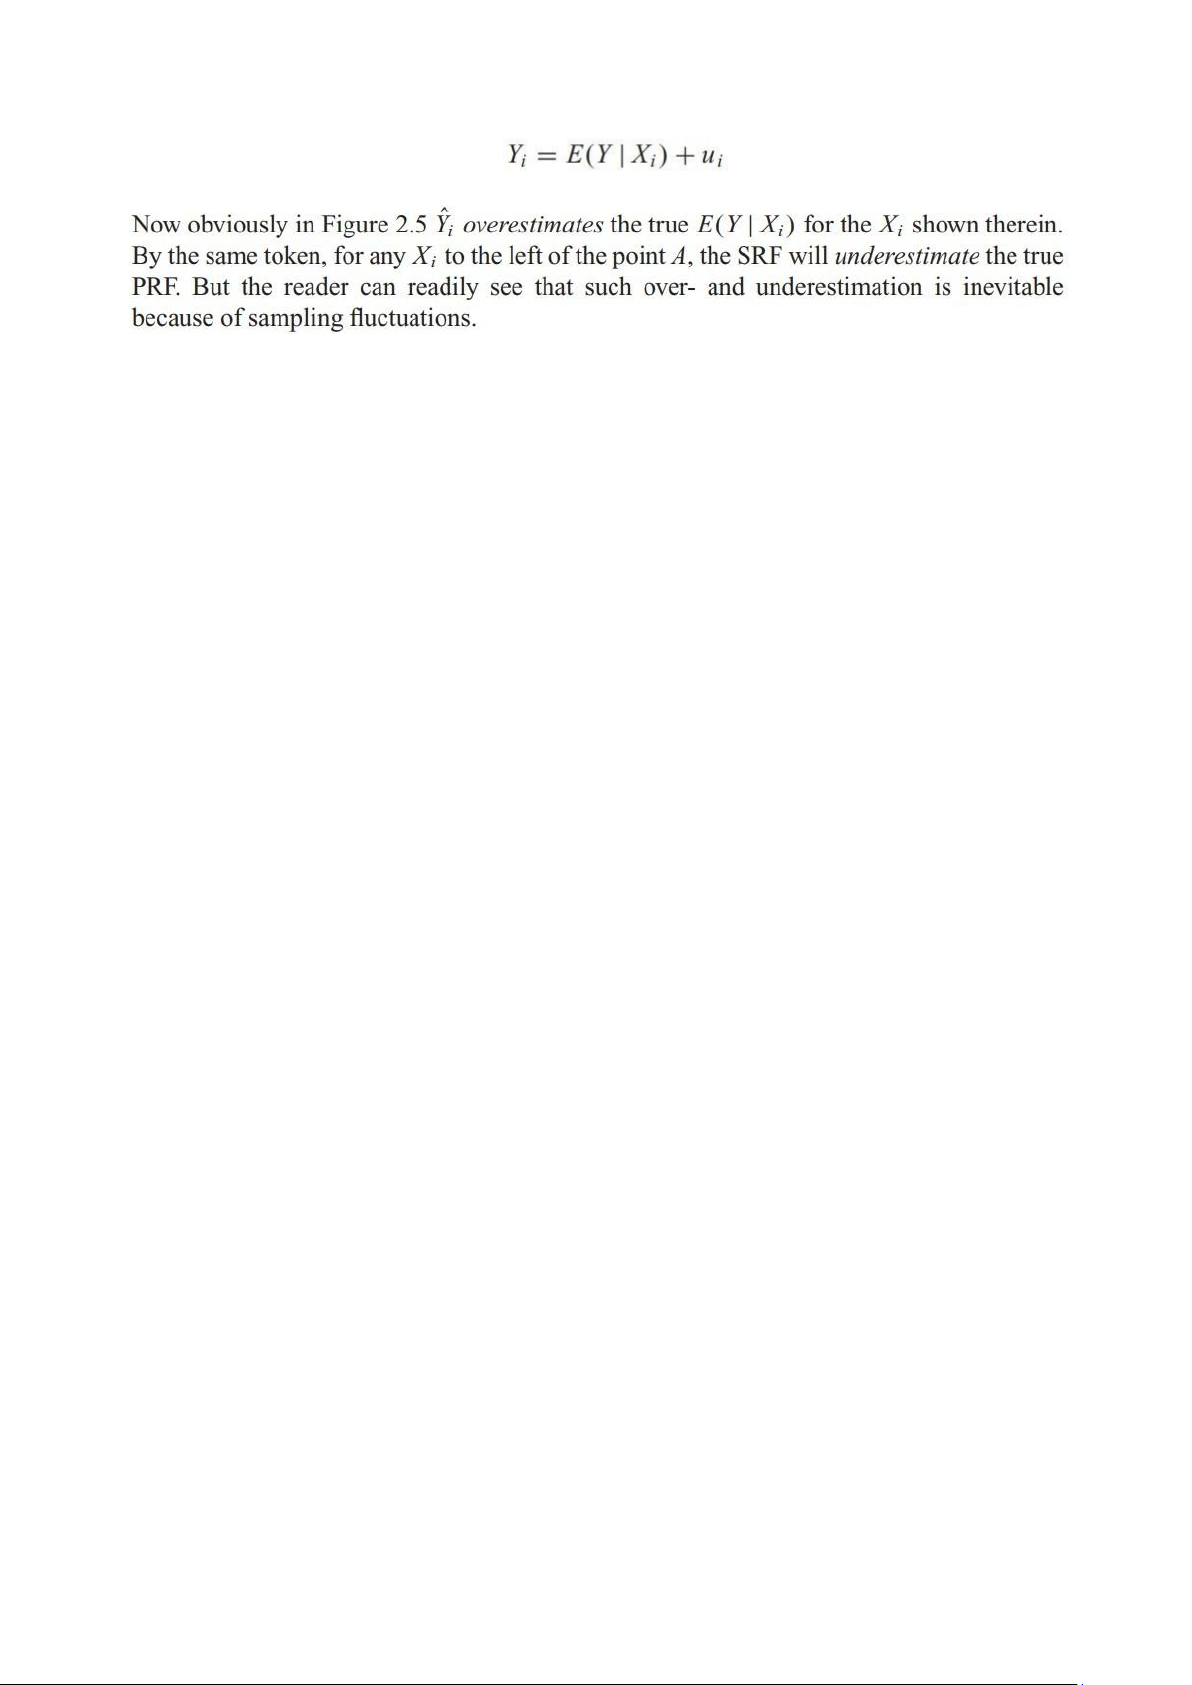
- For X = Xi, we have one (sample) observation Y = Yi. In terms of the SRF, the observed Yi can be expressed as:
- And in terms of the PRF, it can be expressed as: lOMoAR cPSD| 58562220
Lecturer: PhD. Vu T. Phuong Mai Class code: KTEE309.2 Mail: maivp@ftu.edu.vn
- Population regression function (PRF)
• A rule or principle that shows the relationship between the dependent variables for the whole population of interest
• Drawn using all population observations
- Sample regression function (SRF)
• A rule or principle that shows the relationship between the dependent variable and the
independent variables in a specific sample
• Drawn using observations from a specific sample
Tài liệu liên quan:
-
Econometrics Final Exam Questions and Answers | Kinh tế lượng | Trường Đại học Ngoại Thương
22 11 -
BT KTTC CHƯƠNG 3 HTK - Bài Tập Kế Toán Hàng Tồn Kho và Chi Phí
67 34 -
ĐỀ BÀI: Chương 4 - Phần 3: Arene và Cấu Tạo Benzene
59 30 -

Kinh tế lượng và Mô hình Hồi quy: Ghi chép bài học | Môn Kinh tế lượng - Đại học Ngoại Thương
126 63 -
Bài tập trắc nghiệm Mô hình hồi quy và Suy diễn thống kê | Môn Kinh tế lượng - Đại học Ngoại Thương
96 48