Group Assignment 1 - Economic Opportunity Costs & Production Choices môn Kinh tế vi mô | Trường Đại học Kinh Tế Quốc Dân
The opportunity costs for the production of missiles are increasing.- From point E to D, the opportunity cost of increasing output from 0to 12 thousand guided missiles is 2 million cars . Tài liệu giúp bạn tham khảo, ôn tập và đạt kết quả cao. Mời đọc đón xem!
Môn: Kinh tế vi mô ( NEU ) 761 tài liệu
Trường: Trường Đại học Kinh Tế Quốc Dân 7.4 K tài liệu
Tác giả:


Preview text:
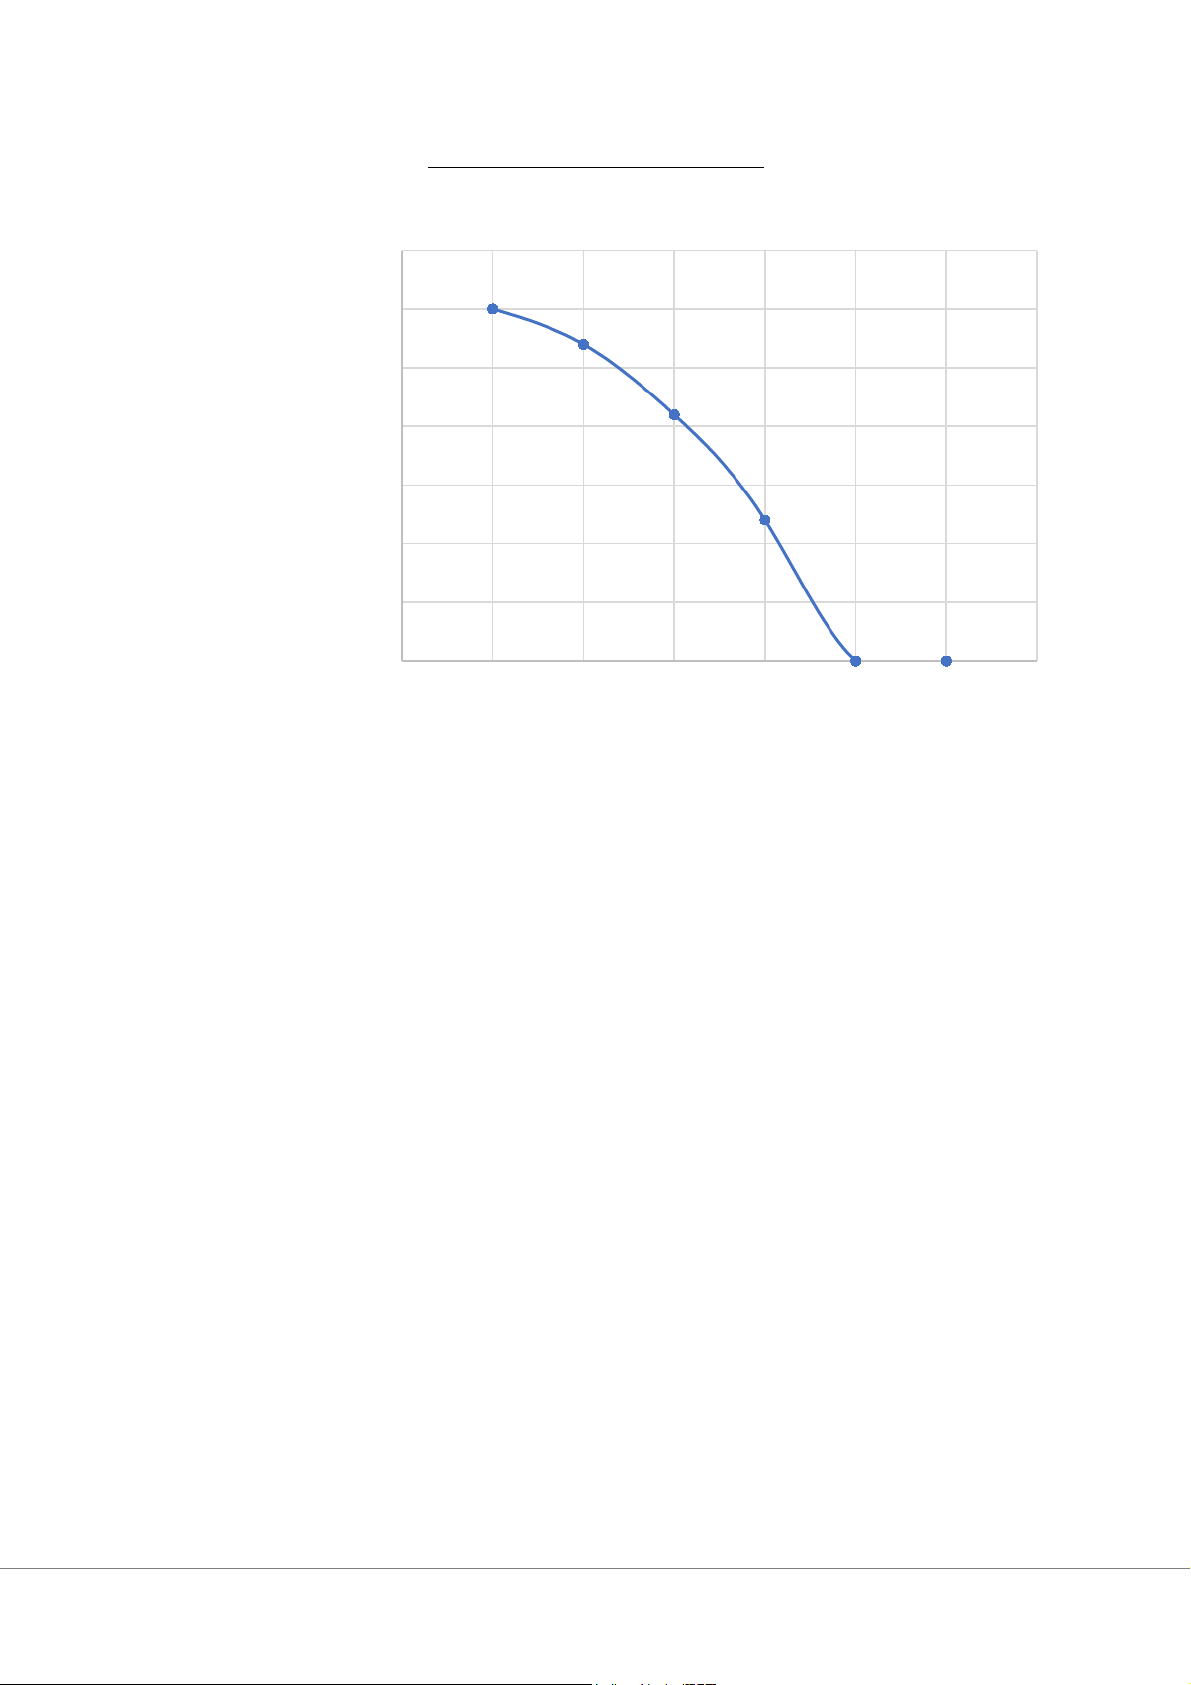
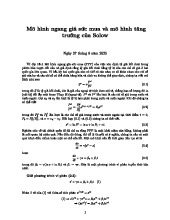
Group assignment presentation 1 Exercise 1: 35 30 30 27 25 21 20 Guided missiles 15 12 10 5 0 0 0 01234567 Cars
a. The opportunity costs for the production of missiles are increasing. -
From point E to D, the opportunity cost of increasing output from 0 to 12 thousand guided
missiles is 2 million cars (from 8 to 6), and so are points D to C (from 6 to 4), C to B (from 4 to 2), B to A (from 2 to 0). -
From point A to B, B to C, C to D, D to E, the opportunity cost of increasing output of 2 million
cars is 3, 6, 9, 12 thousand guided missiles respectively.
b. If the economy is currently at point C: -
From point C to D, the opportunity cost of producing 2 million more cars is 9 thousand missiles.
®The cost of one million more cars is 9/2 = 4.5 thousand guided missiles. -
From point C to B, the opportunity cost of producing 6 thousand guided missiles is 2 million cars
®The cost of one million more cars is 2/6 = 0.33 million cars
c. Because point G is inside the curve of the graph, it indicates that the economy does not use the
maximum of resources. This means resources are wasted, which leads to an inefficiency. d. -
Because point H lies outside the PPF curve, it is impossible to attain. -
Economic growth must occur to attain the level of production indicated by point H, especially
through better input resources and developed technology. e. -
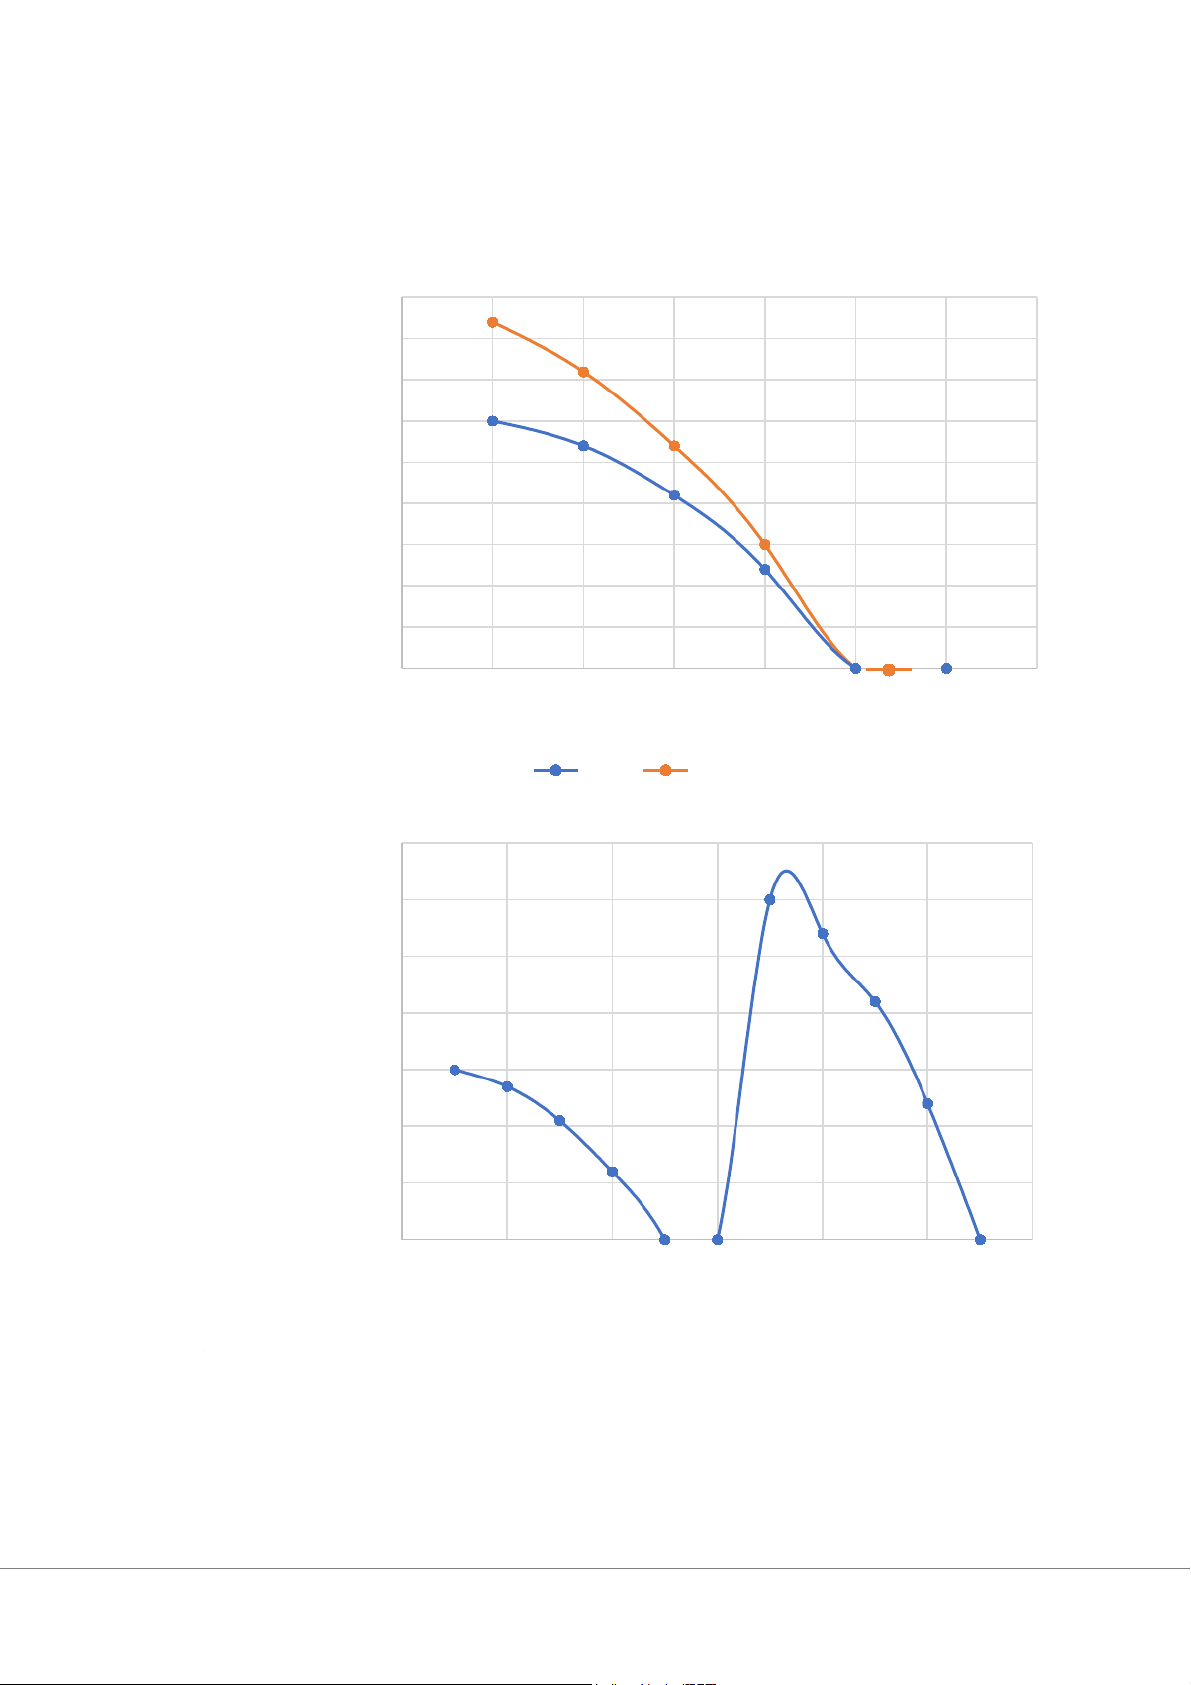
Improvement occurs in the technology of producing guided missiles but not in the production of cars: 45 42 40 36 35 30 30 27 27 25 Guided missiles 20 21 15 15 12 10 5 0 0 00 0 01234567 Cars Before After -
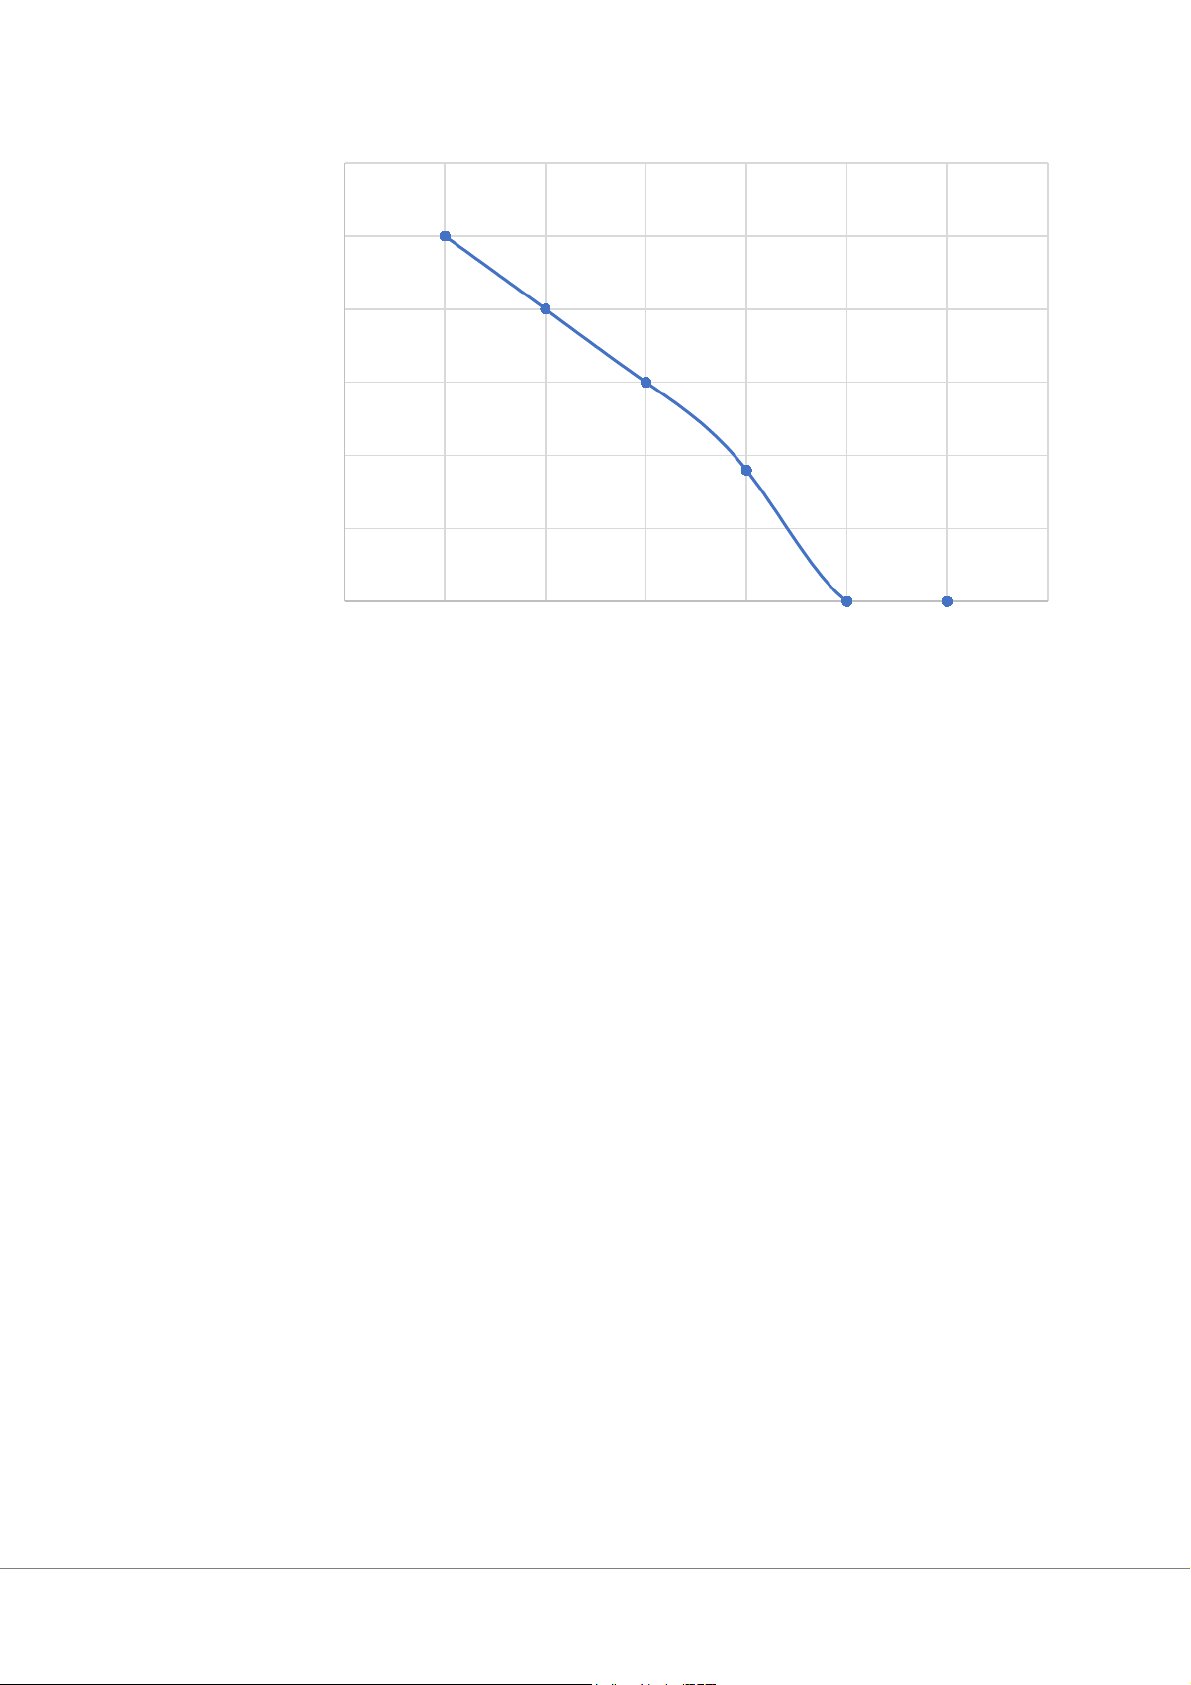
Technological improvement in the production of both products: 70 60 60 54 50 42 40 Guided missiles 30 30 27 24 20 21 12 10 0 0 0 0 0 2 4 6 8 10 12 Cars Exercise 2: a. 30 25 25 20 20 15 15 Output of wheat 10 9 5 00 001234567 Output of cloths
b. If output of wheat and cloths are 9 tons of wheat and 4000 set of cloths, the productive of this
economy is not allocative efficient. If it produces 9 tons of wheat, the maximum it can produce is
9000 set of cloths or if it produces 4000 set of cloths, the maximum it can produce is 20 tons of wheat.
c. This economy is impossible to produce 20 tons of wheat and 10000 set of cloths. If it produces 20
tons of wheat, the maximum it can produce is only 4000 set of cloths or if it produces 10000 set
of cloths, there is no wheat can be produced. d. -
From point B to A, the opportunity costs of producing 5 more tons of wheat are 4000 set of cloths
® The opportunity costs of producing 1 ton of wheat are 4/5 thousand set of cloths
From point A to B, the opportunity costs of producing 4000 set of cloths are 5 tons of wheat ®
The opportunity costs of producing 1000 set of cloth are 5/4 tons of wheat -
From point C to B, the opportunity costs of producing 5 more tons of wheat are 3000 set of cloths
® The opportunity costs of producing 1 ton of wheat are 3/5 thousand set of cloths
From point B to C, the opportunity costs of producing 3000 set of cloths are 5 tons of wheat ®
The opportunity costs of producing 1000 set of cloth are 5/3 tons of wheat -
From point D to C, the opportunity costs of producing 6 more tons of wheat are 2000 set of cloths
® The opportunity costs of producing 1 ton of wheat are 1/3 thousand set of cloths
From point C to D, the opportunity costs of producing 2000 set of cloths are 6 tons of wheat ®
The opportunity costs of producing 1000 set of cloth are 3 tons of wheat -
From point E to D, the opportunity costs of producing 9 more tons of wheat are 1000 set of cloths
® The opportunity costs of producing 1 ton of wheat are 1/9 thousand set of cloths
From point D to E, the opportunity costs of producing 1000 set of cloths are 9 tons of wheat ®
The opportunity costs of producing 1000 set of cloth are 9 tons of wheat
Tài liệu liên quan:
-

Sách Bài Tập Vi Mô - Hướng Dẫn và Lời Giải Chi Tiết
11 6 -

Nguyên lý chiến lược kinh doanh - Bài giảng môn Kinh tế vi mô | Trường Đại học Kinh Tế Quốc Dân
11 6 -

Chương 7 các kỹ thuật lựa chọn chiến lược - Bài giảng môn Kinh tế vi mô | Trường Đại học Kinh Tế Quốc Dân
12 6 -
Tổng hợp câu hỏi trắc nghiệm theo chương ôn tập môn Kinh tế vi mô | Trường Đại học Kinh Tế Quốc Dân
17 9 -
Lý thuyết ngang giá sức mua môn Kinh tế vi mô | Trường Đại học Kinh Tế Quốc Dân
10 5