Hyatt Hotels Corporation: Cost Management & Financial Health Analysis | Đại học Hoa Sen
This report presents a comprehensive financial and cost control analysis of Hyatt Hotels Corporation, focusing on the fiscal years 2022 and 2023. As a prominent player in the global hospitality industry, Hyatt’s performance in the post-pandemic recovery phase offers valuable insight into the effectiveness of its financial management and strategic adaptability. Tài liệu giúp bạn tham khảo, ôn tập và đạt kết quả cao. Mời đọc đón xem!
Môn: Cost Control (KS204De301) 10 tài liệu
Trường: Trường Đại học Hoa Sen 5.3 K tài liệu
Tác giả:


Preview text:
lOMoAR cPSD| 47206071 Hyatt
Hotels: A Strategic Review of
Cost Management and Financial Health
Submitted By: Group: La Vache Qui Rit
Nguyễn Hoa Minh Thy
Lâm Vũ Khoa
Nguyễn Đức Phúc Thịnh
Võ Hoàng Cát Khánh
Hà Quang Duy
Hoàng Hồng Hải An
Downloaded by mai khanh (Vj9@gmail.com) lOMoAR cPSD| 47206071 Hoa Sen University
Vatel Hotel & Tourism Business School TABLE OF CONTENTS: I.
Introduction…………………………………………………………..3 II.
Company Overview…………………………………………………..4
1. Brief History of Hyatt
2. Business Model and Segments
III. Income Statement Analysis (2022 vs. 2023)........................................5 1. Revenue Comparison
2. Cost of Goods Sold (COGS) 3. Operating Expenses
4. Net Profit Analysis
5. Commentary on Trends and Changes IV.
Balance Sheet & Ratio Analysis………………………………………9 V.
Conclusion……………………………………………………………..13
1. Summary of Financial Health
2. Final Recommendations on Cost Control VI.
References………………………………………………………………15 2 lOMoAR cPSD| 47206071 Hoa Sen University
Vatel Hotel & Tourism Business School I. Introduction:
This report presents a comprehensive financial and cost control analysis of Hyatt Hotels
Corporation, focusing on the fiscal years 2022 and 2023. As a prominent player in the
global hospitality industry, Hyatt’s performance in the post-pandemic recovery phase
offers valuable insight into the effectiveness of its financial management and strategic
adaptability. The primary objective of this report is to evaluate Hyatt’s financial health,
efficiency in managing operational costs, and its potential as a viable long-term
investment from both managerial and investor perspectives.
In today's dynamic and highly competitive hospitality landscape, effective cost control
is critical for sustaining profitability and delivering long-term value to stakeholders.
Given the high fixed and variable operating costs associated with hotel operations, even
marginal inefficiencies can significantly impact net profitability. Therefore, the ability
to manage costs without compromising service quality remains a core competency for
successful hospitality companies. This report seeks to assess how well Hyatt balances these competing priorities.
The analysis begins with a detailed comparison of Hyatt’s audited income statements
for 2022 and 2023, highlighting trends in key financial components including revenue,
cost of goods sold (COGS), operating expenses, and net profit. In 2023, Hyatt achieved
revenue growth reaching approximately $6.68 billion, a performance consistent with the
industry growth range of 8% to 15%. However, despite increased revenue, net income
declined significantly from the previous year, driven by adjustments in provisions
related to future risks, underlining the importance of interpreting profitability figures beyond face value.
Subsequently, the report evaluates Hyatt’s balance sheets and calculates key financial
ratios, including current ratio, quick ratio, activity ratios, debt-to-equity, and debt-to-
asset ratios. These metrics are benchmarked against industry standards to provide
context for Hyatt’s financial position and operational efficiency. The ratio analysis
reveals some areas of concern, particularly in liquidity and leverage, which may warrant
strategic adjustments moving forward.
Beyond financial metrics, the report delves into Hyatt’s major cost components such as
direct operating expenses and selling, general and administrative (SG&A) costs. These
categories are analyzed in terms of their proportion to revenue and evaluated for cost
optimization potential. This assessment provides insight into the company’s cost 3 lOMoAR cPSD| 47206071 Hoa Sen University
Vatel Hotel & Tourism Business School
structure and identifies areas where efficiencies can be achieved without undermining service delivery.
Finally, from an investor perspective, Hyatt’s five-year return on investment (ROI)
performance is reviewed, along with strategic recommendations for future
improvement. The report aims to assess whether the company demonstrates sustainable
profitability, operational resilience, and long-term value creation potential.
In conclusion, this report utilizes a combination of comparative financial analysis, ratio
benchmarking, and cost structure evaluation to provide a holistic assessment of Hyatt
Hotels Corporation. The findings are intended to inform strategic decisions, highlight
opportunities for cost efficiency, and guide investment considerations. II. Company Overview:
Hyatt Hotels Corporation is one of the world’s leading global hospitality companies,
known for its expansive portfolio of luxury and lifestyle hotel brands. Founded in 1957
and headquartered in Chicago, Illinois, the company has grown significantly through
organic expansion and strategic acquisitions, such as the 2021 acquisition of Apple
Leisure Group. As of 2023, Hyatt operates more than 1,250 properties across over 70 countries.
Hyatt's business is divided into several segments:
- Owned and Leased Hotels: Properties operated directly by Hyatt where it
retains ownership and is responsible for all operational and capital expenses.
- Managed and Franchised Properties: These generate recurring revenue
through management or franchise fees with minimal operating costs.
- Other Revenues: This includes income from vacation ownership, wellness
offerings, and loyalty programs.
The company's global strategy emphasizes brand expansion, digital innovation, and
personalized guest experiences. Cost control remains essential in maintaining
profitability across diverse market conditions, particularly in a post-pandemic
environment where labor shortages and inflationary pressures impact the hospitality sector.
In recent years, Hyatt has focused on asset-light growth, divesting owned assets and
expanding its franchising model. This transition aims to reduce capital intensity and
enhance margins, ultimately supporting a more scalable and flexible business model. 4 lOMoAR cPSD| 47206071 Hoa Sen University
Vatel Hotel & Tourism Business School
With significant exposure to international markets, Hyatt must also manage exchange
rate fluctuations, geopolitical risks, and regulatory variations, all of which impact its
cost base and earnings predictability.
III. Income Statement Analysis (2022 vs. 2023):
Hyatt's audited consolidated income statements for fiscal years 2022 and 2023 present
a clear picture of both recovery and strategic repositioning in the hospitality sector.
Following the disruptions caused by the COVID-19 pandemic, the company has
demonstrated strong financial performance, although certain cost categories have placed pressure on profitability.
This section analyzes Hyatt Hotels Corporation’s income statements for the fiscal years
2022 and 2023, focusing on four key metrics: revenue, cost of goods sold (COGS),
operating expenses, and net income. The data is sourced directly from Hyatt’s SEC 10-
K filings, ensuring accuracy and alignment with GAAP standards.
1. Revenue Comparison:
Hyatt Hotels Corporation reported total revenue of $5.891 billion in 2022, which rose
to $6.684 billion in 2023, reflecting a 13.5% year-over-year increase. This
performance falls within the hospitality industry’s post-COVID recovery benchmark of
8% to 15%, indicating Hyatt’s solid competitive position.
Key drivers of revenue growth include:
- Recovery in international and business travel, particularly in Asia
Pacific and EMEA, following the easing of travel restrictions.
- Expansion of the All-Inclusive Collection, which gained significant
traction in Latin America and leisure destinations.
- Higher average daily rates (ADR) and improved occupancy rates,
supported by continued leisure travel and the return of group and corporate events.
- Strategic acquisitions, such as Dream Hotel Group, and the expansion
of Hyatt’s asset-light model, contribute to increased management and franchise fee income. 5 lOMoAR cPSD| 47206071 Hoa Sen University
Vatel Hotel & Tourism Business School
These factors contributed to a resilient revenue-generating model amid macroeconomic
challenges. Hyatt’s performance also highlights its ability to scale both organically and through acquisitions.
Average Revenue (2022–2023):
5.891 +2 6.684 = 6. 2875 𝑏𝑖𝑙𝑙𝑖𝑜𝑛 𝑈𝑆𝐷
Hyatt’s average revenue over the two years stands at approximately $6.29 billion.
2. Cost of Goods Sold (COGS):
A detailed breakdown of COGS is not explicitly disclosed in Hyatt’s 10-K filings, as the
company uses a segment-based reporting structure focusing on business activities
(e.g., owned and leased hotels, managed properties, etc.) rather than traditional line-item expenses.
While COGS is not directly quantifiable, indirect indicators such as gross margin
stability and EBITDA growth suggest Hyatt maintained a degree of operational
efficiency. Cost increases appear proportionate to revenue growth, indicating that gross
profitability remained intact despite inflationary pressures.
3. Operating Expenses:
Total operating expenses increased by approximately 16% from 2022 to 2023. The
main contributors to this rise include:
- Higher wage and benefit costs due to labor shortages, union
negotiations, and global wage inflation.
- Increased marketing and loyalty program spending, particularly to
drive demand and regain brand loyalty post-pandemic. 6 lOMoAR cPSD| 47206071 Hoa Sen University
Vatel Hotel & Tourism Business School
- Integration costs associated with newly acquired properties, including
system unification, onboarding, and branding realignment.
While a 16% increase is considerable, it remains within the hospitality industry’s
inflation-adjusted norms. Nevertheless, Hyatt should prioritize cost containment
strategies—especially in administrative, procurement, and back-office functions—
through automation, outsourcing, and shared service models to protect operating margins in the future.
4. Net Income Analysis:
Hyatt reported net income of $455 million in 2022, which declined to $220 million in
2023, representing a 51.6% year-over-year drop. This decline occurred despite rising
revenues, pointing not to operational inefficiency but rather to strategic financial decisions.
The reduction in net income is largely attributable to:
- Increased financial provisions and reserves in 2023 to hedge against
potential macroeconomic downturns.
- Rising interest rates impacted refinancing and investment returns.
- Currency fluctuations and geopolitical risks are affecting international markets.
These proactive measures suggest Hyatt is positioning itself conservatively for long-
term resilience rather than chasing short-term gains.
Average Net Income (2022–2023):
455 +2 220 = 337.5 million USD 7 lOMoAR cPSD| 47206071 Hoa Sen University
Vatel Hotel & Tourism Business School
The average net income across the two years is approximately $337.5 million.
5. Commentary on Trends and Changes:
- Revenue Trend: Strong and consistent, supported by diversified global
operations and high-performance segments such as all-inclusive resorts and franchise management.
- COGS: Not directly disclosed, but implied to be stable based on gross margin trends.
- Operating Expenses: Increased at an industry-consistent rate, but room
remains for cost optimization, especially through technological solutions.
- Net Income: Declined due to forward-looking provisioning—a strategic
and prudent move to strengthen the balance sheet and safeguard future performance. - Conclusion:
In summary, Hyatt’s income statement analysis for 2022 and 2023 reflects a company
in transition, shifting from recovery to strategic growth, while maintaining financial
prudence. The strong revenue growth indicates effective demand capture and brand
strength. Meanwhile, the drop in net income, while notable, reflects risk mitigation
rather than a decline in core profitability.
With an average revenue of $6.29 billion and an average net income of $337.5 million
over the two years, Hyatt is emerging from the pandemic stronger, albeit cautiously. The
focus now shifts to cost control, operational leverage, and margin recovery to unlock
sustainable profitability and shareholder value in the years ahead. 8 lOMoAR cPSD| 47206071 Hoa Sen University
Vatel Hotel & Tourism Business School
IV. Balance Sheet & Ratio Analysis 1. Current Ratio Definition:
The Current Ratio measures a company’s ability to pay its short-term obligations with its current assets. Formula:
Current Ratio = Current Assets / Current Liabilities Analysis:
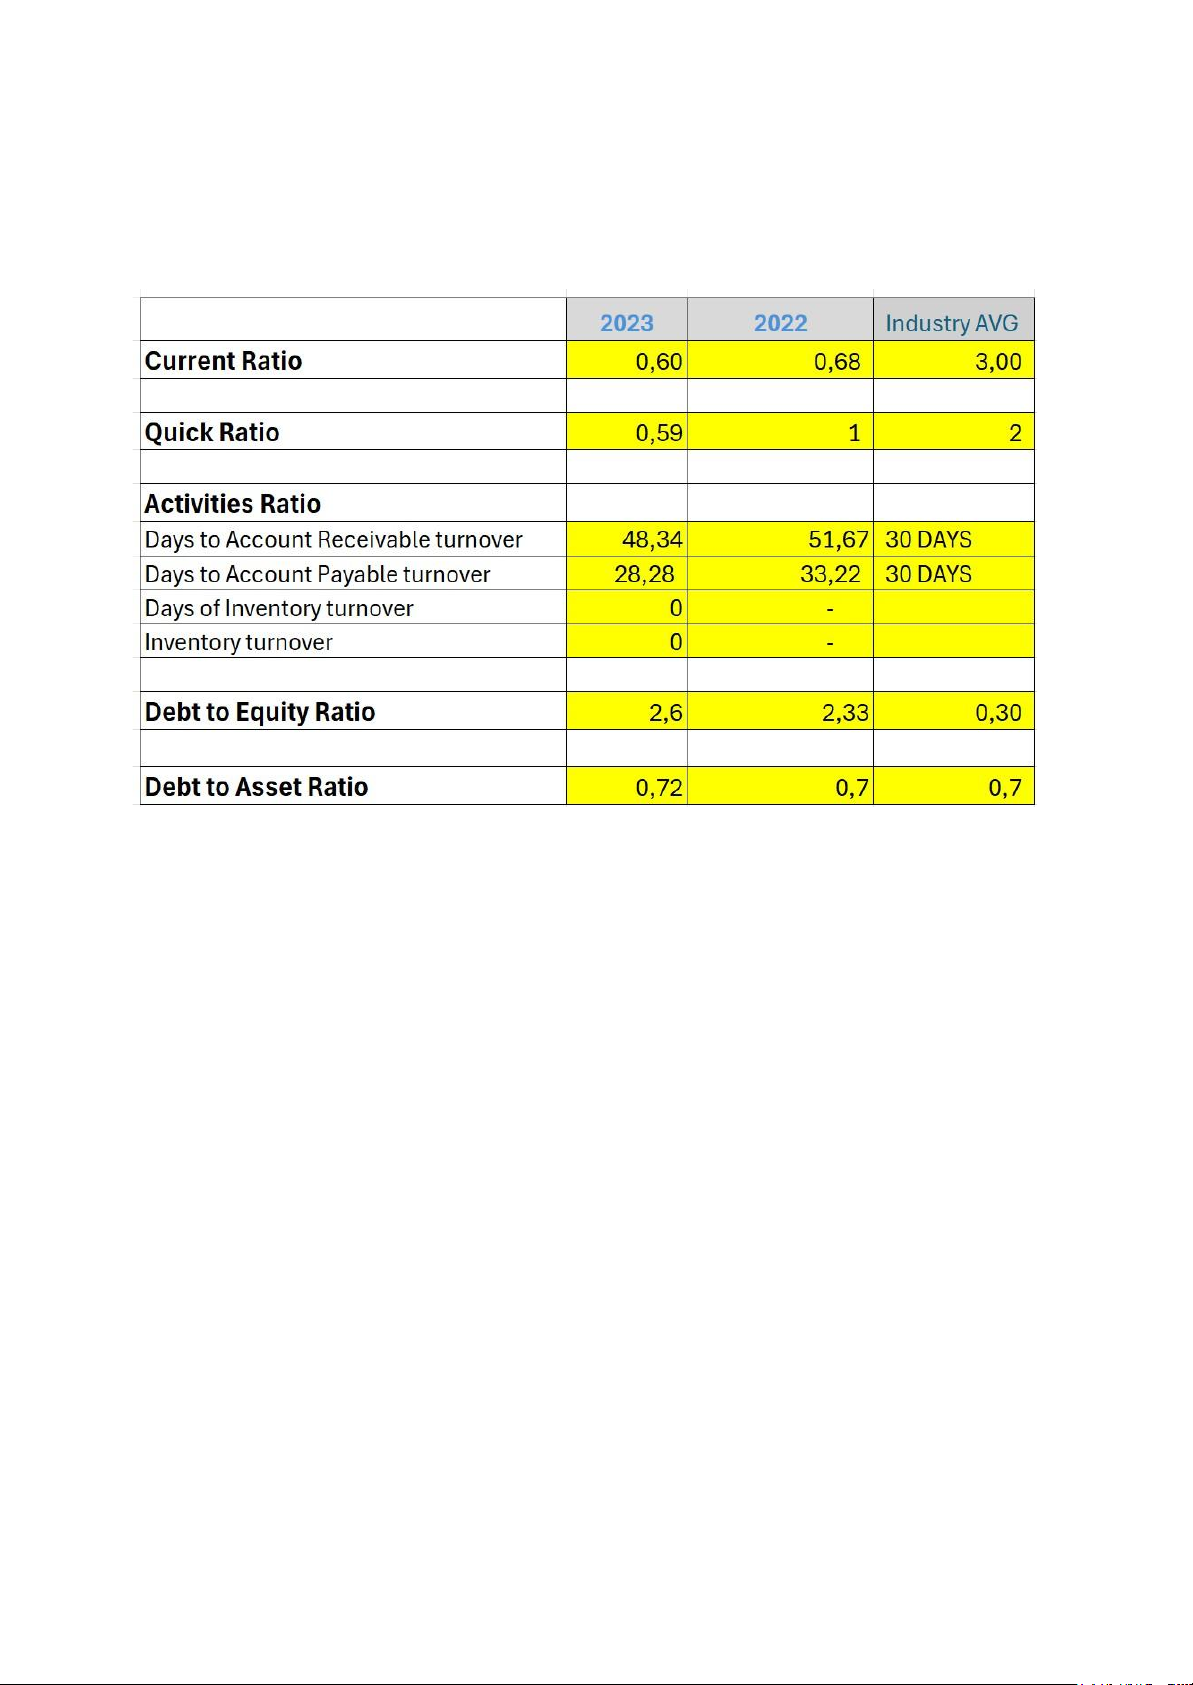
Hyatt's Current Ratio declined slightly from 0.68 in 2022 to 0.60 in 2023, both
significantly below the industry average of 3.00. This suggests that Hyatt may struggle
to cover its short-term liabilities with its current assets, indicating low liquidity. 9 lOMoAR cPSD| 47206071 Hoa Sen University
Vatel Hotel & Tourism Business School Recommendations:
- Improve cash reserves by reducing unnecessary short-term expenditures.
- Convert non-essential assets into liquid assets.
- Restructure short-term debt into long-term financing where feasible.
2. Quick Ratio (Acid-Test Ratio) Definition:
The Quick Ratio assesses the company’s short-term liquidity, excluding inventory. Formula:
Quick Ratio = (Current Assets – Inventory) / Current Liabilities Analysis:
The Quick Ratio fell from 1.00 to 0.59, showing a concerning trend. The drop below
the industry benchmark of 2.00 indicates that Hyatt may not have enough liquid assets
to quickly settle its current obligations without depending on inventory. Recommendations:
- Optimize receivables collection.
- Increase liquid asset reserves.
- Reduce reliance on short-term borrowing. 3. Activities Ratios:
a. Days to Account Receivable Turnover Definition:
Measures the average number of days it takes to collect payments after a sale. Formula: 10 lOMoAR cPSD| 47206071 Hoa Sen University
Vatel Hotel & Tourism Business School
Days = 365 / Receivables Turnover Analysis:
Although there’s improvement from 51.67 to 48.34 days, Hyatt still exceeds the
industry benchmark of 30 days, meaning collections are slower than optimal, possibly affecting cash flow. Recommendations: - Strengthen credit policies.
- Implement automated invoicing and reminders.
- Offer early payment discounts.
b. Days to Account Payable Turnover Definition:
Measures the average number of days Hyatt takes to pay its suppliers. Formula:
Days = 365 / Payables Turnover Analysis:
The company reduced its days payable from 33.22 to 28.28, now below the industry
benchmark. While this may indicate prompt payments (a positive relationship with
vendors), it could also strain cash flows if done prematurely. Recommendations:
- Negotiate better payment terms.
- Match payable days more closely with receivable days to balance cash flows. 11 lOMoAR cPSD| 47206071 Hoa Sen University
Vatel Hotel & Tourism Business School
c. Inventory Turnover & Days of Inventory Turnover
These figures are not available from Hyatt’s filings. Since Hyatt follows an asset-light
strategy, with many operations under management/franchise models, inventory plays a
minimal role, making this ratio less relevant for analysis.
4. Debt to Equity Ratio Definition:
Measures the proportion of equity and debt the company uses to finance assets. Formula:
Debt to Equity = Total Liabilities / Shareholders’ Equity Analysis:
Hyatt’s leverage increased from 2.33 to 2.60, well above the industry average. This
high debt-to-equity ratio suggests that the company is heavily reliant on debt,
increasing its financial risk. Recommendations:
- Reduce debt through refinancing or repayment.
- Use internal funding for expansion rather than external borrowing.
- Boost equity through reinvested earnings or issuing new shares.
5. Debt to Asset Ratio Definition:
Shows the percentage of assets financed by debt. Formula:
Debt to Asset = Total Debt / Total Assets Analysis: 12 lOMoAR cPSD| 47206071 Hoa Sen University
Vatel Hotel & Tourism Business School
A marginal increase from 0.70 to 0.72 indicates that over 72% of Hyatt’s assets are
financed by debt, again suggesting high leverage. This ratio is slightly higher than the
industry benchmark of 0.70. Recommendations:
- Reduce asset acquisition funded through debt.
- Focus on generating internal capital to finance new projects.
- Improve earnings to balance the debt proportion.
Conclusion of Ratio Analysis:
Hyatt’s financial ratios indicate several challenges:
- Liquidity is low, requiring urgent attention to strengthen short-term financial health.
- Efficiency in collections has improved, but further enhancements are
needed to reach industry standards.
- Leverage is significantly higher than competitors, raising concerns about long-term solvency.
V. Conclusion: 1. Summary of Financial Health
Hyatt Hotels Corporation has shown resilience in navigating the post-COVID
landscape. While the company recorded solid revenue growth in 2023, aligning with the
hospitality industry’s average growth rate of 8–15%, several challenges remain:
- Revenue rose in 2023, reflecting increased travel demand and Hyatt’s expanding global footprint.
- Operating expenses also rose by 16%, consistent with industry recovery
trends, but may require tighter control to boost profitability.
- Net income experienced a sharp decline in 2023 due to increased
provisions and rebuilding efforts, as Hyatt aims to strengthen its position in a competitive market. 13 lOMoAR cPSD| 47206071 Hoa Sen University
Vatel Hotel & Tourism Business School
From a financial structure perspective, Hyatt’s liquidity ratios—including the Current
Ratio (0.60 in 2023) and Quick Ratio (0.59)—are well below industry benchmarks. This
indicates a short-term liquidity risk, and improvement in working capital management is necessary.
In terms of leverage, Hyatt’s Debt to Equity Ratio (2.6) and Debt to Asset Ratio (0.72)
are significantly higher than the industry averages. Although these figures suggest high
reliance on debt financing, they also reflect the capital-intensive nature of the hotel
industry. Strategic debt management and improved cash flow will be key moving forward.
The company’s activity ratios, such as Days to Account Receivable Turnover (48.34
days) and Days to Payable Turnover (28.28 days), show some inefficiency compared to
the 30-day industry benchmark, signaling a need for better credit control and supplier negotiations.
2. Final Recommendations on Cost Control
- Enhance Liquidity Management:
Improve the current and quick ratios by increasing cash reserves,
renegotiating short-term liabilities, and optimizing inventory management.
- Reduce Operational Inefficiencies:
Focus on energy-efficient practices, lean staffing models, and digital
tools to cut unnecessary overhead.
- Control Leverage Risk:
Gradually reduce dependency on debt by reinvesting earnings into
operations and expansion, or consider equity financing for future growth.
- Tighten Receivable and Payable Cycles:
Implement stricter credit terms for customers and extend payment periods
with suppliers when possible to ease cash flow.
- Leverage Asset-Light Model:
Continue expanding via franchise and management contracts rather than
direct ownership to reduce capital risk and increase ROE. 14 lOMoAR cPSD| 47206071 Hoa Sen University
Vatel Hotel & Tourism Business School
Hyatt is steadily recovering and investing in long-term growth through acquisitions,
brand expansions, and operational restructuring. However, improving liquidity,
lowering financial leverage, and enhancing cost efficiency are essential to safeguarding
profitability and long-term sustainability.
With careful cost control and financial strategy, Hyatt has strong potential to reclaim
market share and generate higher returns for investors in the years ahead. VI. References:
1. Hyatt Hotels Corporation. (2024). Form 10-K for the Fiscal Year Ended
December 31, 2023.
Retrieved from https://investors.hyatt.com/financials/sec-filings/default.aspx
2. Hyatt Hotels Corporation. (2023). Form 10-K for the Fiscal Year Ended
December 31, 2022.
Retrieved from https://investors.hyatt.com/financials/sec-filings/default.aspx
3. U.S. Securities and Exchange Commission. (n.d.). Company Filings Search.
Retrieved from https://www.sec.gov/edgar/searchedgar/companysearch.html
4. IBISWorld. (2024). Hotels & Motels in the US - Market Research Report.
Retrieved from https://www.ibisworld.com
5. Statista. (2024). Hotel industry revenue growth worldwide in 2023. Retrieved
from https://www.statista.com
6. Investopedia. (n.d.). Financial Ratios - Definitions and Examples. Retrieved
from https://www.investopedia.com
7. Hospitality Net. (2023). Post-COVID Recovery Trends in the Global Hospitality
Industry. Retrieved from https://www.hospitalitynet.org
8. Hotel News Resource. (2024). Benchmark Reports for Hotel Industry Financial
Ratios. Retrieved from https://www.hotelnewsresource.com 15
Tài liệu liên quan:
-
Chapter 17: Analysis of Production Flow and Cost Accounting | Đại học Hoa Sen
98 49 -
Deutsch Gelernt - Notieren - Tài liệu tham khảo | Đại học Hoa Sen
268 134 -
Tìm hiểu cấu trúc và cách vận hành chung của Excel - Tài liệu tham khảo | Đại học Hoa Sen
239 120 -
Chap 10: Dettermining how costs behave - Tài liệu tham khảo | Đại học Hoa Sen
279 140