Ijsom Volume 5 Issue 4 Pages 361-378 - Tài liệu tham khảo | Đại học Hoa Sen
Ijsom Volume 5 Issue 4 Pages 361-378 - Tài liệu tham khảo | Đại học Hoa Sen và thông tin bổ ích giúp sinh viên tham khảo, ôn luyện và phục vụ nhu cầu học tập của mình cụ thể là có định hướng, ôn tập, nắm vững kiến thức môn học và làm bài tốt trong những bài kiểm tra, bài tiểu luận, bài tập kết thúc học phần, từ đó học tập tốt và có kết quả cao cũng như có thể vận dụng tốt những kiến thức mình đã học.
Môn: hệ thống thông tin quản lý(02) 32 tài liệu
Trường: Trường Đại học Hoa Sen 5.3 K tài liệu
Tác giả:


Preview text:
International Journal of Supply and Operations Management IJSOM
November 2018, Volume 5, Issue 4, pp. 361-378 ISSN-Print: 2383-1359 ISSN-Online: 2383-2525 www.ijsom.com
Purchasing Planning and Order Allocation in the Pharmaceutical Sustainable Supply Chain
Using the Theoretical-Graph (GT-MP- DM)
(Case Study: Supplying the clotting factor for patients with hemophilia)
Mahdi Moradi*, aand Fariborz Jolai a
a College of Industrial Engineering, Campus of Technical Colleges, University of Tehran, Tehran, Iran Abstract
In view of the growing environmental consciousness among product users, the issue of product sustainability is one of
the challenging tasks being faced by product designers, manufacturers, environmentalists, and decision makers. This
article presents a framework for supplier selection from a sustainability perspective. Along with the sustainability criteria,
the other criteria and sub-criteria involved in the selection of drug suppliers for patients with hemophilia are investigated,
too. Regarding the significance of the clotting agents in the health and life of hemophilia patients, it is especially important
to provide and supply this drug from the safe companies and to consider the amount of ordering. The criteria and sub-
criteria studied in this article were investigated and concluded through library studies, filed assessments of the experts’
comments. For the case study, the desired supplier is determined and the others are ranked through the Graph Theoretical
Matrix Permanent Decision Making (GT-MP-DM) Approach. Finally, with presenting the bi-objective mathematical
model, the amount of order to the suppliers is determined and then the model is solved by means of fuzzy MAX-MIN
method and GAMS software; the model is validated by sensitivity analysis.
Keywords: Pharmaceutical Supplier selection; Sustainable supply chain; Hemophilia patients; Fuzzy Graph Theoretical
Approach; Multi Criteria Decision Making. 1. Introduction
Today, the healthcare management industry faces financial challenges and expenditures more than ever. In the U.S., for
example, healthcare cost was $3.09 trillion in 2014, and estimated to rise to $3.57 trillion in 2017. Statistics of the
healthcare market in the U.S. reveal that about 12.9% of the major cost of healthcare in 2014 was attributed to the
pharmaceutical industry (http://www.plunkettresearch.com/health-care-medical-market-research/industry-trends). The
industry can be defined as series of operations, processes, and interactions between organizations for discovering,
developing and producing medications and drugs (Shah, 2004). Pharmaceutical firms are basically obliged by the
powerful regulatory market forces to rethink the way they produce and distribute products, as well as to reimagine the
role of the supply chain in driving strategic growth, brand differentiation, and economic value in the health system
(Mehralian et al., 2012). The pharmaceutical supply chain needs more consideration compared with other industries such
as customized demand of customers, market dynamic factors, weak networks, and governmental policies (Vishwakarma
et al., 2016). Assuring the continuous flow of drugs to patients at optimal prices and with minimal delays, insignificant
shortages with no errors is valuable in pharmaceutical supply chains (Mehralian et al., 2016).
Corresponding author email address: mahdimoradi1362@yahoo.com 361 Moradi and Jolai
Designing sustainable supply chains, companies must review the impact of supply chain operations on the environment
and society because of the increasing environmental, legislative, and social considerations (Govindana et al., 2013).
Sustainability is based on economic, environmental, and social dimensions for human development (Ageron et al., 2012; Gopalakrishnan et al., 2012).
The purpose of this study is, therefore, to select a pharmaceutical supplier according to the main concepts of sustainability,
i.e. economic, environmental, and social. To this end, we selected and assessed the suppliers with examining the criteria
and sub-criteria and using the permanent matrix theoretical graph method; since the studied products are blood factors 7,
8, and 9 fundamentally required by hemophilia patients and used in order to prevent from the internal and external
bleedings, only the four suppliers available in four countries of the world were investigated. We aimed to select the best
supplier and the order allocation of the clotting factor for hemophilia patients. The rest of the paper is organized as
follows: Section 3 presents a comprehensive review of a multi-criteria decision-making technique called Graph Theoretic
Matrix Permanent Decision Making (GT-MP-DM). A brief description of its method and current plans are provided. The
weights obtained from the first part have been used as the coefficients of one of the model’s purposes in the multi-target
model. In Section 4, a mathematical model including bi-objectives such as maximizing the purchase value, minimizing
the total cost of purchasing drug, minimizing order costs, and minimizing the costs of maintaining drug in the hospital is
proposed. Then, considering restrictions like the supplier capacity and meeting the buyer’s demand, we have allocated
the orders to the suppliers. The solution approach to the sustainable pharmaceutical network model is described in Section
5. To check this model with a real data in a case study, supplying the clotting factor for patients with hemophilia, one of
the main pharmaceutical suppliers is chosen and the others are being ranked. Then the order is allocated with the
mathematical model, and the model is solved by means of fuzzy MAX-MIN method and GAMS software. The model is
validated by sensitivity analysis in Section 6. Finally, Section 7 presents the results and conclusions of the research and
suggests some potential works as future studies in the field. Identify Order Generate sustainable Calculating The best Solving criteria allocatin Start supplier selection permanent supplier model with END &sub- to diagraph matrix matrix ξ selected MAX-MIN criteria supplier Graphical Abstract
2. Review of the Literature
Most papers on supply chain management from 1990 have investigated relationships between the buyer and seller and
the supplier selection criteria. Dickson (1966) was one the first researchers who investigated this issue. Based on a
questionnaire completed by 170 purchasing manager, he determined 23 different assessment indices. Among these
criteria, price, delivery performance, and quality have been regarded as the most important assessment indices. Weber et
al. also reviewed the literature on these criteria. They investigated 74 papers on suppliers’ assessment and concluded that
quality was the most important index which was followed by delivery performance and price. Kahraman et al. (2003)
considered all criteria of suppliers, cost criteria in assessment issue, as well as selection of suppliers, and proposed the
hierarchical fuzzy analysis to choose the best suppliers. The limit method was proposed for resolving the issue. Razmi
and Ma’qoul (2009) presented the fuzzy model for several products and several periods for selecting the suppliers and
purchasing problems along with considering discounts and with capacity and budget restrictions. Esfandiari and Seyf
Barqi (2013) presented the multi-objective model to allocate the shares to suppliers when the demand depends on the
proposed price by the suppliers. Nazari et al. (2013) considered supplier selection and the issue of allocating orders
through the multi-objective two-phase linear planning. Cow et al. (2010) presented a new method based on the neural
network and a multi-optional decision-making model to select the green suppliers. Their criteria included quality, timely
delivery, and economic, social, and environmental issues. Sifisi and Boypouk Ozkan (2012) investigated a model of green
supply chain management to present the assessment framework for the green suppliers. They used a fuzzy combined
MNDM model based on fuzzy DEMATEL, ANP, and TOPSIS fuzzy technique in order to evaluate the green suppliers.
The main criteria they considered in their paper were organization, economic performance, quality of services,
technology, green competence, social responsibilities, and clean production. Conan et al. (2013) investigated the multi-
criteria fuzzy decision-making and multi-objective planning for selecting suppliers in the green supply chain based on its
economic and environmental criteria. Prasad et al. (2017) developed a hybrid methodology by combining the concepts
of Analytical Hierarchy Process (AHP), Data Enveloped Analysis (DEA), and Grey Relational Analysis (GRA) to
address the issue of supplier selection from the pool of suppliers.
Int J Supply Oper Manage (IJSOM), Vol.5, No.4 362
Purchasing Planning and Order Allocation in the Pharmaceutical Sustainable Supply ...
Thus, from the sustainability perspective , supplier selection in the development process of a new product is a
case of multi-criteria decision making (MCDM). Previously, several qualitative and quantitative factors have
been addressed for supplier selection during NPD and as such, a high degree of fuzziness and uncertainty is
always involved during supplier selection in a NPD environment (Ankush Anand et al., 2018).
Today, many researches are being conducted on the healthcare supply chain. The major challenge of the supply chain in
this context is the pressure of healthcare organizations that are seeking for an opportunity to improve the operational yield
and reduce costs in order to improve the quality. Management of healthcare supply chain is more complex than other
industries due to its influence on peoples’ health and also adequate and accurate need of the medical field for the needs
of the patient. Some different methods of supply chain have been enacted in recent years, but they have been followed
by some challenges. Some of the studies conducted in this area are briefly reviewed here. Hamelmyer (2010) studied the
routing of blood products from the blood donation centers to the hospitals in East Australia using integer modeling. Sahin
et al. (2007) used the integer modeling to resolve the locating and allocating issues in regionalization of the blood-related
services in Turkey. Candal (1980) investigated the policies of multi-objective collecting and distributing with a goal
programming method. In his paper, he pointed out that the goal programming is more understandable and its results are
easier to be confirmed compared to the simulation. Using this type of modeling, the decision-maker is able to consider
different objectives with regard to their priorities and assess the impacts of different decisions. Nagroni et al. (2012)
presented a model of optimizing the supply chain network of perishable products. Specifically, they studied a regional
blood bank system for its policies of collection, test and processing facilities, storage facilities, distribution centers as
well as demands which are usually the hospitals. Their model takes many issues of blood-related supply chains into
account including optimal allocation, risk caused by proffers, and reduction of wastes and perished products simultaneous
with the satisfaction of the illogical demands.
Based on the literature reviewed above, it seems that very few researchers and practitioners have considered
sustainability as a major criterion in supplier selection. Therefore, sustainable supplier selection is a challenging
task in a supply chain environment. Although many studies have been conducted on selecting suppliers in the
sustainable supply chain, it has not been accurately used in the healthcare area. Moreover, categorizing the criteria and
selecting suppliers is especially a new subject in this field that is proposed in the current study. In addition, identifying
the health sub-criteria in the theoretic graph method and using its results in mathematical modelling have rarely been considered by researchers.
In this paper, along with the sustainability criteria, the other criteria and sub-criteria involved in the selection of drug
suppliers for patients with hemophilia are investigated. Regarding the significance of the clotting agents in the health and
life of the hemophilia patients, it is especially important to provide and supply this drug from the safe companies and to
consider the amount of ordering. The supply chain in this study involves three levels of supply, distribution and demand
(customer) centers as shown in Figure 1. Drug Supplier PAITIENTS f HOSPITAL irms Echelon of • Echelon of supplier • Echelon of DSc • demand zone
Figure 1. The pharmaceutical supply chain network
3. The theoretic-graph model using comparing the permanent matrix with the fuzzy approach in GT-MP- DM decision-making
In this paper, we present a comprehensive review of a multi-criteria decision-making technique called GT-MP-DM. A
description of its method and current plans are also provided. GT-MP-DM originates from the combined mathematics
(mainly the graph theory and matrix inertia), has very favorable characteristics for modeling and solving complex
decision-making issues, and investigates the effectiveness of the criteria and sub-criteria for each other. The method of
Int J Supply Oper Manage (IJSOM), Vol.5, No.4 363 Moradi and Jolai
calculating the permanent matrix is similar to determinants, except that all negatives are changed into positives in
calculating determinants. We describe how to calculate the permanent matrix and procedures to resolve it below (Baykasoglu A, 2012). Advantages of Using GT-MP-DM
* The computational method used in the GT-MP-DM approach is relatively simple compared to the other multi-criteria decision-making methods.
* Unlike many other MADM methods, the GT-MP-DM approach includes dependences like ANP.
* The GT-MP-DM approach eases the critical analysis of many qualitative and quantitative features more than the other MADM techniques.
* In the permanent matrix method, a small change in the values of feature leads to significant difference in the result.
Thus, clearly the alternative ranking in descending order is easier in it.
* In addition, not only does the GT-MP-DM method provide the possibility of presenting analysis of alternatives, but
also makes it possible to visualize the current different criteria and mutual relationships among them using graphic presentations.
* The permanent matrix provides a better understanding of the criteria and description of resolving the decision-making
issue which includes all possible structural components and their relative importance.
Compared to the other MCDM methods, the applications of GT-MP-DM are rare and just a few researchers have used them in their papers.
3.1. Solving the multi-criteria decision-making problem using GT-MP-DM
1. Identifying the criteria and sub-criteria that are part of the multi-criteria decision-making problem
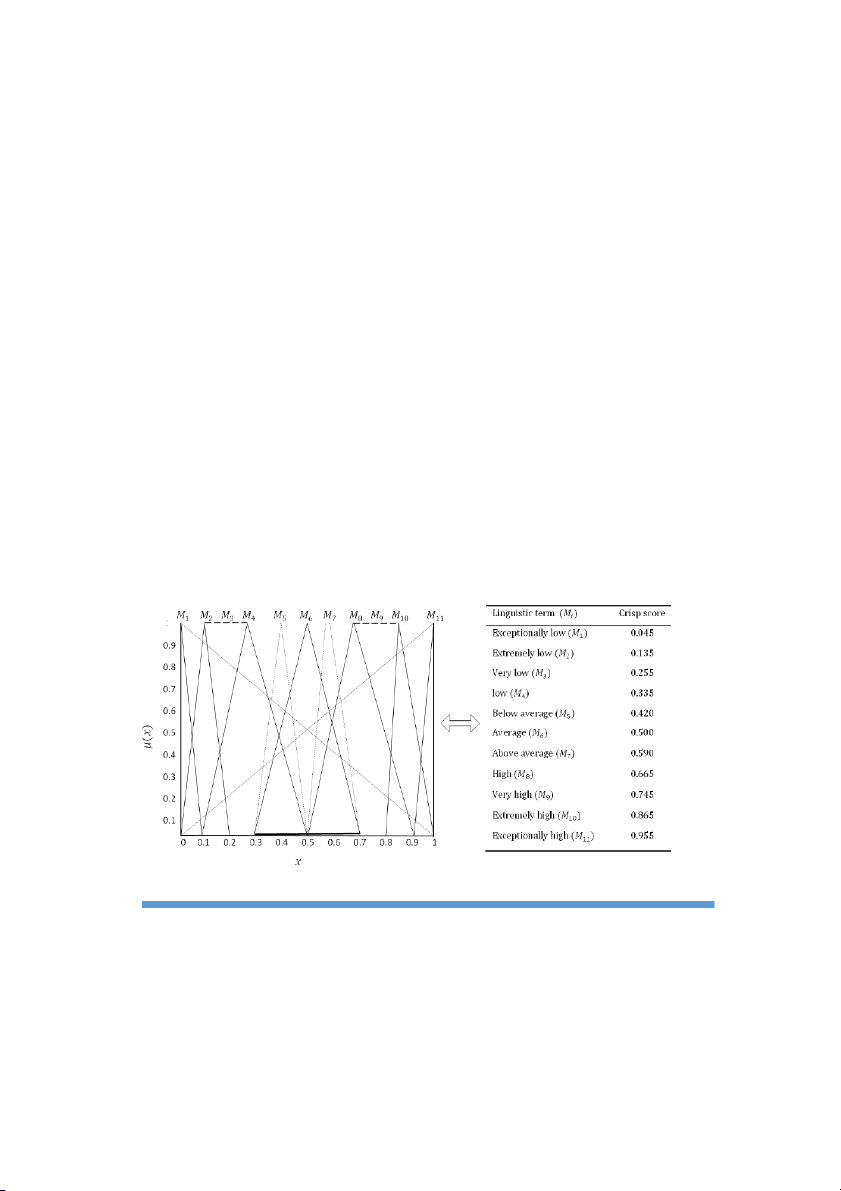
2. Forming Ψ matrix is written based on Equation 1 where its items equal to zero except the main diagonal; and on the
same main diagonal, the importance of sub-criteria for the studied supplier is written based on Figure 2. In this table,
eleven cases of fuzzy comparison have been calculated and put in order of importance.
Figure 2. Linguistic terms to fuzzy number conversation (11-point scale) for evaluating criteria scores for alter-natives
Int J Supply Oper Manage (IJSOM), Vol.5, No.4 364
Purchasing Planning and Order Allocation in the Pharmaceutical Sustainable Supply ... 𝑪 ⋯ 𝟎 𝟏𝟏 𝟎 ⋮ 𝟎 𝜳 = [ 𝟎 𝑪𝟐𝟐 ] ⋮ … ⋮ ⋮ 𝟎 … 𝟎 𝑪𝒏𝒏
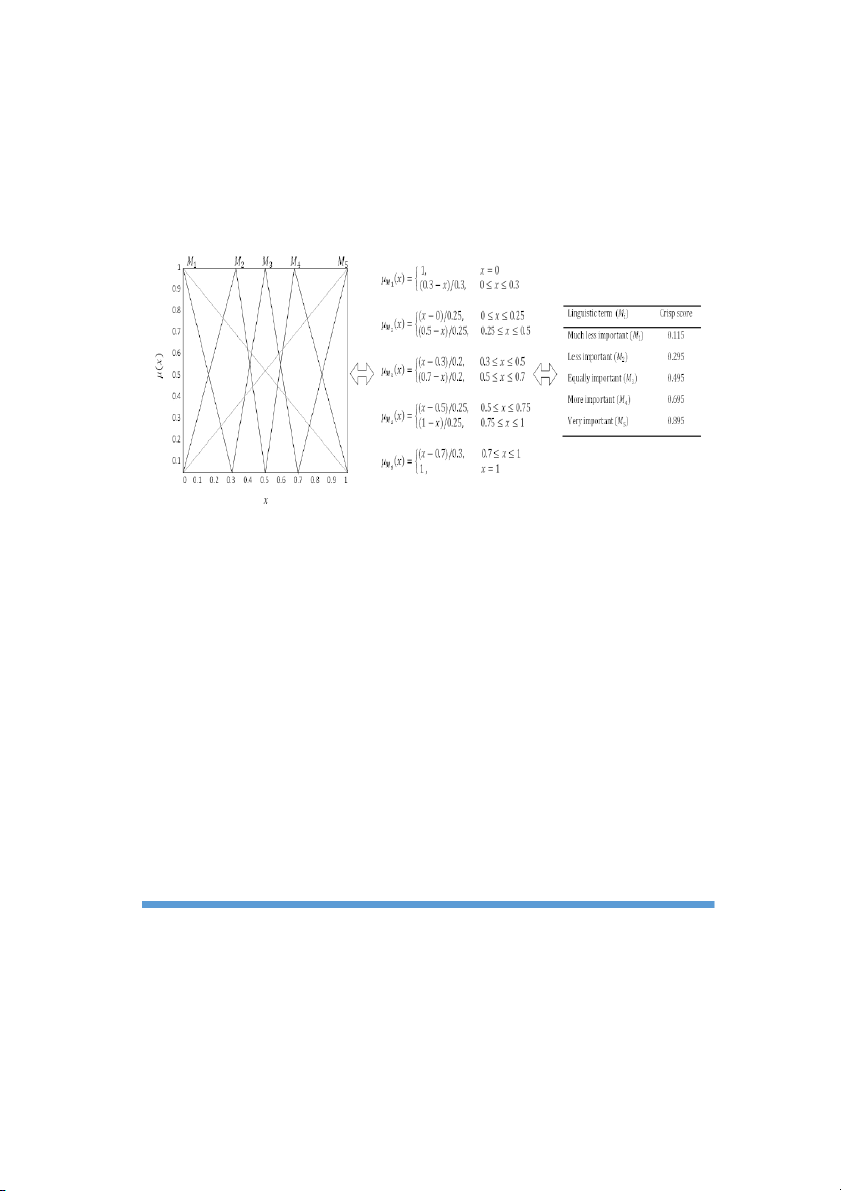
3. Forming matrix β is written based on Equation 2 with the main diagonal of zero and the other elements of fuzzy
comparison of the sub-criteria: the scores are shown in five cases in Figure 3. The procedure of calculating the fuzzy
numbers is shown next to the table.
Figure 3. Linguistic terms to fuzzy number conversation (5-point scale) for comparing criteria 0 𝑟 … 𝑟 12 1𝑛 𝑟 ⋮ 𝑟 β = [ 21 0 2𝑛 ] ⋮ … ⋮ ⋮ 𝑟 … 0 𝑛1 0
4. Forming matrix ξ is written based on Equation 3 which is obtained from matrixes β and ᴪ 𝐶 𝑟 𝑟13 … 𝑟 1 12 1𝑛 𝐶 𝑟 23 ⋯ 𝑟 𝑟21 2 2𝑛 𝑟 𝑟 𝐶 𝑟 𝜉 = 𝜓 + 𝛽 = 31 32 3 ⋯ 3𝑛 ⋯ ⋯ ⋯ ⋯ ⋯ ⋮ ⋮ ⋮ ⋮ ⋮ [𝑟 𝑟 𝐶 𝑛1 𝑛2 𝑟𝑛3 ⋯ 𝑛 ]
5. Calculating the permanent matrix ξ using the following formula 𝑵
𝑷𝒆𝒓 (𝝃) = ∏𝑪 𝒊 + ∑ (𝒓
𝒊𝒋 𝒓 𝒋𝒊 )𝑪𝒌 𝑪𝒍 … 𝑪 𝑵 + ∑ (𝒓
𝒊𝒋 𝒓 𝒋𝒌 𝒓 𝒌𝒊 + 𝒓 𝒊𝒌 𝒓 𝒌𝒋 𝒓 𝒋𝒊 )𝑪𝒍 𝑪𝒏 … 𝑵 𝑪 𝒊=𝟏 𝒊,𝒋,…,𝑵 𝒊,𝒋,…,𝑵 + { ∑ (𝒓
𝒊𝒋 𝒓 𝒋𝒊 ) ( 𝒓 𝒌𝒍 𝒓 𝒍𝒌 ) 𝑪𝒏 𝑪𝒎 … 𝑪 𝑵 + ∑ (𝒓
𝒊𝒋 𝒓 𝒋𝒌 𝒓 𝒌𝒍 𝒓 𝒍𝒊 + 𝒓 𝒊𝒍 𝒓 𝒍𝒌 𝒓 𝒌𝒋 𝒓 𝒋𝒊 )𝑪 𝒍 𝑪𝒏 … } 𝑪 𝑵 𝒊,𝒋,…,𝑵 𝒊,𝒋,…,𝑵 + [ ∑ (𝒓 +
𝒊𝒋 𝒓 𝒋𝒊 ) ( 𝒓 𝒌𝒍 𝒓 𝒍𝒏 𝒓 𝒏𝒌 + 𝒓 𝒌𝒏 𝒓 𝒏𝒍 𝒓 𝒍𝒌 ) 𝑪𝒎 𝑪𝒐 𝑵 … 𝑪
∑ (𝒓 𝒊𝒋 𝒓 𝒋𝒌 𝒓 𝒌𝒍 𝒓 𝒍𝒏 𝒓 𝒏𝒊 + 𝒓 𝒊𝒏 𝒓 𝒏𝒍 𝒓 𝒍𝒌 𝒓 𝒌𝒋 𝒓 𝒋𝒊 )𝑪𝒎 𝑪 𝑵 𝒐 ] … 𝑪 𝒊,𝒋,…,𝑵 𝒊,𝒋,…,𝑵 + ⋯
Int J Supply Oper Manage (IJSOM), Vol.5, No.4 365 Moradi and Jolai
6. Forming decision matrix whose main diagonal is the permanents obtained from the previous stage and the other
elements are comparisons of criteria of the studied supplier selected from the table; each supplier with the largest
permanent matrix is selected and the other suppliers are put in the next ranks.
4. The Model of Allocating Orders to the Suppliers
This is a multi-product multi-period multi-supplier planning model. Taking the sustainability factors into account is one
of the most important criteria of selecting suppliers in this study. In this model, we intend to obtain the order value
allocated to the suppliers in the healthcare area. The target function of this model includes two targets as follows:
4.1. Model’s objectives
The model proposed in this study includes two objectives:
- Reduction of the Total Cost
The first target function is minimizing the total cost of purchasing and ordering, maintenance costs and the product
supplying and communicating with the suppliers.
- Increasing Purchase Value
The second target function seeks to increase the purchase value through increasing the suppliers’ share. - Model’s Hypotheses
The hypotheses of the proposed model
- The desired supply chain in this study involves three levels including supply levels, distribution and demand (customer) centers.
- In addition, this is considered a multi-product and multi-period supply chain.
- The geographical location of the demand and supply places is determined out of the model’s range in the operation, but
locating the distribution centers is determined by the model.
- The distribution capacity is clear and determined.
- The supplier’s capacity is clear and determined.
- Target functions are considered fuzzy.
- The proposed mathematical model has two objectives including minimization of costs and maximization of purchase value.
- Storage possibility has been taken into account in the model.
Because the medication is necessary for the humans’ life, there is no possibility of shortage.
- The demand of each period should be responded by the suppliers at the same period. Eth delayed orders are not considered.
- The score obtained for each supplier in the graph method is used as the coefficient of one of the target functions.
- Discounts have not been considered. Indices
C Costumer (1 < c < C ) d
distribution center ( 1 < d < D ) S Supplier ( 1 < s < S ) t time ( 1 < t < T ) Parameters
Ost The fixed cost of ordering the supplier s in the time period t
COSTdistd The cost of operating the distribution center
COSTsup-distisdt The cost of transferring each product unit i from the supplier s to the distribution center d in time period t
Hit The cost of maintaining each product unit I in the time period t
COSTdist-cusidct The cost of transferring each product unit i rom the distribution center d to customer c in time period t
Capsupist Capacity of supplier s for supplying the product i in time period t
Capdistidt The capacity of distribution center d for supplying the product i in time period t
demict Demand of product i from s by customer c in time period t
Int J Supply Oper Manage (IJSOM), Vol.5, No.4 366
Purchasing Planning and Order Allocation in the Pharmaceutical Sustainable Supply ...
FLOW sup-distisd Maximum transmission flow of product i from supplier s to distribution center d
FLOWdist-cusidc Maximum transmission flow of product i from distribution center d to the customer c
qist The failure rate of product I from supplier s in time period t
Priceist, The cost of purchasing each unit of product i from the supplier s in time period t
ICist, The cost of contracting with the supplier s for product i in time period t
TCist, The cost of finishing the contract with the supplier s for the product i in time period t
Bigm, The very big number
Priceist, The cost of purchasing each unit of product i from the supplier s in time period t
Ws, The score of supplier s from the graph method
Variable, the decision-making variables
yist The binary variable which indicates the case that the supplier s receives the order for product i in time period t
Sist The binary variable which indicates the case of establishing a contract with supplier s for
purchasing product i in time period t
Tist The binary variable that indicates the case of the contract with the supplier s for purchasing
product i in time period t is terminated
Yd The binary variable that indicates the case of operating distribution center d (integer)
Xisdt The purchase amount of product i from distribution center d from supplier s in time period t (integer)
Xidct The delivery amount of product i from distribution center d to custumer c in time period t (integer)
invict The amount of product i existing in the storage of customer c in time period t (integer)
Trn cost, Transfer cost (positive)
Setup cost, The cost of establishing the distribution center (positive)
Str cost, The cost of maintenance (positive)
Sply cost, The cost of supply and communication with suppliers (positive) The Mathematical Model Target Functions
Min Zcost = Trn Cos t + Setup Cos t + Str Cos t + Sply Cos t sup − dist Max Ztotal purchaising value = ∑i.s.d.t ws × xisdt S.t ; sup−dist Trn Cos t = ∑
cos 𝑡𝑠𝑢𝑝−𝑑𝑖𝑠𝑡
𝑑𝑖𝑠𝑡−𝑐𝑢𝑠 dist−cus i,s,d,t 𝑖𝑠𝑑𝑡 ×xisdt + ∑ cos i,d,c,t 𝑡 𝑖𝑑𝑐𝑡 ×xidct (1) Setup Cos t = ∑ cost dist dist d d × yd (2) Str Cos t = ∑ h i,c,t it × invict (3) sup − dist sup sup sup Sply Cos t = ∑ price i,s,d,t i,s,t ×xisdt + ∑ o i,s,t
s,t × yist + ∑i,s,d,t ICi,s,t ×Sist + ∑i,s,d,t TCi,s,t ×Tist (4) ∑ xsup − dist 𝑠𝑢𝑝 d isdt ≤ 𝑐𝑎𝑝 ∀𝑖, 𝑠, 𝑡 (5) 𝑖𝑠𝑡 ∑ xdist − cus 𝑑𝑖𝑠𝑡 c idct
≤ 𝑐𝑎𝑝𝑖𝑑𝑡 ∀𝑖, 𝑑, 𝑡 (6) ∑ xsup − dist 𝑑𝑖𝑠𝑡 s ∀𝑖, 𝑑, 𝑡 isdt
≤ 𝑐𝑎𝑝 𝑖𝑑𝑡 (7) ∑ xsup−dist dist−cus sup − 𝑑𝑖𝑠𝑡 s isdt ≥ ∑c xidct + ∑ 𝑞
s 𝑖𝑠𝑡 × 𝑥 𝑖𝑠𝑑𝑡 ∀𝑖, 𝑑, 𝑡 (8) 𝑖𝑛𝑣
𝑑𝑖𝑠𝑡−𝑐𝑢𝑠
𝑖𝑐𝑡 = 𝑖𝑛𝑣 𝑖𝑐(𝑡−1) + ∑ 𝑥 𝑑 𝑖𝑑𝑐𝑡
− de𝑚 𝑖𝑐𝑡 ∀𝑖, 𝑐, 𝑡 > 1 (9) in𝑣
𝑑𝑖𝑠𝑡−𝑐𝑢𝑠 𝑖𝑐1 = ∑ 𝑥 𝑑 𝑖𝑑𝑐1
− de𝑚 𝑖𝑐1 ∀𝑖, 𝑐 (10) ∑ ydist d d = 1 (11) ∑ xsup − dist 𝑑𝑖𝑠𝑡 s isdt ≤ bigm × 𝑦𝑑 ∀𝑖, 𝑑, 𝑡 (12) ∑ xsup − dist 𝑠𝑢𝑝 d isdt
≤ bigm × 𝑦𝑖,𝑠,𝑡 ∀𝑖. 𝑠. 𝑡 (13)
Int J Supply Oper Manage (IJSOM), Vol.5, No.4 367 Moradi and Jolai ∑ xsup − dist sup − dist s,d isdt ≤ ∑ flow s,d isd ∀𝑖, 𝑡 (14) ∑ xdist − cus dist − cus d,c idct ≤ ∑ flow d,c idct ∀𝑖, 𝑡 (15) T𝑠𝑢𝑝 𝑠𝑢𝑝 𝑠𝑢𝑝 ist
= yist − yis(t+1) ∀𝑖, 𝑠, 𝑡 (16) S𝑠𝑢𝑝 𝑠𝑢𝑝 𝑠𝑢𝑝 ist
= yist − yis(t−1) ∀𝑖, 𝑠, 𝑡 (17)
The aim of presenting the above model can be expressed as following:
The first target function: minimizing the total costs including transportation costs, construction of distribution costs,
maintenance and supplying the product and communication with the customers.
The second target function: maximizing the value of purchasing from the suppliers with high score.
The transportation cost, construction of distribution center cost, maintenance cost and the cost of supplying the product
and communication with the suppliers are respectively shown in restrictions 1 to 4.
The amount of purchased product from the suppliers should not be more than their capacity. This is shown in restriction (5).
The amount of transferred product from the distribution centers to the customers should not exceed the capacity of the
distribution centers, and the amount of the products purchased from the suppliers should not be more than the capacity
of the distribution centers; these are respectively shown in restrictions (6) and (7).
Restriction (8) is for controlling the flow of materials between the levels.
Restrictions (9) and (10) are used for balancing the inventory and satisfying the demands.
Restriction (11) ensures that only one distribution center is constructed.
The condition of purchasing from supplier is the construction of te distribution center as well as communicating with the
suppliers, which are indicated in restrictions (12) to (13).
Restrictions (14) and (15) are defined for the non-aggression of flow between the levels.
Finally, restrictions (16) and (17) are presented to determine the establishment or cancellation of contracts with the suppliers.
5. Solution by the MAX-MIN method
Many resolving methods have been proposed for solving the multi-objective planning such as MAX-MIN, TH, etc.
Today, the fuzzy method is widely considered due to its flexibility and possibility of calculating the satisfaction degree
of each of the target functions. The proposed mathematical model in this study is integer linear planning. Since the issue
has two heterosexual target functions, we will use the fuzzy method presented by Lin et al. (2004) developed by Amid in
2011 in order to make the target functions and restrictions fuzzy. It is coded by using GAMS software and weighted by
the MAX-MIN method; the target functions will turn into a single-objective model, then they will be solved.
The stages of this method are as follows:
1. Determining the best and worst possible answers; to achieve that, each target function must be solved separately and
the best and worst possible answer will be calculated using the following formula. Z negative negative 1 =min (a11,a21) Z2 =min(a12,a22) Z positive positive 1 =max (a11,a21) Z2 =max(a12,a22)
Int J Supply Oper Manage (IJSOM), Vol.5, No.4 368
Purchasing Planning and Order Allocation in the Pharmaceutical Sustainable Supply ...
The results are shown in the form of a 2*2 matrix as follows: z z 1 2 * z a a 1 11 12 * z a a 2 21 22
2. Calculating the membership function for each of the restrictions based on the following formula:
𝑝𝑜𝑠𝑖𝑡𝑖𝑣𝑒 1 𝑙 ( 𝑥 ) 𝑍 > 𝑍 𝑙 0 ( )
𝑛𝑒𝑔𝑎𝑡𝑖𝑣𝑒 𝑙 𝑥 𝑍 < 𝑍 𝜇 𝑙 𝑍𝑚𝑎𝑥 (𝑥) = 𝑙 𝑍 (
𝑛𝑒𝑔𝑎𝑡𝑖𝑣𝑒 𝑙 𝑥 ) − 𝑍 𝑓 𝑙
, 𝑛𝑒𝑔𝑎𝑡𝑖𝑣𝑒 (
𝑝𝑜𝑠𝑖𝑡𝑖𝑣𝑒 𝑍𝑚𝑎𝑥 = 𝑍 𝑙 ≤ 𝑍 𝑙 𝑥) ≤ 𝑍 { 𝑙
𝑍𝑝𝑜𝑠𝑖𝑡𝑖𝑣𝑒 − 𝑍𝑛𝑒𝑔𝑎𝑡𝑖𝑣𝑒 𝑙 𝑙 𝑙
𝑝𝑜𝑠𝑖𝑡𝑖𝑣𝑒 1 𝑘 ( 𝑥 ) 𝑍 > 𝑍 𝑘 0 ( )
𝑛𝑒𝑔𝑎𝑡𝑖𝑣𝑒 𝑘 𝑥 𝑍< 𝑍 𝜇 𝑘 𝑚𝑖𝑛 (𝑥) = 𝑍
𝑝𝑜𝑠𝑖𝑡𝑖𝑣𝑒 𝑘 𝑍 − 𝑍 ( 𝑘 𝑥 ) 𝑓 = 𝑘 , 𝑍
𝑛𝑒𝑔𝑎𝑡𝑖𝑣𝑒 (
𝑝𝑜𝑠𝑖𝑡𝑖𝑣𝑒 𝜇 ≤ 𝑍 𝑘 𝑥 ) ≤ 𝑍 { 𝑚𝑖𝑛
𝑝𝑜𝑠𝑖𝑡𝑖𝑣𝑒
𝑛𝑒𝑔𝑎𝑡𝑖𝑣𝑒 𝑘 𝑘 𝑍 𝑘 𝑍 − 𝑍 𝑘 𝑘
3. Changing the multi-objective function to the following model using the integration max-min function: MAX λ S.t; W*λ≤ μzj ∑ 𝑤𝑗 = 1 ƛ∈[0,1]
4. Solving the max-min single-objective model.
6. Case study: Supplying the clotting factor for patients with hemophilia
The hemophilia A and B are sex-linked diseases in which males are the sick and females are carriers of the disease.
Intensity and rate of bleeding in the hemophilia patients is not more than the normal persons, but its time is longer. The
blood of hemophilia patients does not have sufficient clotting factor. The most common type of hemophilia is type A
and the blood of these patients does not have any factor 8; the blood of patients with hemophilia type B does not have factor 9.
The Required Drugs for Hemophilia Patients: factor IX, factor VII, and factor VIII.
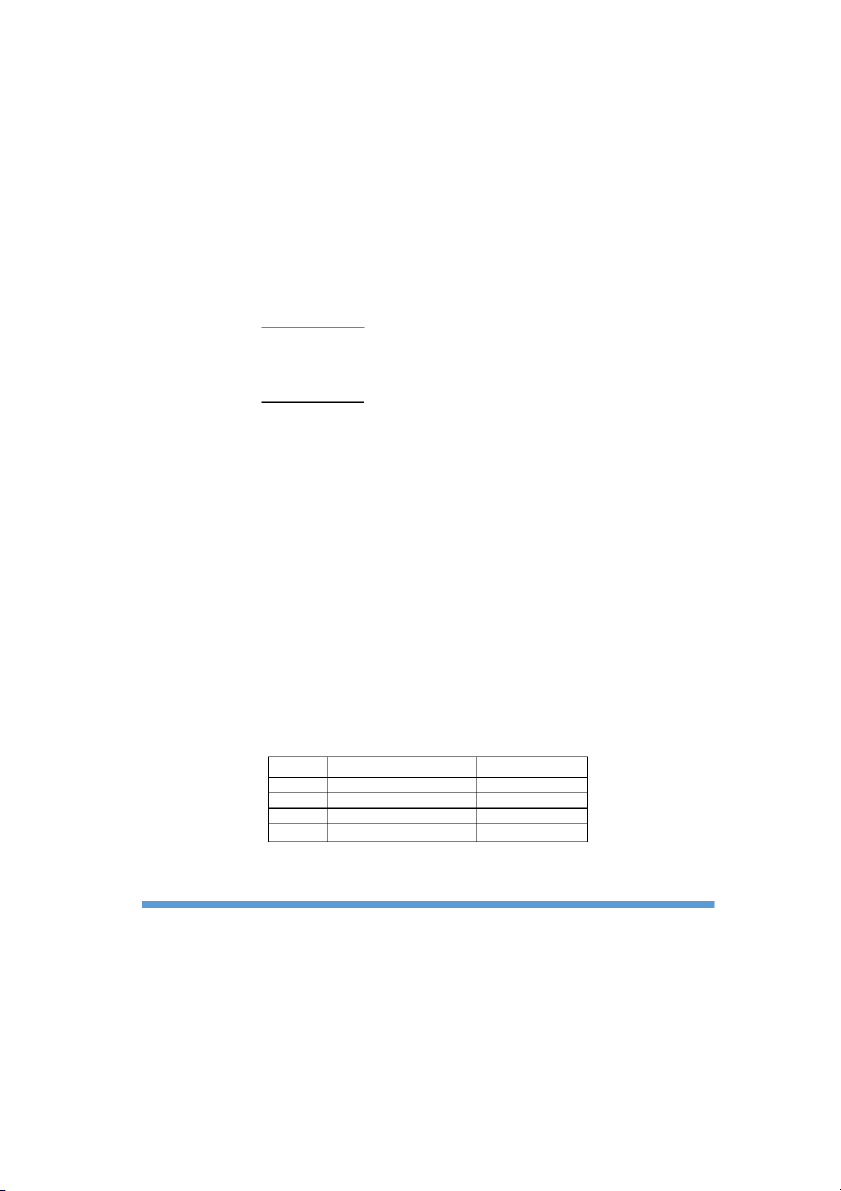
The list of assessed drug suppliers is presented in Table1.
Table 1. The list of assessed drug suppliers Country Company name Supplier’s number USA TALECRIS Company 1 Iran Samen Pharmaceutical Company 2 Korea GREENCROSS Company 3 Colombia BAXTER Company 4
Int J Supply Oper Manage (IJSOM), Vol.5, No.4 369 Moradi and Jolai
Table 2. The assessed criteria and sub-criteria of suppliers Source Abbreviations Selected sub-criteria Criterion All sources 𝐴1
The extent of using renewable and non-renewable forces All sources 𝐴
Observing environmental standards like ISO 14000 Green 2 All sources 𝐴
Green transportation and logistic competence A 3 All sources 𝐴
Using production technology appropriate to the environment 4 All sources
Designing for assessment and eliminating the risky wastes in All sources 𝐴
order to prevent from pollutions and recycling extent 5
Continuou environmental supervision 𝐴6 All sources Green packing 𝐴 7 All sources 𝐵1
Training extent of employees and level of communion All sources 𝐵2
Respecting human rights of employees Social All sources 𝐵
Employment opportunities for people with disabilities competences B 3 All sources 𝐵
Participation of supplier in charities 4 All sources 𝐵 Job safety programs 5 All sources 𝐵 Created job opportunities 6 All sources 𝐶1 Profitability of the supplier All sources 𝐶
Financial power and weakness of the supplier Economic targets 2 All sources 𝐶
The income obtained from recycling C 3 All sources 𝐶 Product’s price 4 All sources 𝐶 Custom costs 5 All sources 𝐶 Delay cost 6 All sources
Costs of transportation and distribution 𝐶7 All sources 𝐷1
Technology and capacity of producing drugs and flexibility of Production All sources 𝐷2 the production line competence and All sources 𝐷
Experience and brand value of producer technology 3 All sources 𝐷
Accessibility to the new technologies and innovation capabilities D 4 The pace of development All sources 𝐸1 Quality sustainability All sources 𝐸2 Quality assurance All sources 𝐸
Qualitative commitment of manager Quality E 3 Experts 𝐸 Reliability 4 Experts 𝐸 R & D 5 Experts Product return rates 𝐸6 Experts 𝐹1
Appropriate planning for ordering timely deliveries and planning to deal with delays Experts 𝐹
Using appropriate strategies in critical and emergency times Delivery time F 2 Experts 𝐹
Good track record in previous deliveries and meeting 3 All sources pharmaceutical needs All sources 𝐹
Mechanisms of reducing the process of order to delivery 4 𝐹
Designing the network of customer services 5
Int J Supply Oper Manage (IJSOM), Vol.5, No.4 370
Tài liệu liên quan:
-
Báo cáo tin học cuối kỳ - báo cáo tin học cuối kì - Tài liệu tham khảo | Đại học Hoa Sen
395 198 -
Dan bai mau De an cuoi ky mon Intro to MIS 2024 - Tài liệu tham khảo | Đại học Hoa Sen
64 32 -

Dan bai mau De an cuoi ky mon Intro to MIS 2021 - Tài liệu tham khảo | Đại học Hoa Sen
73 37 -
Đồ án thành tựu Internetn - Tài liệu tham khảo | Đại học Hoa Sen
71 36 -
Báo cáo cuối kỳ nhóm 1, 2 - Summary mis nhập môn - Tài liệu tham khảo | Đại học Hoa Sen
54 27