Improved Geometric Algorithm for Indoor Localization | Môn Công nghệ kỹ thuật cơ điện tử - Đại học Sư phạm Kỹ thuật Thành phố Hồ Chí Minh
Nowadays, the availability of the Mobile Terminal (MT) location information in a wireless network system has led to the demand of location-based services (LBSs). Tài liệu được sưu tầm gồm 15 trang, giúp bạn ôn tập tốt hơn. Mời các bạn đón xem.
Môn: công nghệ kỹ thuật cơ điện tử 11 tài liệu
Trường: Trường Đại học Sư phạm Kỹ thuật Thành phố Hồ Chí Minh 4.4 K tài liệu
Tác giả:


Preview text:
lOMoAR cPSD| 58675420
An improved geometric algorithm for International Journal of Distributed indoor localization Sensor Networks 2018, Vol. 14(3) The Author(s) 2018 DOI: 10.1177/1550147718767376 journals.sagepub.com/home/dsn
Junhua Yang, Yong Li and Wei Cheng
Indoor localization system using receive signal strength indicator from wireless access point has attracted lots of attention
recently. Geometric method is one of the most widely used spatial graph algorithms to locate object in an indoor
environment, but it does not achieve good results when it is applied to a limited amount of valid data, especially when
using the trilateration method. On the other hand, localization based on fingerprint can achieve high accuracy but need
to pay heavy manual labor for fingerprint database establishment. In this article, we propose a bilateral greed iteration
localization method based on greedy algorithm in order to use all of the effective anchor points. Comparing to
trilateration, fingerprint, and maximum-likelihood method, the bilateral greed iteration method improves the localization
accuracy and reduces complexity of localization process. The method proposed, coupled with measurements in a real
indoor environment, demonstrates its feasibility and suitability, since it outperforms trilateration and maximum-
likelihood receive signal strength indicator–based indoor location methods without using any radio map information nor
a complicated algorithm. Extensive experiment results in a Wi-Fi coverage office environment indicate that the proposed
bilateral greed iteration method reduces the localization error, 63.55%, 9.93%, and 47.85%, compared to trilateration,
fingerprint, and maximum-likelihood method, respectively. Keywords
Indoor localization, Wi-Fi, greedy algorithm, trilateration, K-NN
Date received: 21 September 2017; accepted: 26 February 2018
Handling Editor: Paolo Barsocchi Abstract Introduction
technologies, Wi-Fi-based indoor location systems have
attracted a lot of attention because Wi-Fi has become a
Nowadays, the availability of the Mobile Terminal (MT)
location information in a wireless network system has led
to the demand of location-based services (LBSs).1 Wide School of Electronics and Information, Northwestern Polytechnical
adoption of the Global Positioning System in mobile University, Xi’an, China
devices, combined with cellular networks, have Corresponding author:
practically solved the problem of outdoor localization and Junhua Yang, School of Electronics and Information, Northwestern
opened a new market. It is expected that in the near future, Polytechnical University, Xi’an 710129, China.
we will witness similar trends for indoor scenarios where Email: yjh5392@126.com
people spend more than 70% of their lives. However, standard infrastructure in most buildings, such as airports,
satellite or cellular signals are sharply degraded or may hospital, office buildings, and commercial centers. And as a
fail completely in indoor environment where radio signals common personal item, smartphones are now all able to
are interrupted by shadowing effects.2 Multifarious receive and identify the Wi-Fi signals. Because of this, Wi-Fi
methodologies and approaches have been proposed to location is a low-cost, widespread, and easy obtained indoor
deal with these problems, such as ultra-wide band location method.8,9
(UWB),3 radio frequency identification (RFID),4 wireless
The received signal strength indicator (RSSI) has been
sensor network (WSN),5 Bluetooth,6 and wireless local utilized for Wi-Fi location estimation with the advantage of
area network (WLAN).7 Among all of the indoor location the absence of extra hardware for implementation.10
Typically, there are two techniques of algorithms for RSSI lOMoAR cPSD| 58675420 2
International Journal of Distributed Sensor Networks
positioning.11 The first technique is defined as position-
Related work RSSI and distance
related categories, which are also called fingerprint Let us assume that there is an IEEE 802.11 wireless
methods.12 The main idea is using information of survey network in the indoor environment in which we want to
RSSI values. It depends on sample location coordinates to implement a localization system. Our aim is to estimate
generate radio frequency (RF) map which is called the location of an MT within the Wi-Fi network. This MT
fingerprint map for training and labeling databases after the can measure RSSI values from all APs in range. At time
classifier, by matching algorithms, such as K-Nearest instants of t1,t2, ...,tN, the MT measures RSSI values from
Neighbor (K-NN),13,14 machine-learning-based schemes,15 each of the M APs in range and PR
Bayesian strategy,16 neural networks,17 and data mining based i(tj) indicates the RSSI
value measured by the MT at time tj from the APi. In a
on clustering18 to estimate MT positions by calculating precisely given instant and place, the RSSI values
Euclidean distance between the fingerprint database system obtained by a device in a wireless network depend on a
and the real-time RSSI values.19 It can provide a certain large number of unpredictable factors. Specifically, in an
accuracy localization; however, building and updating the IEEE 802.11 network, small changes in position or
fingerprint database are expensive and laborious. The other direction may result in dramatic differences in RSSI. It is
technique is defined as geometric-related categories, which clear that one of the factors influencing RSSI values
utilizes the empirical path loss models for distance obtained by a wireless device is the distance between
estimation. After that, a trilateration or maximum-likelihood emitter and receiver, as this distance causes an attenuation
algorithm is performed for position estimation. The in RSSI values. This makes it impossible to convert the
trilateration and maximumlikelihood positioning methods measured received power into a radio wave propagation
use three or more anchor points (APs) to calculate distance path by a certain model without errors. Therefore, some
using time differences in signal receptions or signal strength, amendments need to be introduced in the indoor
which are then used to estimate the location of the user.20
localization model. In powerbased ranging, RSSI is
However, RSSI is influenced by many parameters, and mapped into the distance from the transmitter by the
establishing an appropriate RF propagation loss model is prevalent Log-normal Distance
very difficult. As a result, the trilateration and maximum- Path Loss (LDPL) model21,22
likelihood-model-based positioning methods are less
accurate than the fingerprinting positioning d
method. Not only that, the situation of trilateration
P dð Þ½dBm=P dð 0Þ½dBm 10nlog10 +Xs ð1Þ
localization based on three circles is diverse, including the d0
position of the three circles and the number of their where P(d) denotes the measured path loss at distance d.
intersection. Nevertheless, we propose a bilateral greed P(d
iteration (BGI) localization method based on greedy
0) is the average path loss at reference point d0, and n is the path loss exponent.23 X
algorithm in order to improve the localization accuracy and s is the obstacle affect
reduce complexity of localization process. Generally, the consisting of walls, people and interlayers. The true
basic trilateration model requires three APs to achieve the distance is
position estimate of the MT. But it is difficult to find the P dð ÞP dð Þ0 Xs
solution of simultaneous equations. Even if the equation is d =d0310 10n ð2Þ
overdetermined, the probability of solving the equation is
still very low. On the other hand, the amount of AP which can
But how to calculate the value of Xs is a significant
be detected by MT is more than three in the real indoor problem in setting up the signal propagation model in the
environment. In order to obtain a better positioning accuracy, indoor environment, which uses the Wi-Fi-based indoor
how to use all the RSSI of these APs and reduce calculating positioning system. User can detect a very huge variation
complexity become very important. The BGI based on of RSSI from an AP if the user gets into a room or turns a
greedy algorithm we proposed can make full use of these APs corner causing the radio be shaded by doors and walls. A
step by step to get the better positioning result. Meanwhile, predefined X
the BGI is a lower complexity algorithm than K-NN which
s cannot fulfill the demand. This problem
causes the majority of position estimation error. We will
can relieve the use of MT computational resource, so it can do specialized experiment in the following chapters to
dynamically estimate the models that preferably fit the confirm n and X
propagation environment present between the MT and each s in our indoor environment.
AP by using only the RSSI values obtained at that precise instant. lOMoAR cPSD| 58675420 Yang et al. 3 Trilateration
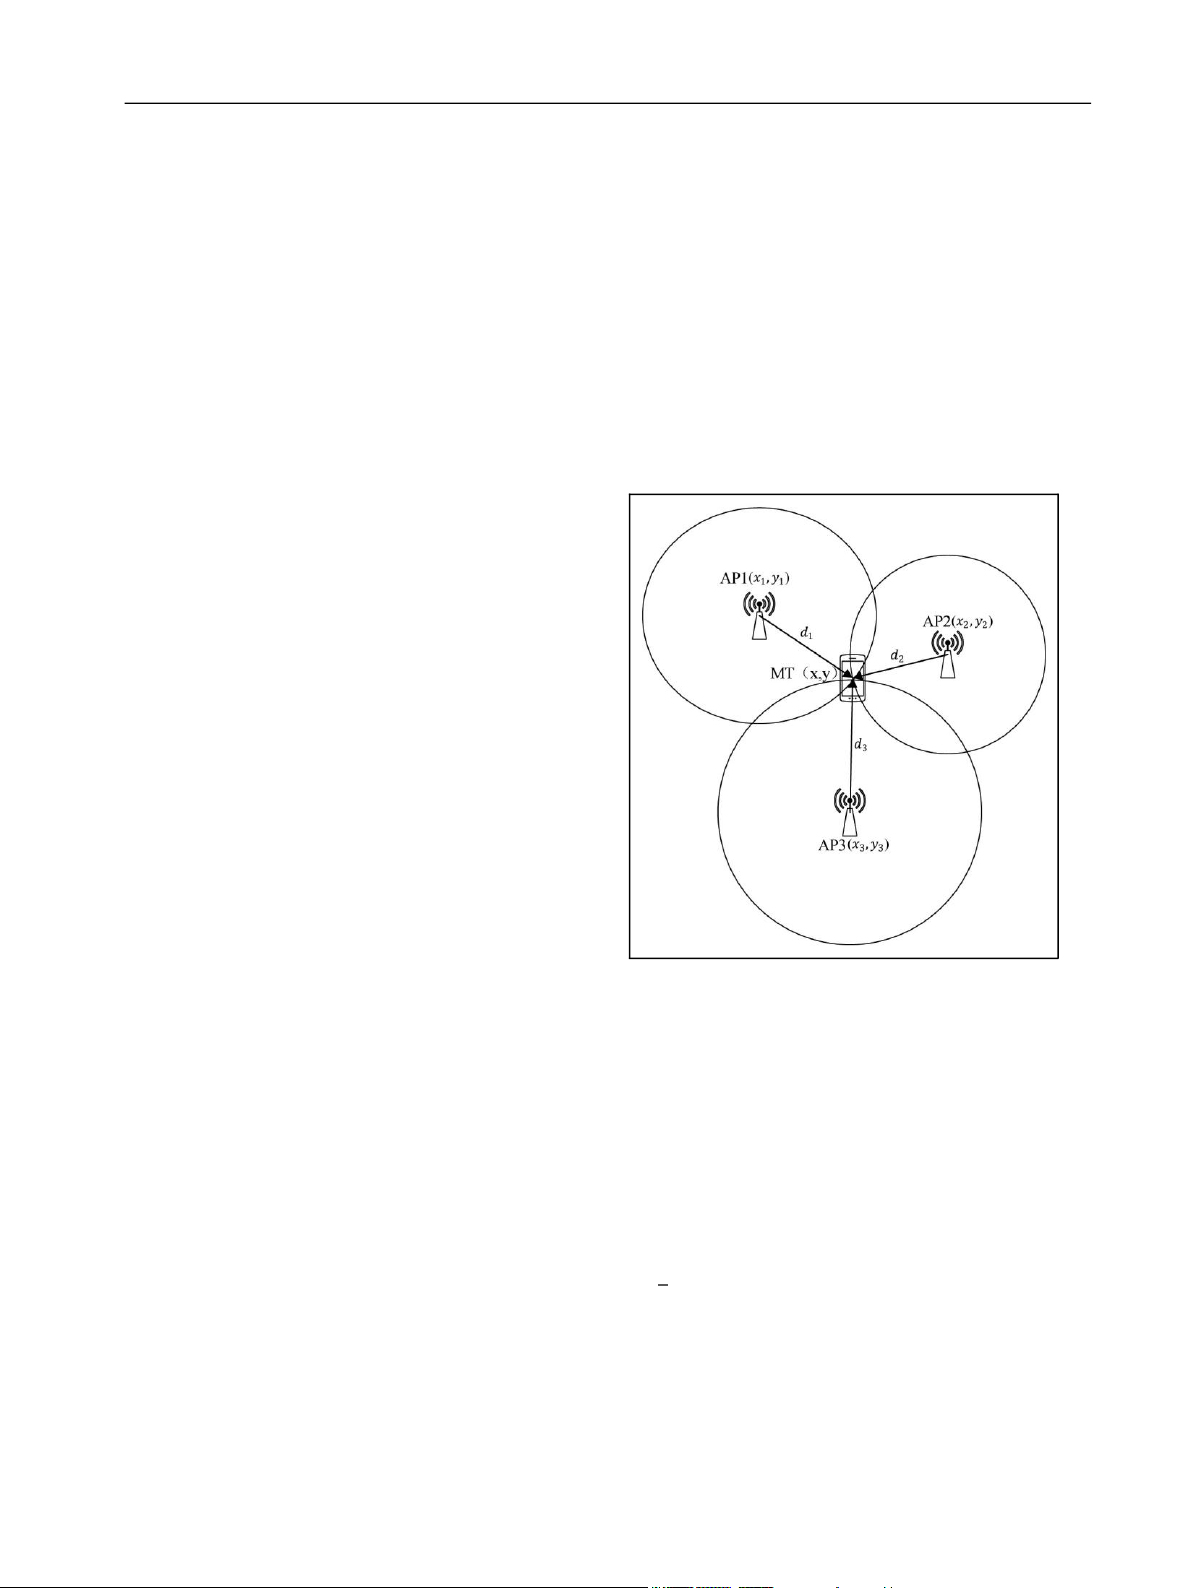
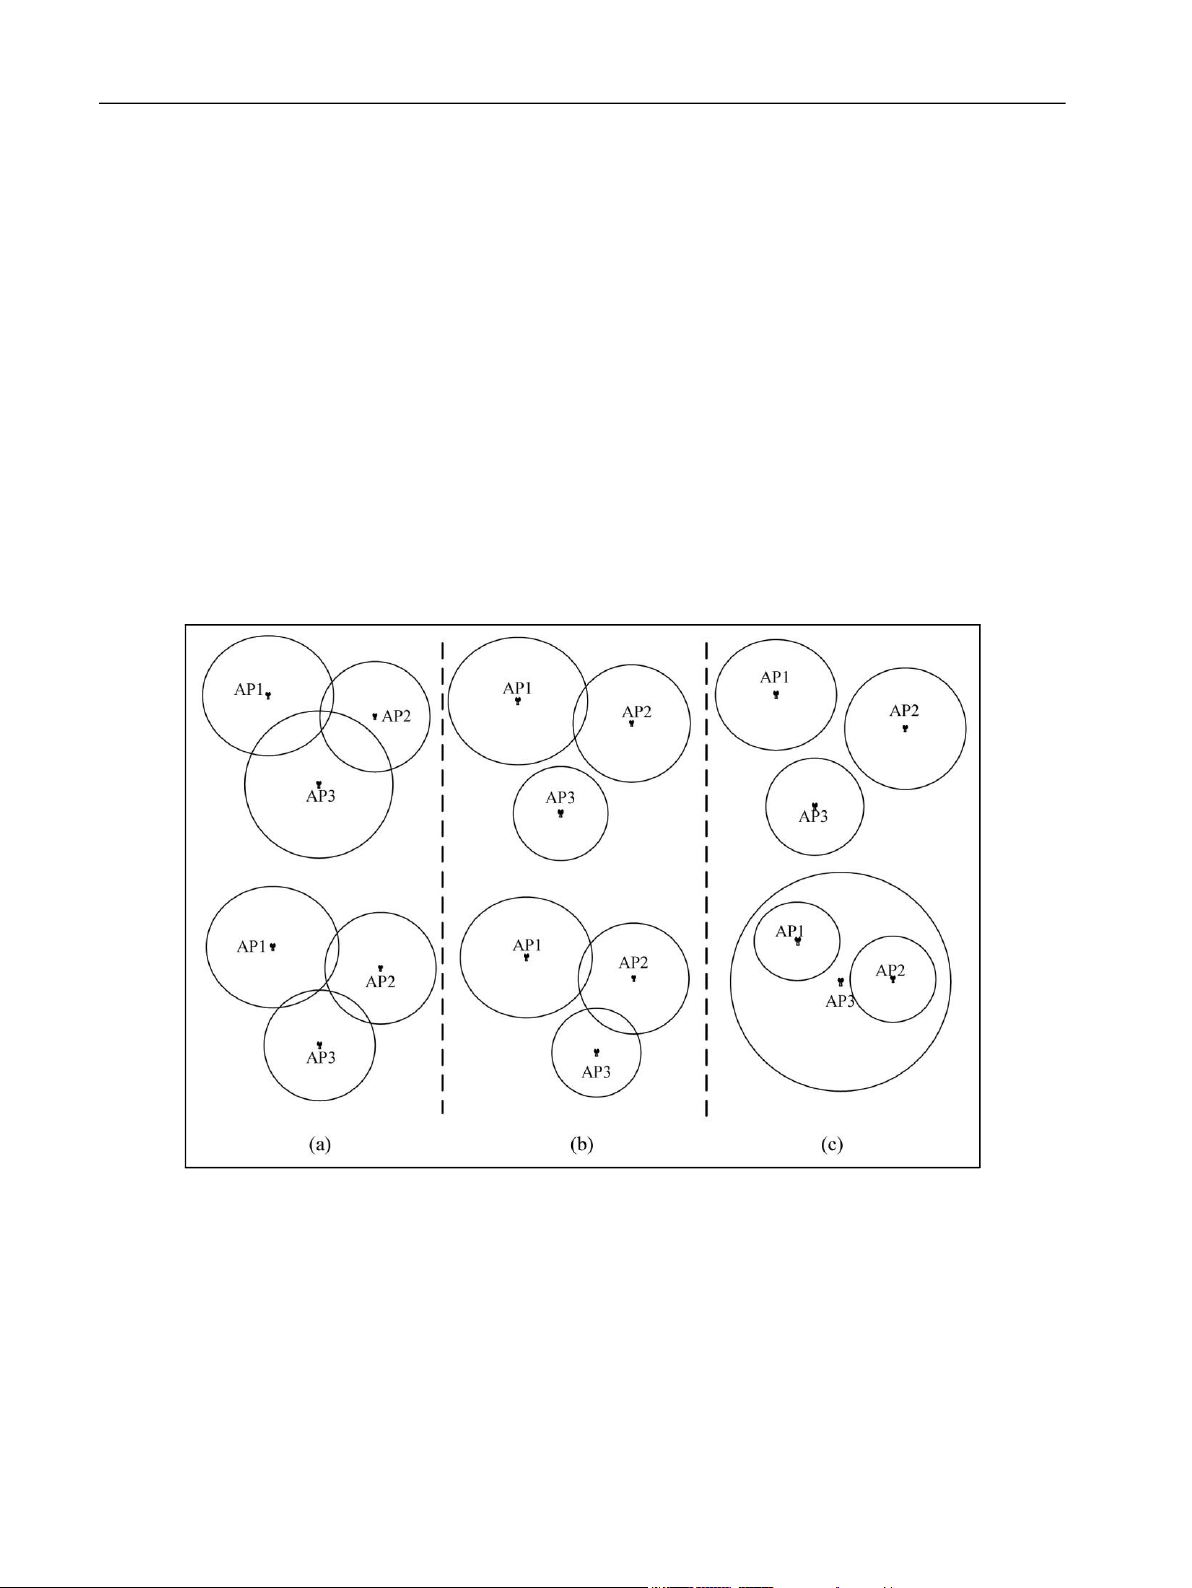
Figure 1 shows the ideal situation in which the three
Trilateration is a method of calculating the position of MT
circles can intersect at one point. Usually, due to
from the distance between the known positions of three
measurement error in the real indoor environment, the
APs and the MT. There are three APs which the MT can
localization of three circles is divided into three cases,
communicate with as shown in Figure 1. The principle
intersect with each two circles, intersect but not each two
behind trilateration positioning is to trace out a circle
circles, and no intersection, which is shown in Figure 2.
using a line represented by the distance (d
There is no solution of equation (3) in the case as i,i=1,2,3) between the AP (coordinate ((x
shown in Figure 2. Even if the equation is overdetermined i,yi),wherei=1,2,3) and the
MT(x,y), and a center point represented by the AP. The
(the number of equations is more than the unknown
circumference of the circle represents the pseudo-range of
solution), the probability of solving the equation is still
the equivalent signal strength of a certain AP. The MT
very low. The usual method is considering equation (3) as
may locate at any point on the circumference of the circle. matrix form
In general, these two distance circles are intercrossed at
two points, producing two solutions to the location
estimate of the MT. To resolve the ambiguity of the two
solutions, a third distance circle, resulting from the
distance measurement at the third AP, is required. The
simultaneous equation is as follows 8
qffiffiffiffiffiffiffiffiffiffiffiffiffiffiffiffiffiffiffiffiffiffiffiffiffif
fiffiffiffiffiffiffiffiffiffiffiffiffiffiffiffiffi2 2 >> > <
qðffiffiffiffiffiffiffiffiffiffiffiffiffiffiffiffiffiffiffiffiffiffiffiffiffi x x + y
ffiffiffiffiffiffiffiffiffiffiffiffiffiffiffiffiffi Þ ð x x12 Þ2 +ðð y y = d y1 Þ 2Þ 2 = d1 ð3Þ 2 >>>:
Figure 1. Illustration of trilateration.
qffiffiffiffiffiffiffiffiffiffiffiffiffiffiffiffiffiffiffiffiffiffiffiffi
ffiffiffiffiffiffiffiffiffiffiffiffiffiffiffiffiffiffiðx x3Þ2 +ðy HX =B ð5Þ y3Þ2 =d3 where
To confirm the localization of MT, with coordinates (x,
y), it only needs two equations. But because of nonlinear x2 x1 y2 y1
characteristic, we need the third equation to solve the H = ð6Þ x3 x1 y3 y1
ambiguous solution problem. Then we can obtain the coordinates of the MT
B= 21 ((dd1122 dd2322)+)+ xx2322 ++yy2322 xx1212 ++yy2112 x 2ðx ð7Þ 1 x2Þ 2ðy1 y2Þ 1 = y 2ðx1 x3Þ 2ðy1 y3Þ
The solution of equation (5) is obtained by the least square d d 4 method " x21 x22 +y21 y22 + 22 12 # ð Þ 3 x X = HTH1HTB ð8Þ 21 x23 +y21 y23 +d32 d12 lOMoAR cPSD| 58675420 4
International Journal of Distributed Sensor Networks
A certain optimization algorithms have been done based
Step 3. Do the first bilateral measurement of BGI.
on equation (8), for instance, a Wi-Fi-based weighted
Determine two circles Ci and Ci+1 to figure out the position
screening method (WSM) is proposed to improve the
point M1 of MT in maximum probability, and the
localization accuracy in trilateration.20 A signal tendency
coordinate of M1 is (xM1,yM1). There are four different
index (STI) based on Procrustes analysis is presented to
position relationships between Ci and
match standardized fingerprints in Zou et al.12 But the Ci+1.
position of more circles and the number of their intersection
Step 4. Do the second bilateral measurement of BGI.
are not considering completely, which is a puzzle without
Determine the third circle Ci+2, and figure out
doubt. We propose the BGI localization method using greedy
algorithm, which only needs two circles at each calculation,
M2(xM2,yM2) via M1 and Ci+2. Step 5. Go on doing the BGI
to avoid complication of three or more circles. until the optimal
Mi(xMi,yMi) is found out. Step 6. Stop. BGI localization
The basic concept of the BGI method is based on greedy
In the BGI algorithm, it only needs to distinguish four
algorithm which makes the locally optimal choice at each different position relationships between Ci and Ci+1 instead of
bilateral positioning process. We
figuring out equation (3) in classic trila-
Figure 2. Three intersecting situations for three circles in the real environment: (a) intersect with each two circles, (b) intersect
but not each two circles, and (c) no intersection.
teration method. The four cases in step 3 of BGI algorithm
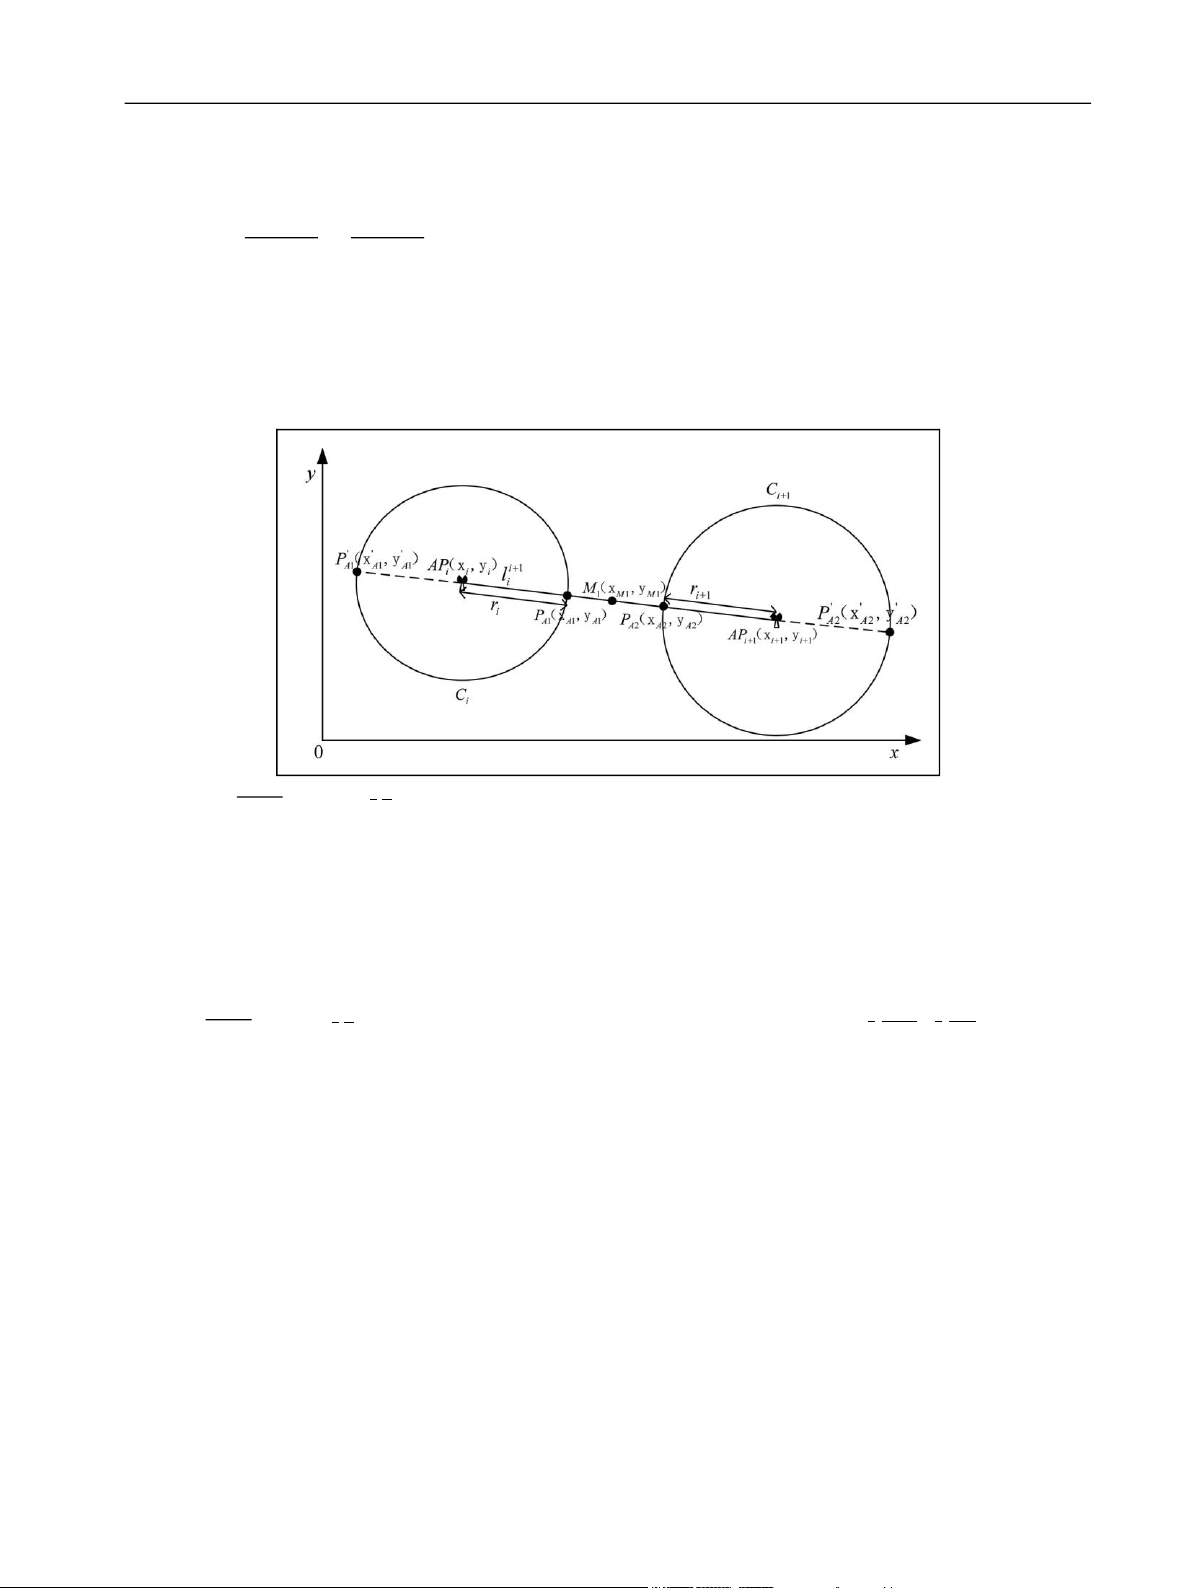
are separation, tangency, intersection, and containing. Separation
summarize the BGI algorithm for the two-dimensional (2D) In a separation case, the algorithm sets a line l i+1
plan localization problem as follows: i
connecting two points, APi and APi+1, which are the Step 1. Let C
centers of circles Ci and Ci+1 as shown in Figure 3.
1,C2, ...,Ci, ...,CN represent the circles,
respectively, N is the number of APs. Step 2. Give r Coordinates (x i as the
i,yi) and (xi+1,yi+1) are presented of two
radius of Ci, and it means the measurement distance APs, APi and APi+1, which are mentioned before.
between APi and MT, (x,y) as the true coordinates of MT. We can obtain the equation expression of l i+1 i lOMoAR cPSD| 58675420 Yang et al. 5 y yi x xi PA1ðx,yÞ = ð9Þ yi+1 yi xi+1 xi
PA2ðx,yÞ = arg minðPA1,PA2Þ>>>>> where y i+1
i+1 ¼6 yi, xi+1 6¼ xi. The intersections of li and
qqðffiffiffiffiffiffiffiffiffiffiffiffiffiffiffiffiffiffiffiffiffiffiffiffiffif
Ci,Ci+1 are PA1 and PA2, respectively. The radiuses of these
fiffiffiffiffiffiffiffiffiffiffiffiffiffiffiffiffiffiffiffiffiffiffiffiffiffiffif two circles are r
fiffiffiffiffiffiffiffiffiffiffiffiffiffiffiffiffiffiffiffiffiffiffiffiffiffiffif
i and ri+1 as giving in step 2. Coordinate of P
fiffiffiffiffiffiffiffiffiffiffiffiffiffiffiffiffiffiffiffiffiffiffiffiffiffiffif
A1 can be figured out by equation (9) and expression of C fiffixxAA11xxA i
0A 22Þ22++ðyyAA11yyA0A22Þ22ffi y 2 2 >>:
i+y1 yiyi = xi+x1xix2i ð10Þ ðx xiÞ +ðy yiÞ =ri ð12Þ
However, there is an ambiguous solution P0
After acquiring the coordinates of P A1. Before A1 and PA2, the
identifying optimal solution, we first figure out P target point M A2
1(xM1,yM1) of MT can be averaged out to coordinate by the equation obtain at the first BGI
yi+y1yiyi = xi+x1xixi ð11Þ ðx xi+1Þ2 +ðy
xM1 = xyAA11 ++2 xyAA22 ð13Þ yM1 = 2 yi+1Þ2 =ri2+1 Tangency
Figure 3. Two circles are separated without intersection.
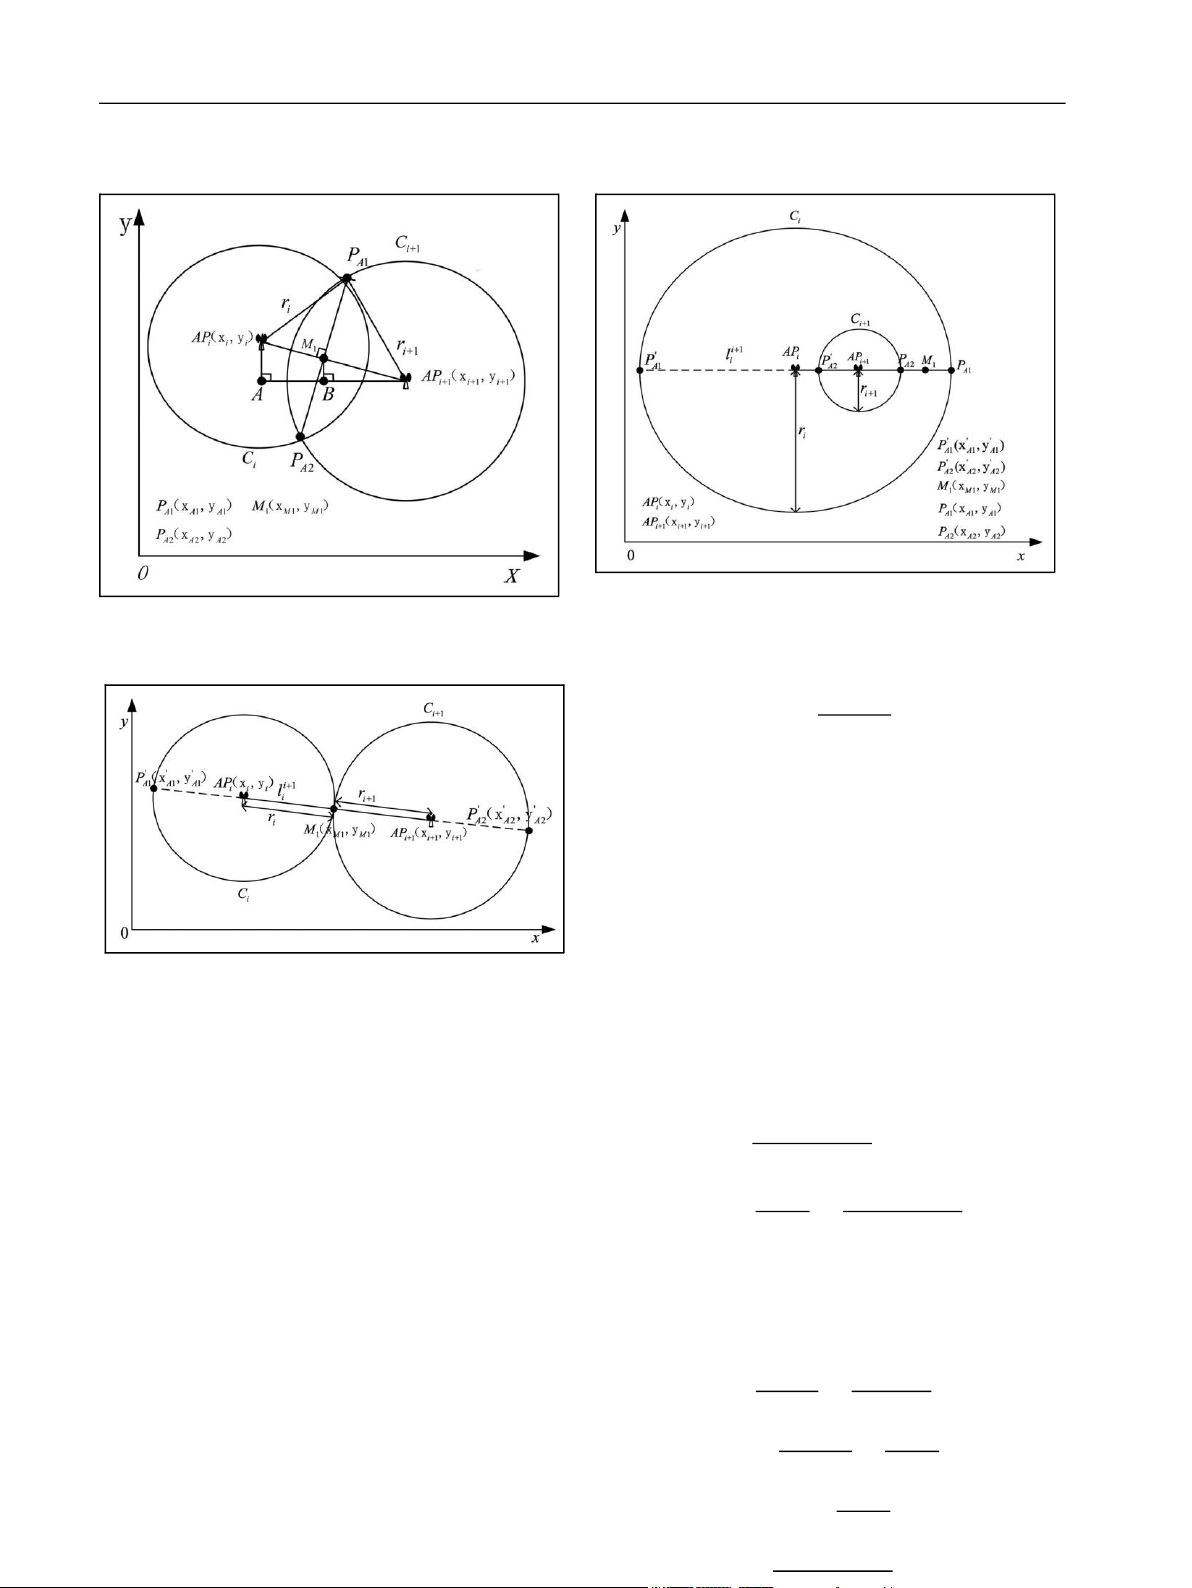
There is only one intersection between Ci and Ci+1 when
they are tangent, and the point of tangency is M1 as shown
in Figure 4. The line connecting two circle centers is l i+1 i
It also has an ambiguous solution P0A2. PA1 and PA2 are
and the expression is similar to equation (9). It also has
screened out through calculating the minimum distance two ambiguous intersections P0 i+1 A1 and P0A2 between li , between circles Ci and Ci+1
which crosses M1, and two circles. Combining expression of l i+1 i
and Ci, we can obtain equation (10). Similarly,
equation (11) can be obtained by combining l i+1 i and Ci+1.
There are two solutions in both equations (10) and (11)
8<>>>>>>>
qqffiffiffiffiffiffiffiffiffiffiffiffiffiffiffiffiffiffiffiffiffiffiffiffiffiffi
ffiffiffiffiffiffiffiffiffiffiffiffiffiffiffiffiffiffiffiffiffiffiffiffiffiffiffi Sð13Þ = P0A1x0A1,y0A1 ð14Þ
ffiffiffiffiffiffiffiffiffiffiffiffiffiffiffiffiffiffiffiffiffiffiffiffiffiffiffi
ffiffiffiffiffiffiffiffiffiffiffiffiffiffiffiffiffiffiffiffiffiffiffiffiffiffiffi M1ðxM1,yM1Þ ffixx
AA00 11 xxA0A2222 ++ yy0A0A11 yy0AA2222ffiffi lOMoAR cPSD| 58675420 6
International Journal of Distributed Sensor Networks
Figure 6. Two circles are containing without intersection. Figure 5. Two circles are intersectant with two intersections. Sð14Þ = P0A2x0A2,y0A2 ð15Þ d = ðxi xi+1Þ2 +ðyi yi+1Þ2 ð16Þ M1ðxM1,yM1Þ yi+1 yi k1 = ð17Þ xi+1 xi
where yi+1 6¼ yi, xi+1 6¼ xi, and ðPA1M1Þ2 =ri2 ðAPiM1Þ2 ð18Þ
ðPA1M1Þ2 =ri2+1 ðM1APi+1Þ2 =ri2+1 ðAPiAPi+1 APiM1Þ2 =ri2+1 ðd APiM1Þ2
Figure 4. Two circles are tangent with one intersection.
=r 2i+1 d2 ðAPiM1Þ2 +2dAPiM1 ð19Þ
Then the following expression can be obtained via
Comparing equations (14) and (15), the equal one M1 is
the target point of MT at the first BGI. = ri2 ri2+1 +d2 APiM1 Intersection 2d
There are two intersections (PA1 and PA2) between Ci and Ci+1 AP M r2 r2 +d2 ð20Þ
when they are intersectant. As shown in Figure 5, ri and ri+1 ) i 1 = i i+12 d
are the radiuses of Ci and Ci+1, respectively. Line segment
APiAPi+1 and PA1PA2 were intersected at point M1, which is 2d
the first BGI point we should solve out. Two parallel lines of y-axis, AP
In the right-angled triangle DAPiAAPi+1
iA and M1B, and another parallel line of x-axis,
AAPi+1, are intersecting at points A and B, respectively. We AB AP
assume that d is the length of line segment AP iM1 iAPi+1, k1 is the = slope of line APiAPi+1, so then AAP
qffiffiffiffiffiffiffiffiffiffiffiffiffiffiffiffiffiffiffiffiffiffiffiffiffif i+1 APiAPi+1
fiffiffiffiffiffiffiffiffiffiffiffiffiffiffiffiffiffiffiffiffiffiffiffiffiffif fiffi ) xM1 xi = APiM1 xi+1 xi d lOMoAR cPSD| 58675420 Yang et al. 7 ) xM1 =xi + APiM1 ðxi+1 xiÞ
used to filter out PA1 and PA2 as the nearest points between d
circles Ci and Ci+1. M1 is the midpoint of line segment
PA1PA2 and is solved by equation (13).
After confirming the position of M1 through two circles i 2 i+1 i
in the above four different cases, the second positioning 2d
point M2 should be solved out using the AP
According to the slope of line APiAPi+1
APi+2 and the third circle Ci+2 with radius ri+2. A straight line l i + 2
i + 1 is drawn passing through points M1 and APi+2, yM1 yi k1 = xM1
which also has two intersections (PA3 and P0A3) with Ci+2, xi
as shown in Figure 7. The coordinates of PA3 and P0A3 can ) yM1 =yi +k1ðxM1 xiÞ be solved out by =yi + i+1 yi ðxM1 xiÞ y ð22Þ yi+y2yMy1M1 = xi+x2xMx1M1 =x + ri2 ri2+1 +d2 ðx x Þ ð21Þ 2 2 2 ð23Þ ðx xi+2Þ +ðy yi+2Þ =ri+2
where the two equations are the expressions of l i + 2 i + 1 and
Ci+2. PA3 is screened out through calculating the minimum
length between line segment M1PA3 and M1P0A3 8
qffiffiffiffiffiffiffiffiffiffiffiffiffiffiffiffiffiffiffiffiffiffiffi xi+1 xi
ffiffiffiffiffiffiffiffiffiffiffiffiffiffiffiffiffiffiffiffiffiffiffif
At this point, the coordinate of M1 is solved out and it is fiffiffiffiffiffiffiffiffiffi
the target position of MT at the first BGI. < ðxM1 xA3Þ2 +ðyM1 yA3Þ2 PA3ðx,yÞ= argmin: Containing
qffiffiffiffiffiffiffiffiffiffiffiffiffiffiffiffiffiffiffiffiffiffiffiffiffif
It is similar between the containing case and separation case fiffiffiffiffiffiffiffiffiffiffiffiffiffiffiffiffiffiffiffiffiffiffiffiffiffif (see Figure 6). Line l i+1 fiffiffiffiffi ffi i passes through points P0A1,
APi, P0A2, APi+1, PA2, M1, and PA1 sequentially, and its ðx,yÞ xM1 x0 2 + yM1 y0A3 2
expression is shown in equation (9). A3
The coordinates of PA1, PA2,P0A1, and P0A2 are ð24Þ
calculated by equations (10) and (11). Formula (12) is
Figure 7. Confirm the second localization point M2 using BGI. lOMoAR cPSD| 58675420 8
International Journal of Distributed Sensor Networks
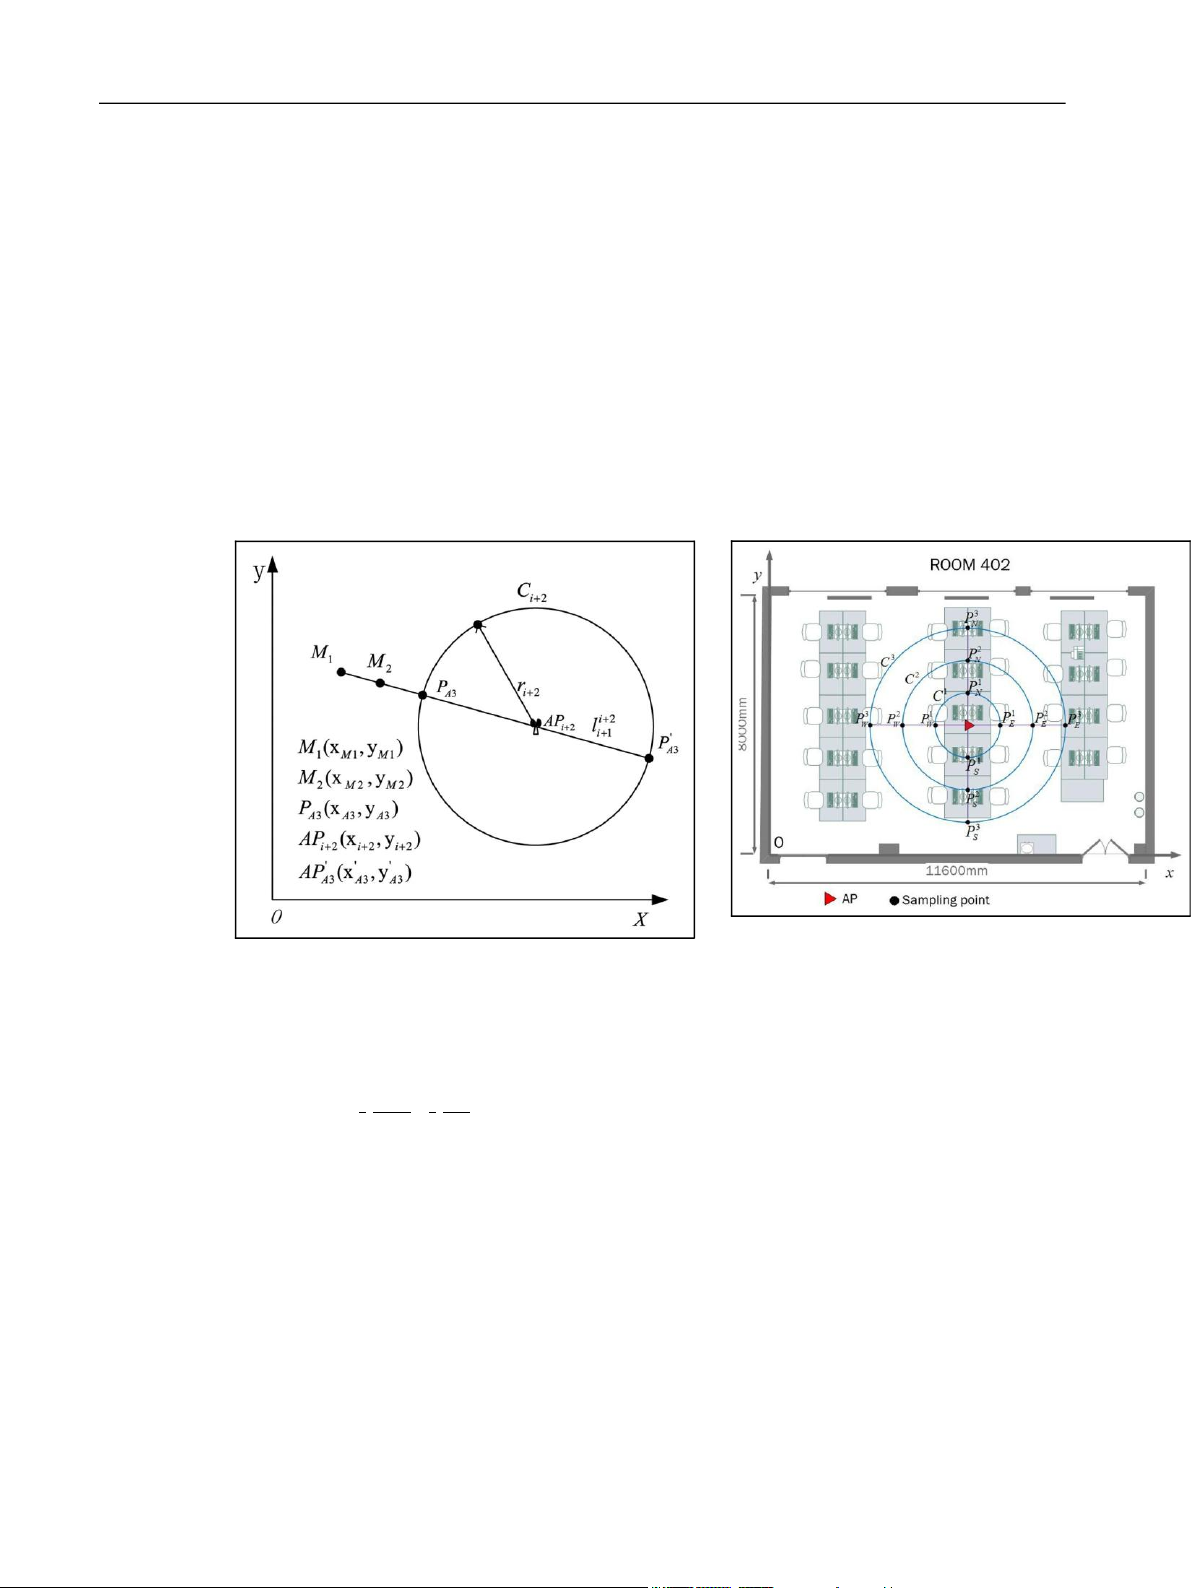
Figure 8. The key parameter measurement model of experiment environment.
The middle point M2(xM2,yM2) of line segment
Experimental results and discussion M1PA3 is calculated by
In this section, an experiment is provided to demonstrate
the effectiveness of the BGI localization algorithm
proposed in this article. We had the experiment in Room
xM2 = xyMM11 ++2 xyAA33 ð25Þ yM2 = 2
402 of Electronic and Information College, Northwestern
Polytechnical University. The room is a typical office
which is the localization of MT at the second BGI.
environment, including tables, chairs, personal
M3, M4, M5, and so on, will be sought out in the next
computers, and students. For achieving the real indoor
phase in the way of seeking M2. In the proposed BGI
environment, we do all our experiments on weekdays.
algorithm, a threshold of RSSI value should be set ahead
The target system for our experiments is a wireless LAN
of time, greater than 290 dBm, for instance. If there are N
using the IEEE802.11b (Wi-Fi) standard. The system is
APs which can be detected via RSSI value greater than
composed by eight TL-WDR5620 access points produced
the threshold by MT, it will do BGI calculation N – 1
by TP-LINK Technologies, equipped with four external
times, and N – 1 Mi localization points will be estimated
omnidirectional antennas. All presented measurements
out. Our experiments in the real indoor environment will
are taken on 2.4 GHz center frequency. The RSSI value is
screen out the optimal value of N in the next section.
gathered with a Thunderobot laptop using an TP-LINK
wireless network adapter and WirelessMon software. lOMoAR cPSD| 58675420 Yang et al. 9
Before testing the BGI algorithm, we first set up the
relationship model between RSSI value and distance in
29:865= 21:875 10nlog10 321 ++XXss ð26Þ 36:73= the experiment room. 21:875 10nlog10 1 Environmental parameter
We can calculate out n = 3.9 and Xs =3:75dBm from
The variable quantity n in expression (1) is influenced by equation (26), and equation (2) in the measurement
indoor environment and test devices. We built a measurement environment is
model as shown in Figure 8 to confirm the value of n in Room
402. Figure 8 shows the experiment environment Room 402 P dð ÞP dð Þ0 3:75
with the dimensions of 8 m 3 11.6 m. Three concentric circles d =d0310 1033:9 ð27Þ
C1,C2, and C3 take one AP as the center, 1, 2, and 3 m as
radius, respectively. There are four sampling points in the
north, east, south, and west directions on each circle. As Test and results
shown in Figure 8, there are 12 sampling points totally: In this section, we discuss the measurement results conducted
P1N,P1E,P1S,P1W on C1, P2N,P2E,P2S,P2W on C2, and to establish the effectiveness of BGI method as well as a
P3N,P3E,P3S,P3W on C3. Circle C1 is the unit circle and the conventional trilateration method that was used for the
radius is d0 of expression (1).
localization test in the evaluation as comparison, and the test
We began the test at sampling point P1N. The laptop was steps are as follows:
placed at P1N and then rotated to north, east, south, and west
directions. At each direction, RSSI value was sampled each
Step 1. Let C1,C2, ...,Ci, ...,CN represent the circles,
second and continued for 3 min. There are 180 sampling
respectively; N is the number of APs. Step 2. Give ri as the
times at P1N directing north, and it is similar to the other
radius of Ci, and it means the measurement distance
directions. The mean RSSI value of each direction at 12
between APi and MT, (x,y) as the true coordinates of MT.
sampling points is shown in Table 1. It also shows the mean
Step 3. Determine two circles Ci and Ci+1 to figure out the RSSI value of each point.
position point M1 of MT in maximum probability, and the
According to the sampling data above, P(d0), P(d1), and
coordinate of M1 is (xM1,yM1). There are four different
P(d2) in equation (1) of range 1, 2, and 3 m can be and C . position relationships between C figured out i i+1
Table 1. RSSI value (dBm) of four directions at 12 sampling points. P1N P1E P1S P1W P2N P2E P2S P2W P3N P3E P3S P3W North 19.33 20.06 23.79 19.98 31.47 25.38 29.38 31.84 37.34 36.54 40.99 34.17 East 18.47 21.37 25.71 22.69 30.47 28.62 25.68 36.16 38.45 32.78 39.36 39.83 South 19.87 22.67 23.17 18.82 33.71 26.22 24.8 32 34.21 35.46 41.28 37.78 West 22.73 26.98 24.25 20.11 31.23 29.78 28.26 32.84 35.12 31.34 38.57 34.46 Mean value 20.1 22.77 24.23 20.4 31.72 27.5 27.03 33.21 36.28 34.03 40.05 36.56
RSSI: receive signal strength indicator.
qffiffiffiffiffiffiffiffiffiffiffiffiffiffiffiffiffiffiffiffiffiffiffiffi
ffiffiffiffiffiffiffiffiffiffiffiffiffiffiffiffiffiffiffiffiffiffiffi 8
Step 4. Compute (x xM1)2 +(y yM1)2 =e1. Step 5. Determine the third circle C >< P d
i+2, and figure out M2(xM2,yM2)
ð 0Þ= ð20:1Þ+ð22:77Þ+4 ð24:23Þ+ð20:4Þ = 21:875 via M1 and Ci+2.
qffiffiffiffiffiffiffiffiffiffiffiffiffiffiffiffiffiffiffiffiffiffiffiffi
> P dð 1Þ= ð31:72Þ+ð27:5Þ+4ð27:03Þ+ð33:21Þ = 29:865 : P dð 2Þ=
ffiffiffiffiffiffiffiffiffiffiffiffiffiffiffiffiffiffiffiffiffiffiffi
Step 6. Compute (x xM2)2 +(y yM2)2 =e2. Step 7. Repeat
ð36:28Þ+ð34:03Þ+4 ð40:05Þ+ð36:56Þ = 36:73
steps 5 and 6, calculate e3, ...,ei, ...,eN. emin =minfe1,e2, ...,ei, ...,e
and then we can obtain the following equation on the basis of
Ng. Step 8. Calculate error eT of trilateration method, and compare e equation (1): min and eT. Step 9. Stop. lOMoAR cPSD| 58675420 10
International Journal of Distributed Sensor Networks
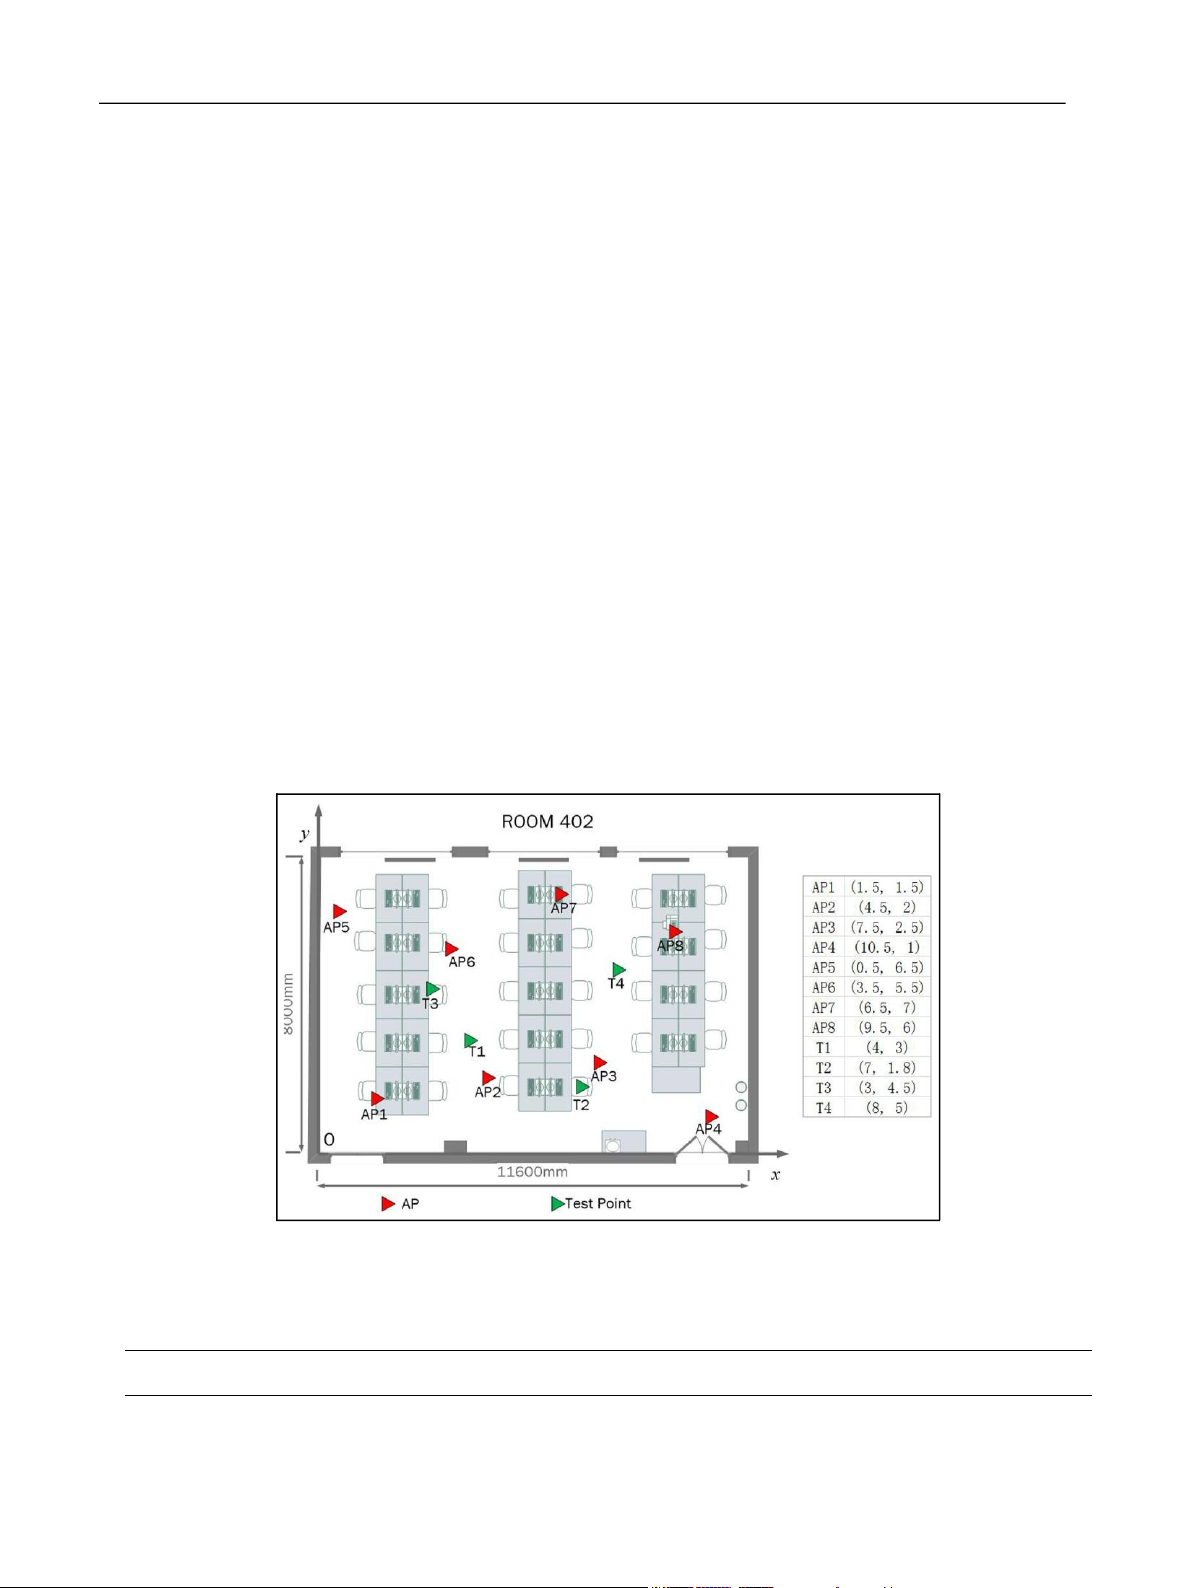
In Room 402, there are eight APs and four test points
Then, we estimate localization M2 utilizing M1 and
arranged for the experiment. The distribution and
AP3 according to equations (23) to (25). Just as the
coordinates of these points are shown in Figure 9. All the
method, we also get estimation localization M3, M4, M5,
APs are dispersedly fixed in the room.
M6, and M7 as shown in Figures 11 to 13. The error of each
At test point 1 (T1), we gathered RSSI from APs from
estimation localization is calculated out after getting the
four different directions using the same laptop. RSSI coordinate of these points.
value collection at each direction last 5 min and the
The measurement results of T2, T3, and T4 are
acquisition frequency is once per second. After taking the
obtained with the same steps and methods as T1. If RSSI
mean, the measurement distance between each AP and T1
of AP is too weak, less than 290 dBm in general, for the
is calculated via equation (16). The RSSI and distance are
MT to detect, it will be out of locating action. Therefore, shown in Table 2.
all the APs assigned are effective to the test points, and the
After figuring out the distance, we first confirm circles
minimum RSSI is 255.9675 dBm in the measurement
C1 and C2 with center at AP1 and AP2 and radius equal to
room. The mean RSSI values of eight APs at four test
2.47 and 2.86 m as shown in Figure 10. The coordinate of
points are shown in Table 3, and the corresponding
M1 can be obtained by equations (21) and (22), and the
distances, calculated by formula (27), between APs and
result is 2.67, 1.69. Distance error between
test points are shown in Table 4. One location point is
M1 and true localization of T1 is received by step 4
confirmed by the first two APs; the follow-up location
qffiffiffiffiffiffiffiffiffiffiffiffiffiffiffiffiffiffiffiffiffi
point is interrelated with the rest of six APs. Hence, the
number of location point is seven determined by eight
ffiffiffiffiffiffiffiffiffiffiffiffiffiffiffiffiffiffiffiffiffiff
APs. The final location points of four test points in Room iffiffiffiffiffiffiffiffi 402 are shown in Figure 14. 2 2
At the same time, the trilateration method, fingerprint e1 = ð4 2:67Þ +ð3 1:69Þ =1:87m ð28Þ
method using K-NN algorithm, and maximum-
Figure 9. The distribution of APs and test points.
Table 2. The RSSI (dBm) and distance (m) between T1 and APs. AP1 AP2 AP3 AP4 AP5 AP6 AP7 AP8 North 37.48 40.49 36.44 57.44 44.49 30.45 47.58 46.58 lOMoAR cPSD| 58675420 Yang et al. 11 East 31.26 30.68 34.68 52.89 47.87 24.78 44.36 47.73 South 35.45 34.21 35.85 51.14 41.25 28.24 42.46 48.26 West 29.58 38.36 40.34 49.62 41.76 27.46 43.37 50.88 Mean value 33.4425 35.935 36.8275 52.7725 43.8425 27.7325 44.4425 48.3625 Distance 2.47 2.86 3.02 7.73 4.56 1.76 4.46 5.62
RSSI: receive signal strength indicator; APs: anchor points.
Figure 10. The estimated localization (M1) of T1 utilizing AP1
Figure 11. The estimated localization (M2) of T1 utilizing M1 and AP2.
and AP3, and the estimated localization (M3) of T1 utilizing M2 and AP4. of T1 utilizing of T1 utilizing
and AP4, and the estimated localization (M5) of T1 utilizing M4
and AP7, and the estimated localization (M7) of T1 utilizing M6 and AP5. and AP8. lOMoAR cPSD| 58675420 12
International Journal of Distributed Sensor Networks
Table 3. The mean RSSI (dBm) of eight APs at four test points. AP1 AP2 AP3 AP4 AP5 AP6 AP7 AP8 T1 33.4425 35.935 36.8275 52.7725 43.8425 27.7325 44.4425 48.3625 T2 45.19 24.105 27.8775 45.46 51.375 47.855 46.3825 44.9325 T3 34.705 29.3975 43.37 55.9675 32.775 31.59 42.4825 47.665 T4 51.555 43.0475 42.21 45.5375 53.9425 46.6375 24.2925 28.1775
RSSI: receive signal strength indicator; APs: anchor points.
Table 4. The distance (m) between eight APs and four tes t points. AP1 AP2 AP3 AP4 AP5 AP6 AP7 AP8 T1 2.47 2.86 3.02 7.73 4.56 1.76 4.46 5.62 T2 4.94 1.42 1.78 5.02 7.12 5.79 5.3 4.87 T3 2.66 1.95 4.44 9.34 2.37 2.21 4.21 5.72 T4 7.2 4.36 4.15 5.05 8.29 5.38 1.44 1.81 APs: anchor points.
96 grids, and each grid is about 100 cm long and 97 cm
wide. In the center of the grid, RSSI value was sampled
likelihood method are also used at all test points as a each second and also continued for 3 min. The mean value
comparison. In the trilateration method, three circles of of 180 RSSI values is the fingerprint data at each grid.
trilateration are very critical with regard to each test point. Therefore, the whole fingerprint database consists of 96
The three APs we choose are not only the nearest to the test RSSI mean values. It takes about 5 h to build this database.
point but also surrounding the test point on the plane. The In the localization phase, K-NN (K = 8) algorithm is applied
correlations of APs used for locating test points and each to match the MT position. Maximum-likelihood source
test point are (T1, AP1, AP2, AP6), (T2, AP2, AP3, AP4), localization algorithm is also used to compare with BGI
(T3, AP1, AP2, AP6), and (T4, AP3, AP7, AP8). For each method.
test point, the coordinate of one location point using
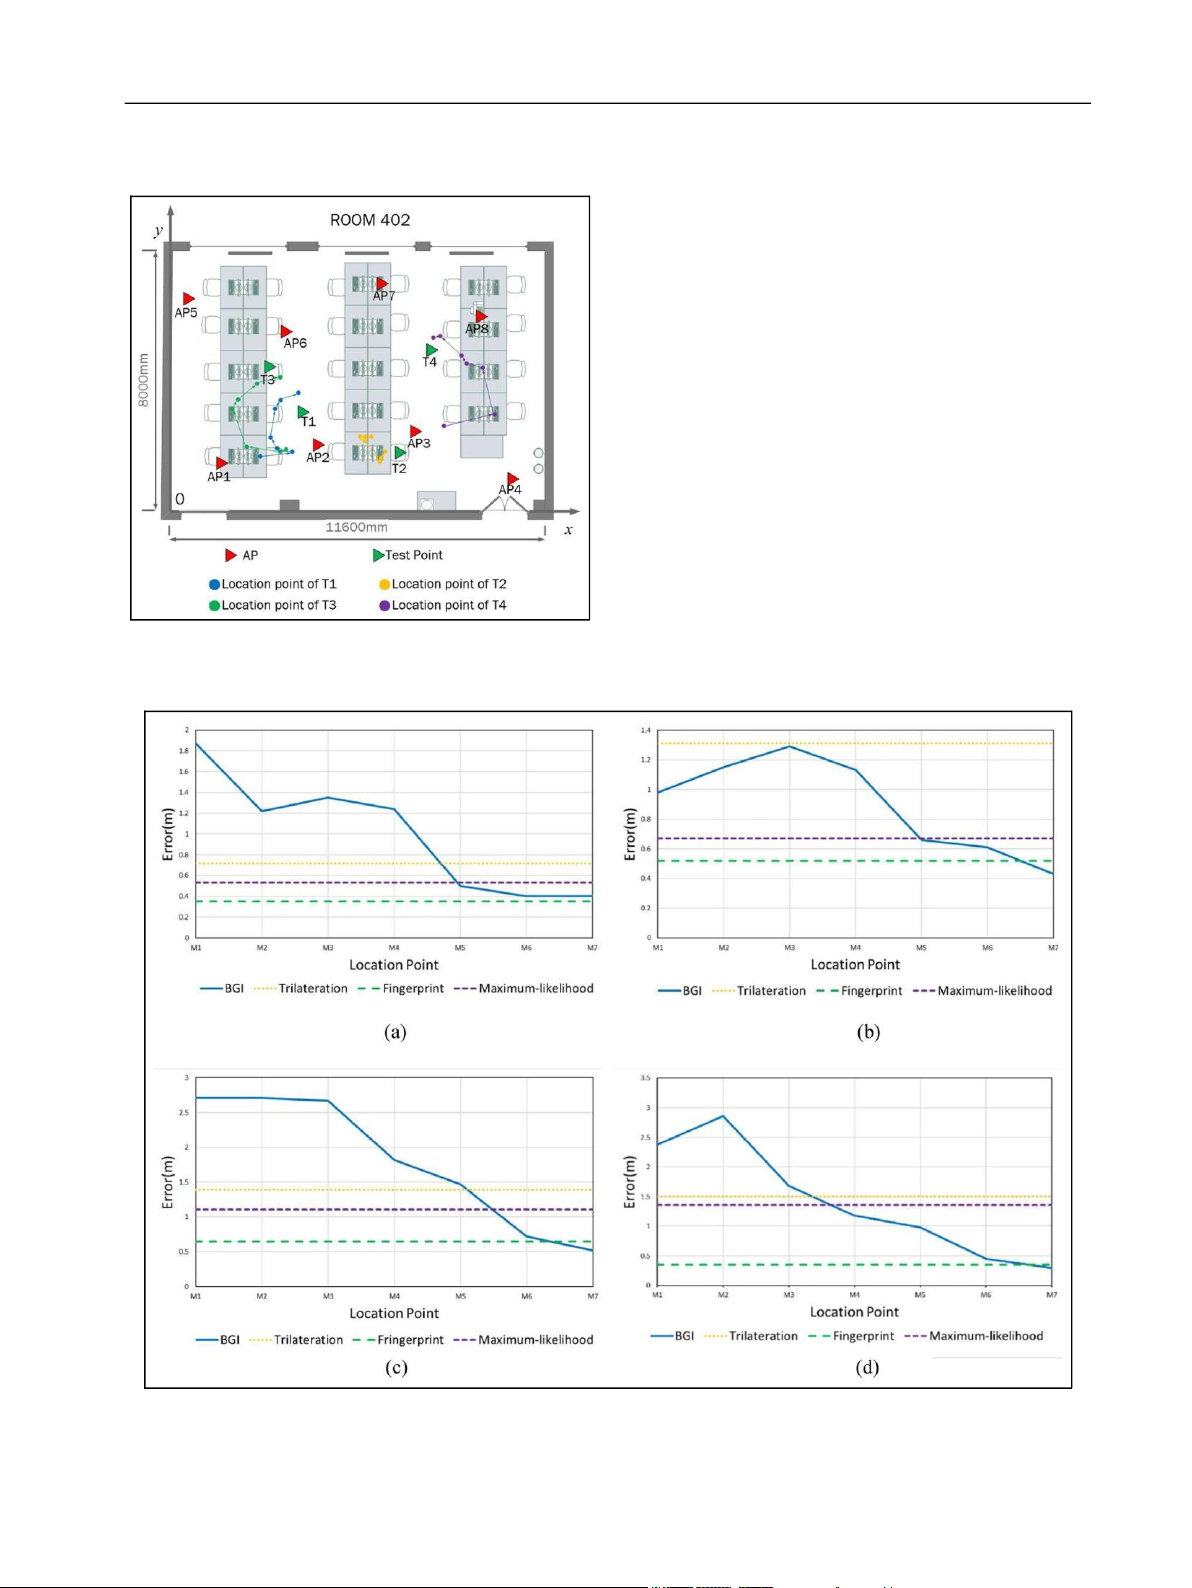
The location error will be acquired by comparing the real
trilateration method, and seven location points using BGI coordinate and measurement coordinate. All errors are
method are shown in Table 5. In order to achieve the shown in Figure 15. For each test point, the
fingerprint method, the testing room is divided into about lOMoAR cPSD| 58675420 Yang et al. 13
error using trilateration method is eT1 =0:72m, eT2 =1:31m,
and eT3 =1:39m, eT4 =1:5m; error using fingerprint method is
eF1 =0:35m, eF2 =0:52m, eF3 =0:65m, and eF4 =0:35m; and
error using maximum-likelihood method is eM1 =0:53m, eM2
=0:67m, eM3 =1:11m, and eM4 =1:36m. We can see that the
location error has a decreasing trend along with the number
of AP increased using BGI method; the minimum error is
emin1 =0:4m, emin2 =0:43m, emin3 =0:52m, and emin4 =0:3m. The
positioning accuracy is improved 44.4%, 67.2%, 62.6%, and
80% compared to trilateration method; 214.3%, 17.3%, 20%,
and 16.7% compared to fingerprint method; and 24.5%,
35.8%, 53.2%, and 77.9% compared to maximum-likelihood
method. The positioning accuracy of BGI method is
significantly improved than trilateration and maximum-
likelihood method. Although more works and more complex algorithm have to be done,
Figure 14. Location points of four test points. the localization
error of fingerprint method is even worse than the BGI we proposed. For measurement lOMoAR cPSD| 58675420 14
International Journal of Distributed Sensor Networks
Figure 15. Location error of BGI, trilateration, fingerprint, and maximum-likelihood method: (a) the error of three methods at T1, (b)
the error of three methods at T2, (c) the error of three methods at T3, and (d) the error of three methods at T4.
Table 5. The measurement coordinates of location points. Trilateration M1 M2 M3 M4 M5 M6 M7 T1 (3.28, 3.07) (2.67, 1.69) (3.6, 1.85) (3.22, 1.9) (3.02, 2.24) (3.5, 3) (3.66, 3.22) (4.05, 3.4) T2 (5.79, 2.3) (6.14, 2.27) (5.94, 2.24) (5.8, 2.26) (5.93, 2.16) (6.42, 1.49) (6.42, 1.6) (6.57, 1.81) T3 (3.27, 3.14) (3.53, 1.84) (3.33, 1.81) (2.28, 1.93) (1.82, 3.11) (2.03, 3.4) (2.63, 3.88) (3.33, 4.1) T4 (7.8, 6.49) (8.33, 2.64) (9.97, 2.92) (9.57, 4.4) (9.08, 4.52) (8.94, 4.74) (8.25, 5.38) (8.07, 5.29)
enhanced 63.55%, 9.93%, and 47.85%, averagely. The
trilateration method is relatively easy to implement; however,
the localization accuracy is obviously lower than the BGI
method. In the fingerprint method, the experiment room is
divided into 96 grids, and data collection has already been
cumbersome enough. Nevertheless, the localization accuracy
is even worse than BGI. As can be seen, the method of BGI
finds a balance point between the accuracy and the
complexity. The structure of the algorithm makes it
especially suitable for real indoor office environment.
Declaration of conflicting interests
The author(s) declared no potential conflicts of interest with
respect to the research, authorship, and/or publication of this
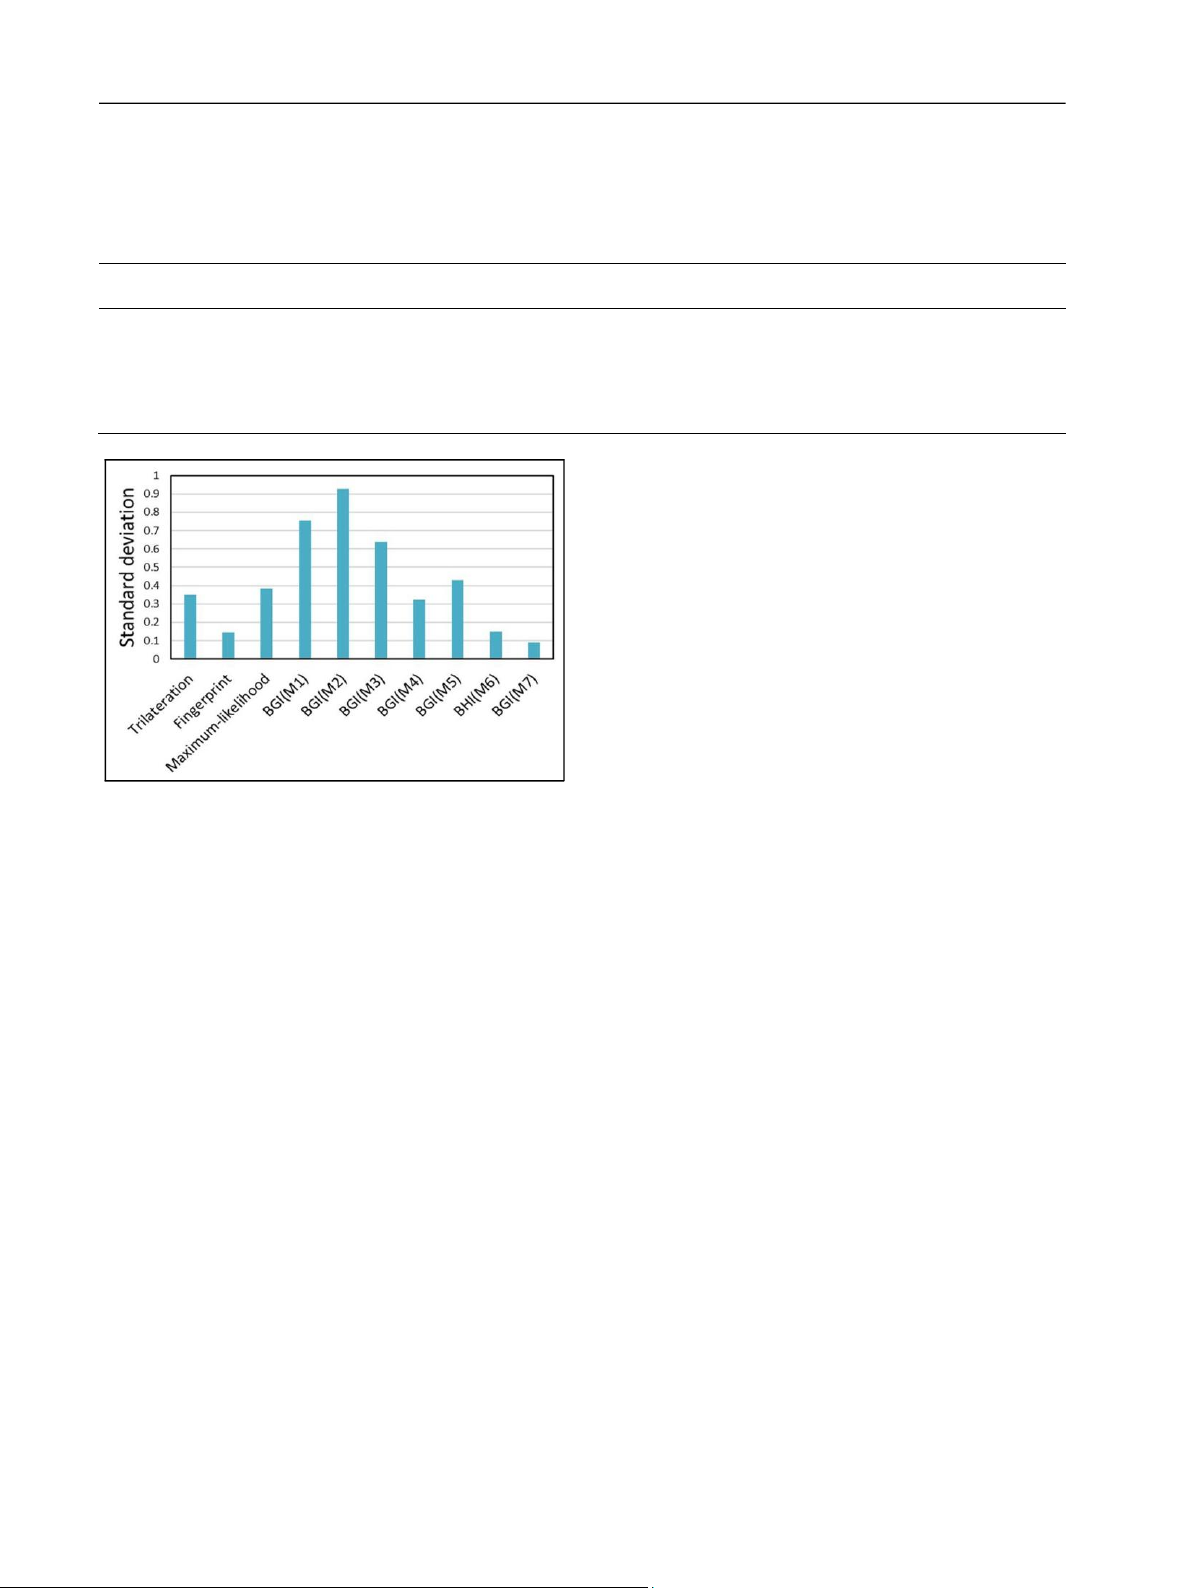
Figure 16. Standard deviations of four test points using article.
trilateration method and BGI method. Funding
data of four test points, the standard deviation estimates are The author(s) disclosed receipt of the following financial
also changed using different number of APs as shown in support for the research, authorship, and/or publication of this
Figure 16. In trilateration, fingerprint, and maximum-
article: This work is supported by the National Natural Science
likelihood methods, the standard deviations are 0.35, 0.15, Foundation of China under Grant No. 61401360.
and 0.38, respectively; however, the minimum value is 0.09
using the BGI method. In the case of more than eight APs, References
the proposed BGI method is more stable and steady than the
1. Ku¨ pper A. Location-based services. Chichester: Wiley, other three methods. 2005.
2. Yassin A, Nasser Y, Awad M, et al. Recent advances inindoor
localization: a survey on theoretical approaches and Conclusion
applications. IEEE Commun Surv Tut 2017; 19: 1327–1346.
In this article, we propose a BGI localization method based
3. Monica S and Ferrari G. UWB-based localization inlarge
on greedy algorithm that achieves centimeterlevel accuracy
indoor scenarios: optimized placement of anchor nodes. IEEE
for indoor localization. The proposed BGI fully utilizes all
T Aero Elec Sys 2015; 51(2): 987–999.
effective APs in indoor Wi-Fi systems to improve the
4. Huang C-H, Lee LH, Ho CC, et al. Real-time RFIDindoor
positioning accuracy. In the beginning of BGI, we analyzed
positioning system based on Kalman-filter drift removal and
four situations about the relationship of two circles. Four test
Heron-bilateration location estimation. IEEE T Instrum Meas
points are adopted in the real indoor environment to examine 2015; 64(3): 728–739.
the effectiveness of the BGI method. Comparing the
5. Yang H, Li W and Luo C-M. Fuzzy adaptive Kalmanfilter for
traditional trilateration, fingerprint, and maximum-likelihood
indoor mobile target positioning with INS/ WSN integrated
methods, the positioning accuracy using BGI method is
method. J Cent South Univ 2015; 22: 132421333. lOMoAR cPSD| 58675420 Yang et al. 15
6. Gu Y and Ren F. Energy-efficient indoor localization ofsmart
20. Liu H-H, Lo W-H, Tseng C-C, et al. A WiFi-basedweighted
hand-held devices using Bluetooth. IEEE Access 2015; 3:
screening method for indoor positioning systems. Wireless 1450–1461.
Pers Commun 2014; 79: 611–627.
7. Kim Y, Shin H, Chon Y, et al. Smartphone-based Wi-
21. Rappaport TS. Characterization of UHF multipath
Fitracking system exploiting the RSS peak to overcome the
radiochannels in factory buildings. IEEE T Antenn Propag
RSS variance problem. Pervasive Mob Comput 2013; 1989; 37: 1058–1069. 9(3): 406–420.
22. Mazuelas S, Bahillo A, Lorenzo RM, et al. Robustindoor
8. Kang W and Han Y. SmartPDR: smartphone-basedpedestrian
positioning provided by real-time RSSI values in unmodified
dead reckoning for indoor localization. IEEE Sens J 2015;
WLAN networks. IEEE J Sel Top Signa 15(5): 2906–2916. 2009; 3(5): 821–831.
9. Nagpal PS and Rashidzadeh R. Indoor positioning
23. Yang Z, Zhou Z and Liu Y. From RSSI to CSI:
usingmagnetic compass and accelerometer of smartphones.
indoorlocalization via channel response. ACM Comput Surv
In: Proceedings of the 2013 international conference on 2013; 46(2): 25.
selected topics in mobile and wireless networking
(MoWNeT’13), Montreal, QC, Canada, 19–21 August 2013, pp.140–145. New York: IEEE.
10. Choi T, Chon Y, Kim Y, et al. Enhancing WiFi-fingerprinting
accuracy using RSS calibration in dual-band environments.
Pervasive Mob Comput 2016; 30: 45–57.
11. Dardari D, Closas P and Djuric PM. Indoor tracking: theory,
methods, and technologies. IEEE T Veh Technol 2015; 64(4): 1263–1278.
12. Zou H, Huang B, Lu X, et al. A robust indoor positioning
system based on the Procrustes analysis and weighted extreme
learning machine. IEEE T Wirel Commun 2016; 15(2): 1252– 1266.
13. Torteeka P and Xiu C. Indoor positioning based on WiFi
fingerprint technique using fuzzy K-nearest neighbor. In:
Proceedings of the 2014 11th international Bhurban
conference on applied sciences and technology (IBCAST),
Islamabad, Pakistan, 14–18 January 2014. New York: IEEE.
14. Xie Y, Wang Y, Nallanathan A, et al. An improved Knearest-
neighbor indoor localization method based on spearman
distance. IEEE Signal Proc Let 2016; 23(3): 351–355.
15. Figuera C, Rojo-Alvarez JL, Wilby M, et al. Advancedsupport
vector machines for 802.11 indoor location. Signal Process 2012; 92: 2126–2136.
16. Iglesias J, Bernardos AM and Casar JR. A Bayesianstrategy to
enhance the performance of indoor localization systems. In:
Molina JM, Corredera JRC, Pe´ rez MFC, et al. (eds) User-
centric technologies and applications, vol. 94 (Advances in
intelligent and soft computing). Berlin; Heidelberg: Springer, 2011, pp.79–92.
17. Nerguizian C, Despins C and Affes S. Geolocation inmines
with an impulse response fingerprinting technique and neural
networks. IEEE T Wirel Commun 2006; 5: 603–611.
18. Mengual L, Marban O and Eibe S. Clustering-basedlocation
in wireless networks. Expert Syst Appl 2010; 37: 6165–6175.
19. Torteeka P and Chundi X. Indoor positioning based onWi-Fi
fingerprint technique using fuzzy K-nearest neighbor. In:
Proceedings of the 2014 11th international Bhurban
conference on applied sciences and technology (IBCAST),
Islamabad, Pakistan, 14–18 January 2014. New York: IEEE.
Tài liệu liên quan:
-
Tin học trong kỹ thuật
39 20 -

Fuzzy PID Control of a Five DOF Robot Arm: A Comprehensive Study | Môn Công nghệ kỹ thuật cơ điện tử - Đại học Sư phạm Kỹ thuật Thành phố Hồ Chí Minh
124 62 -

Ứng dụng cảm biến khoảng cách lên mô hình ô tô đo đạc khoảng cách cảnh báo va chạm | Môn Công nghệ kỹ thuật cơ điện tử - Đại học Sư phạm Kỹ thuật Thành phố Hồ Chí Minh
97 49 -

Thực Tập: Trạm Đóng Nắp Tự Động Hóa | Môn Công nghệ kỹ thuật cơ điện tử - Đại học Sư phạm Kỹ thuật Thành phố Hồ Chí Minh
89 45