Key Concepts in Logistics & Supply Chain Management môn Principle of Management | Trường Đại học Quốc tế, Đại học Quốc gia Thành phố Hồ Chí Minh
Key Concepts in Logistics & Supply Chain Management môn Principle of Management | Trường Đại học Quốc tế, Đại học Quốc gia Thành phố Hồ Chí Minh. Tài liệu giúp bạn tham khảo, ôn tập và đạt kết quả cao. Mời đọc đón xem!
Môn: Principles of Management 314 tài liệu
Trường: Trường Đại học Quốc tế, Đại học Quốc gia Thành phố Hồ Chí Minh 2 K tài liệu
Tác giả:


Preview text:
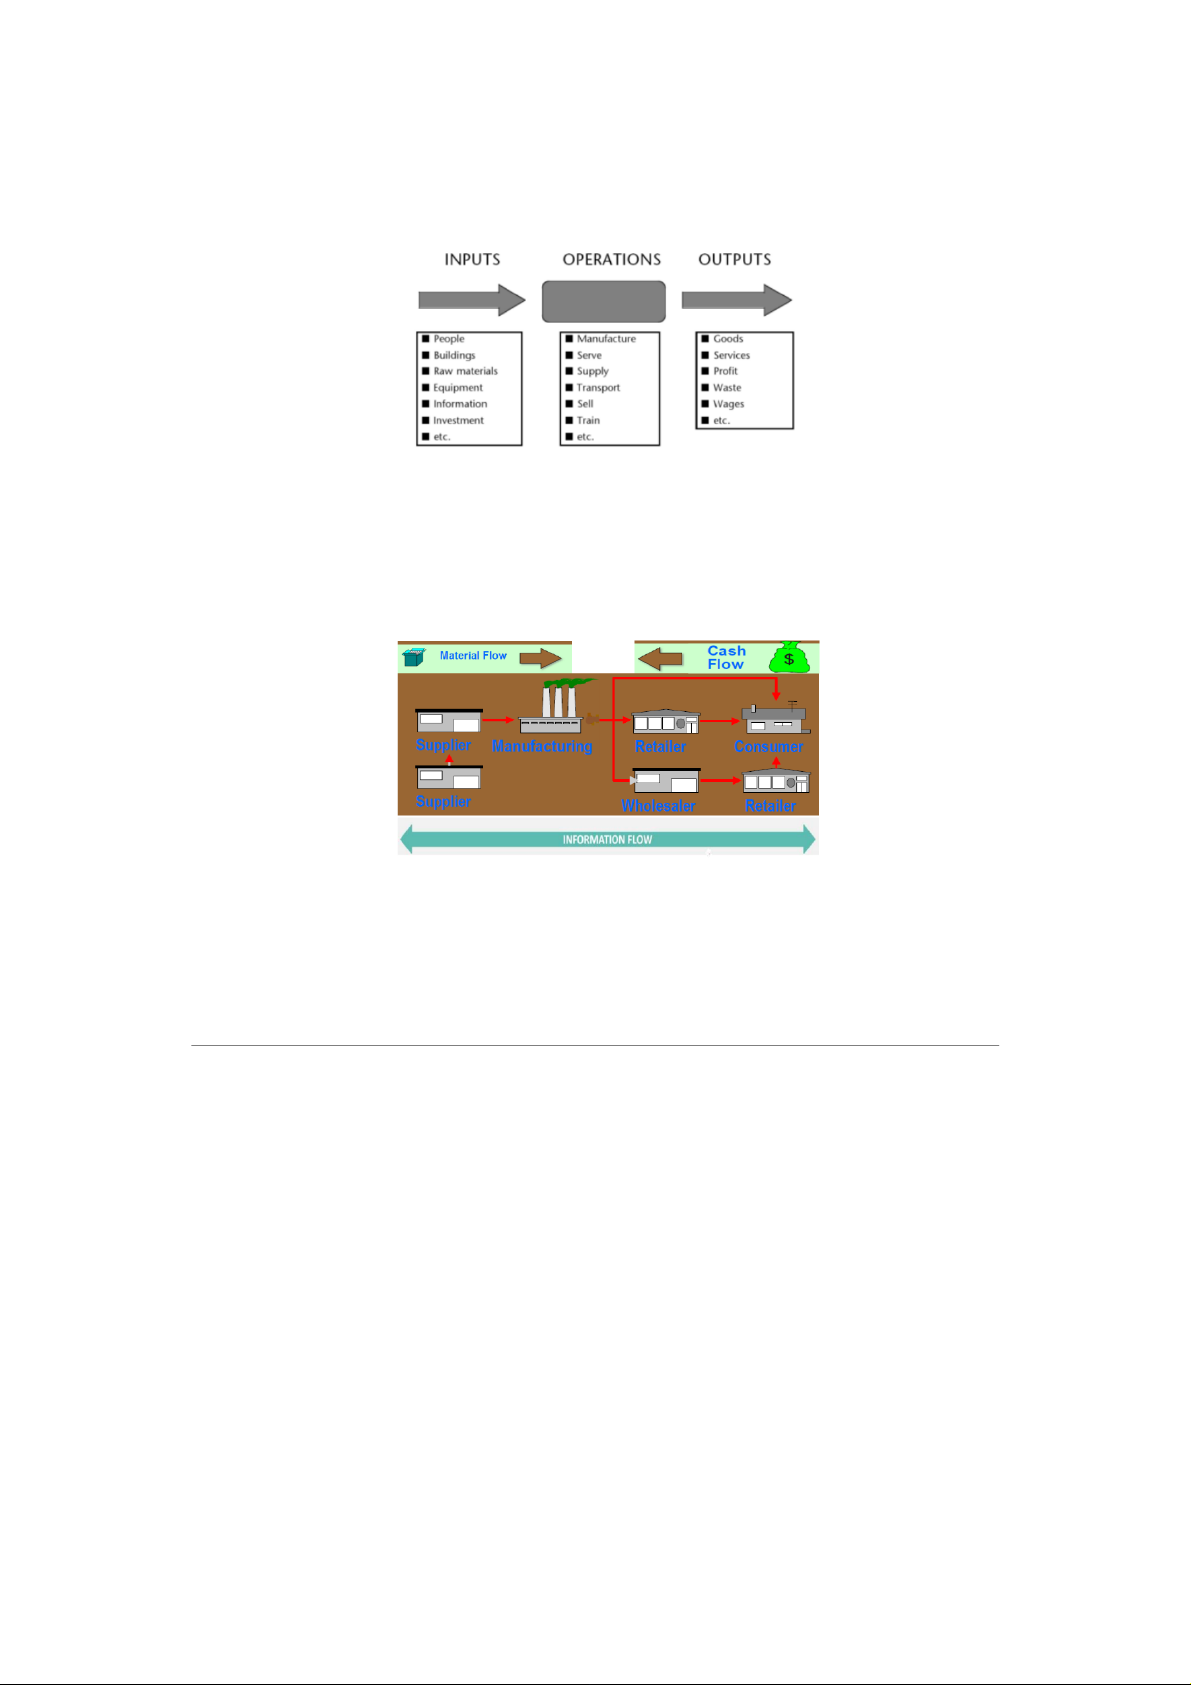
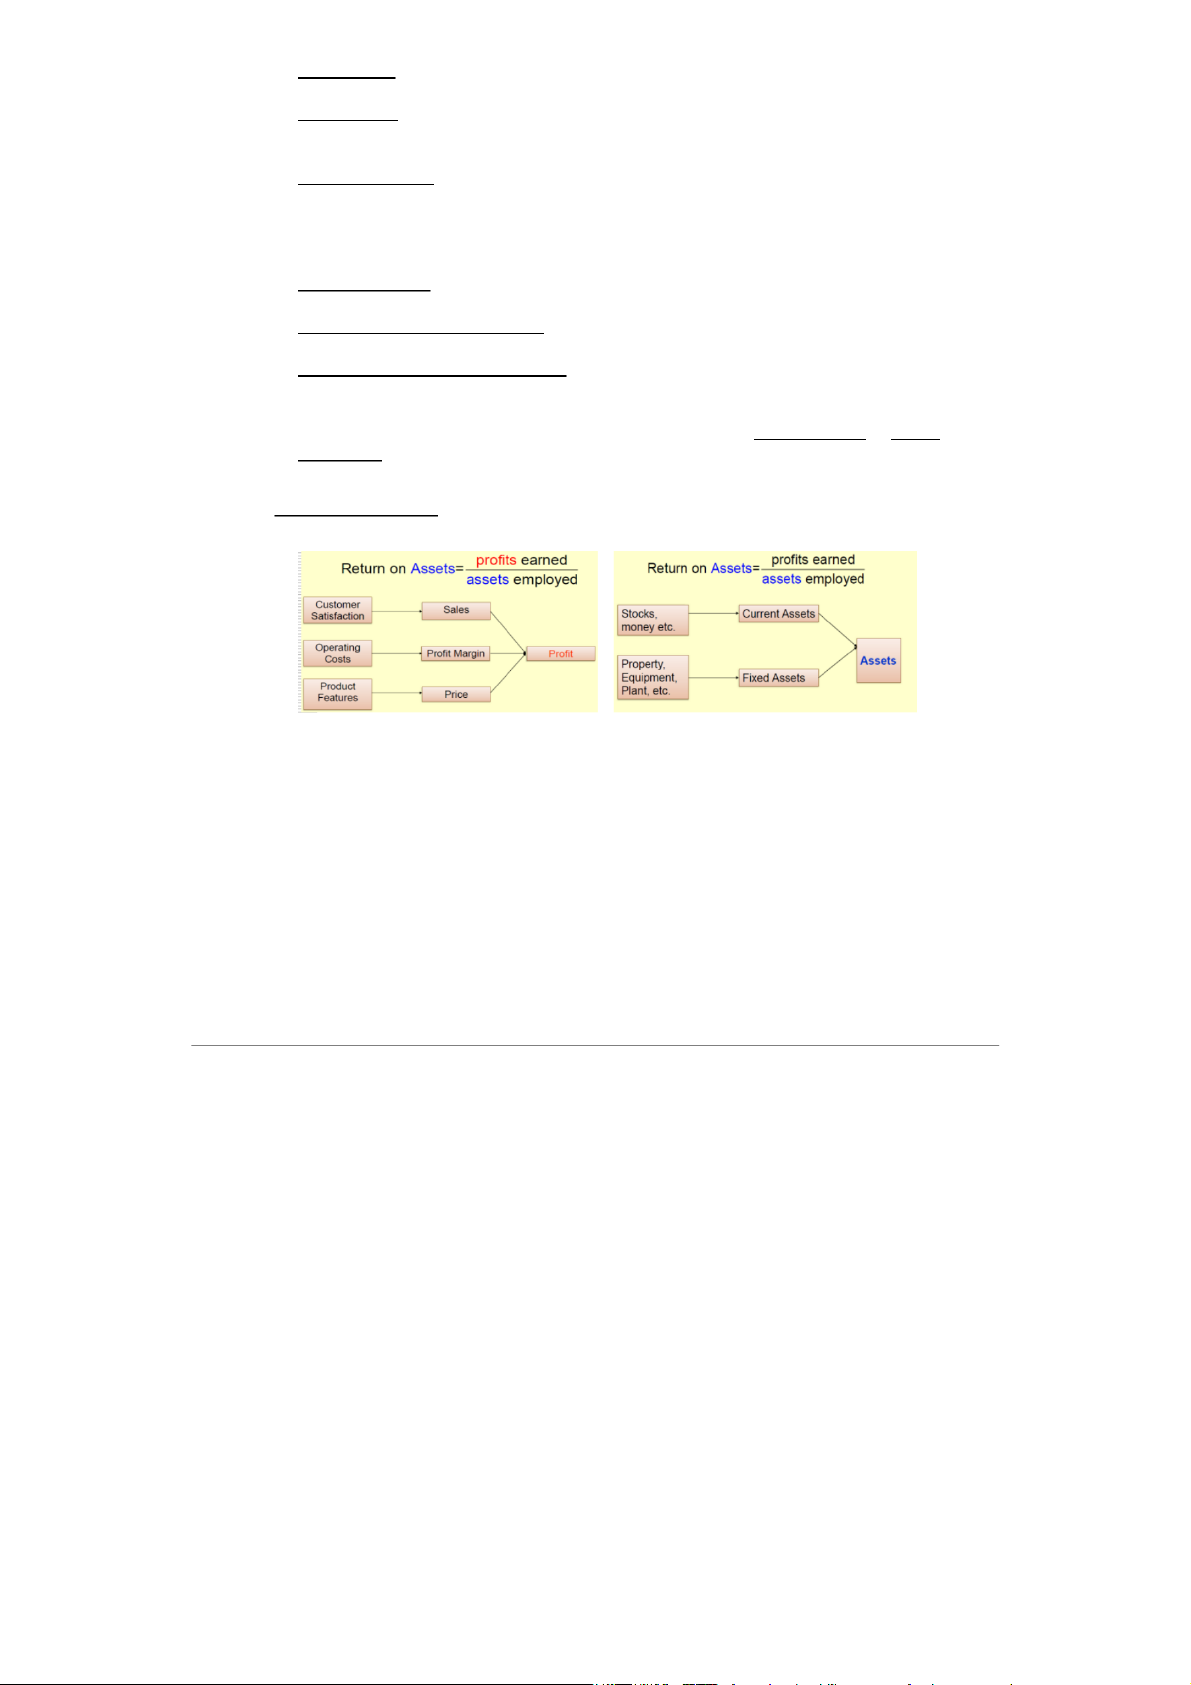
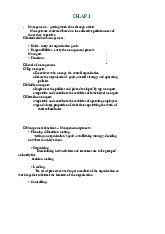
Supply chain management is defined as: “The planning and management of all activities involved
vice providers, and customers” – –
rs all know each other’s future plans and are willing to
work together → the planning process is easier and much more productive.
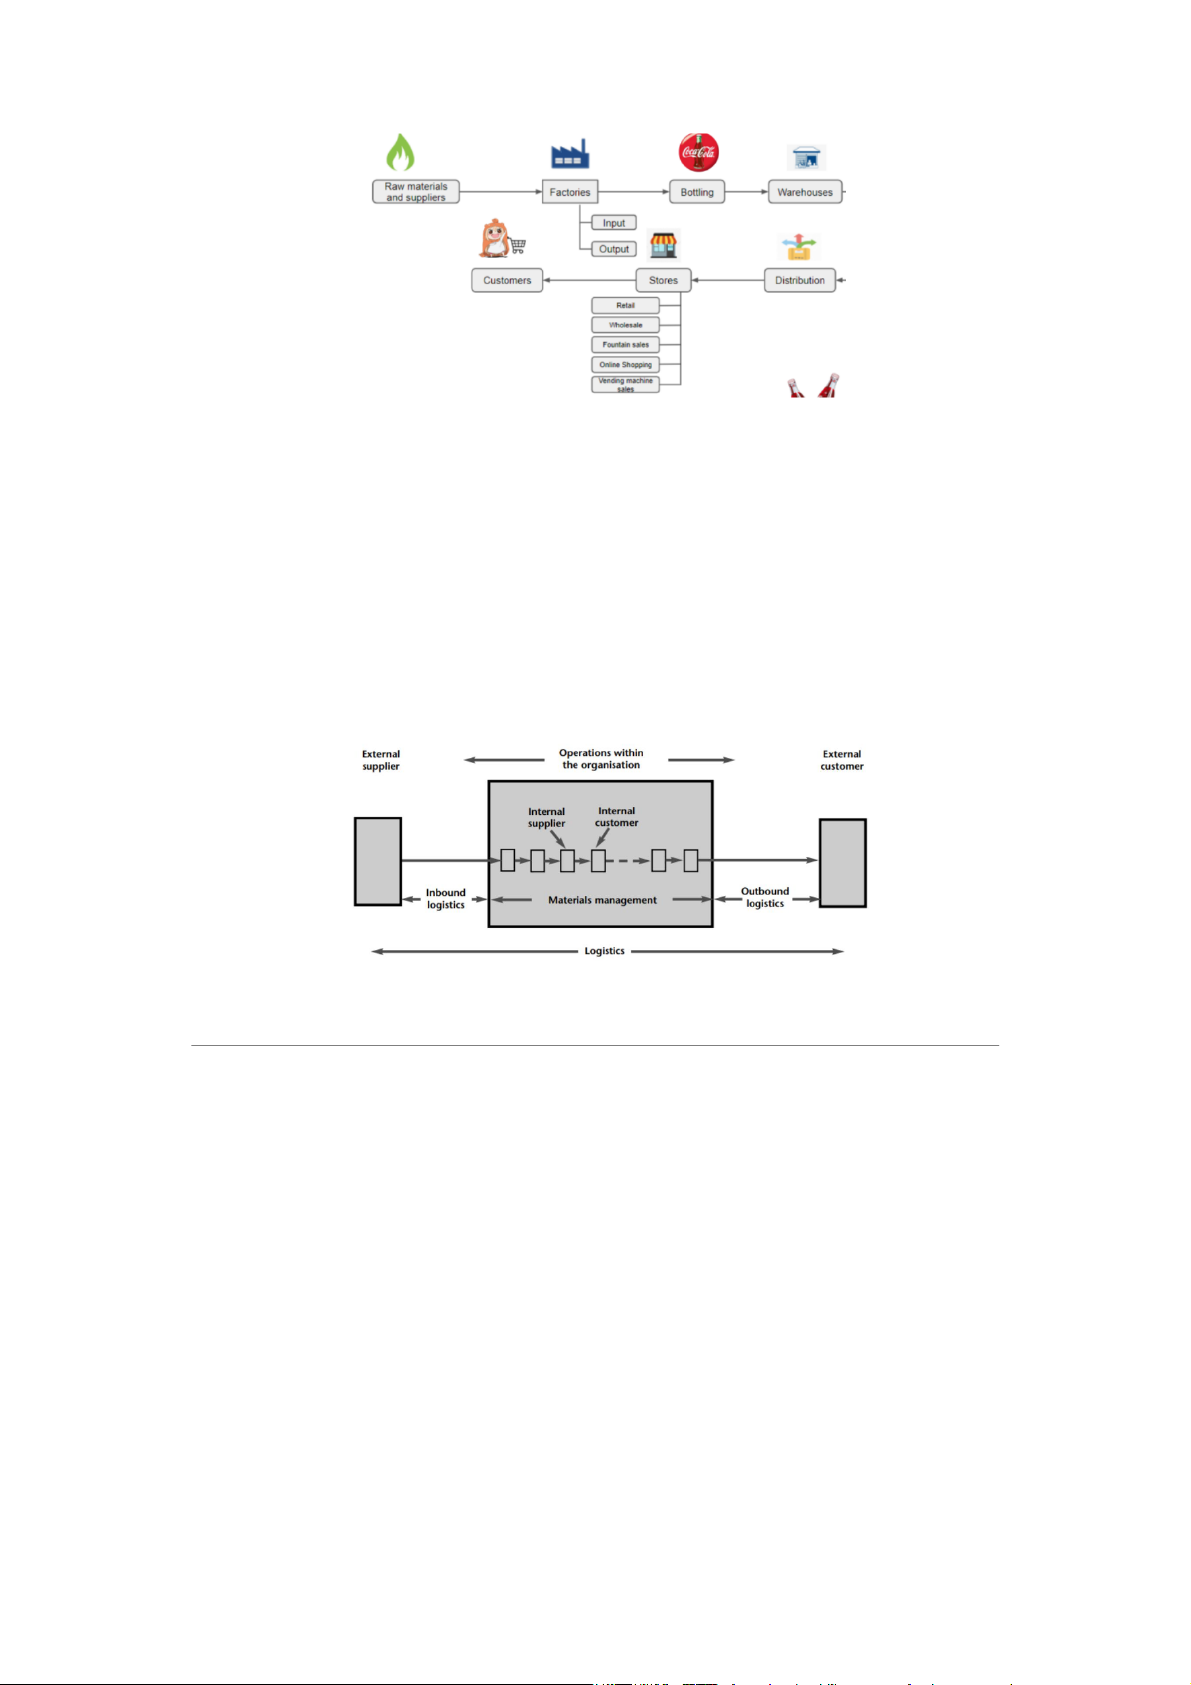
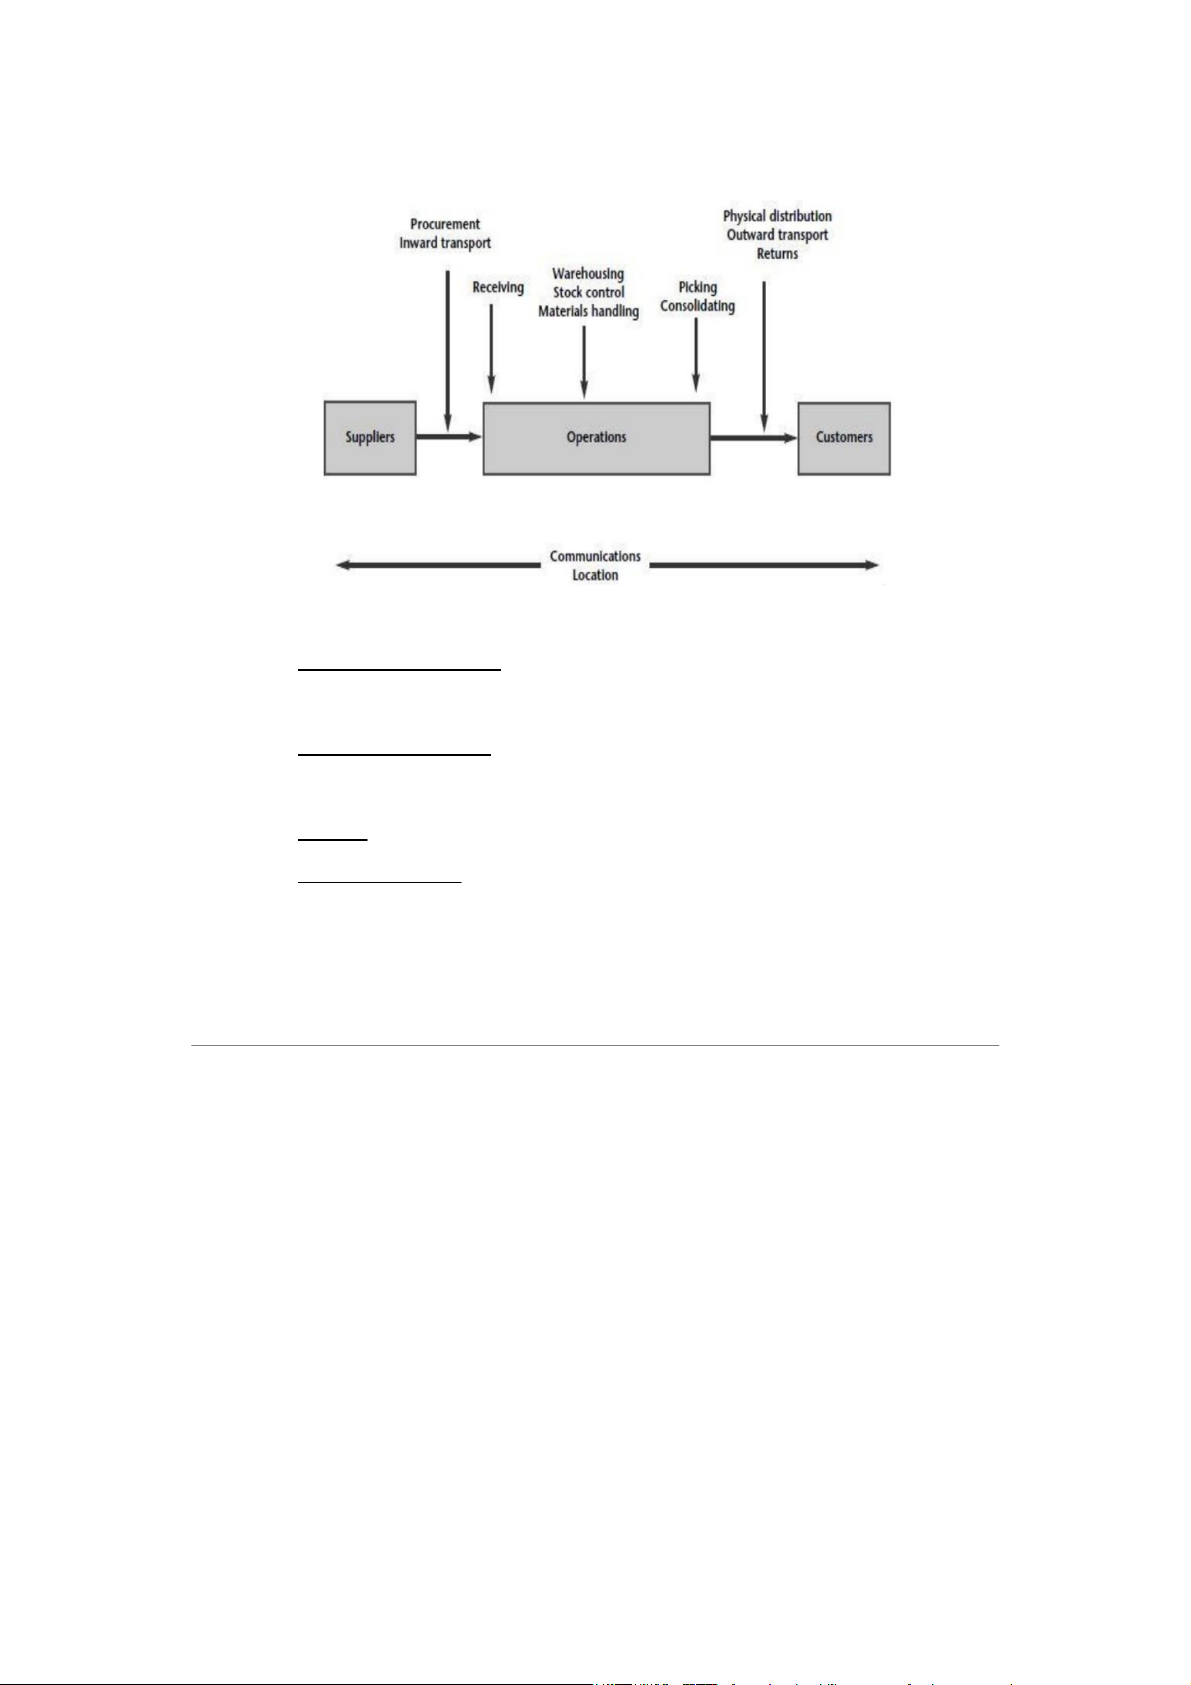
Up stream: Suppliers → Factory
Downstream: Factory → Customer o o
ves materials from suppliers to the organisation’s receiving sales of £10 million a year £7.5 million a year £20 million 10 million × 0.25 £ × × 0.2 = £0.5 million/
stock = 7.5 million + 0.5 million = £8 million
= sales − total costs = 10 million − 8 million = £2 million
= other assets + stock = 20 million + (10 million × 0.25) = £22.5 million = 10 million × 0.2 = £2 = stock × holding cost = × 0.2 = £0.
= 7.5 million + 0.4 million = £7.9 million
= 10 million − 7.9 million = £2.1 million
= £20 million + (£10 million × 0.20) = £22 million s → Affect
organization’s performance over many years.
A poor facility location leads to poor performance → low productivity, unreliable suppliers, o o ế ạ ợp đồ ặ ằ ⇒
Mergers (Sáp nhập) và Acquisitions (Mua ạ dairies,…).
Location of suppliers and materials (natural resources,…). materials, utilities, …).
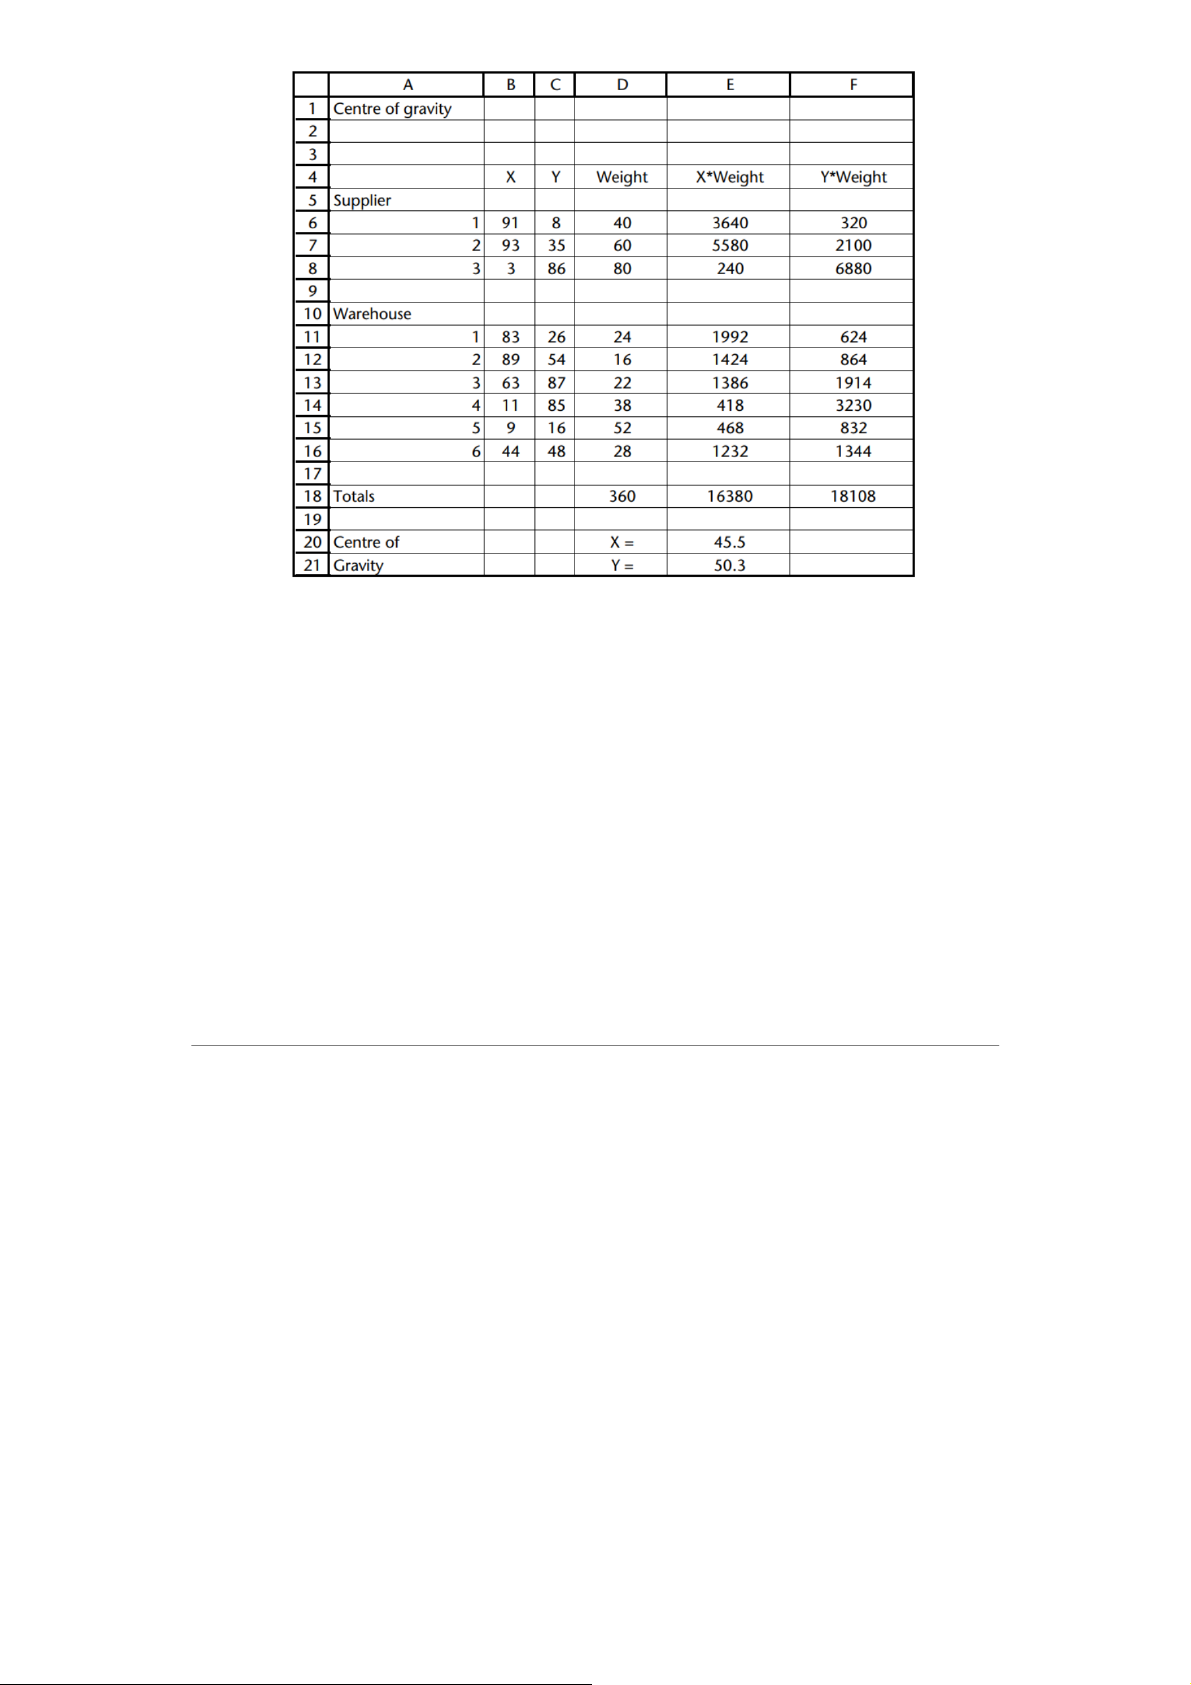
→ finds the best location in principle and then looks for a site nearby. 𝑋 𝑌 𝑋𝑖 𝑌𝑖 𝑖 𝑊𝑖 𝑖 𝑖 𝑋0=∑𝑋𝑖𝑊
∑ 𝑖𝑊𝑖=91.40 +93.60 + 3.80 +83.24 +89.16 +63.22 +11.38 + 9.52 +44.28
40 +60 +80 +24 +16 +22 +38 +52 +28 =16380 360 =45.5 𝑌0=∑𝑌𝑖𝑊
∑ 𝑖𝑊𝑖=8.40 +35.60 +86.80 +26.24 +54.16 +87.22 +85.38 +16.52 +48.28
40 +60 +80 +24 +16 +22 +38 +52 +28 =18108 360 =50.3 ⇒ ⇒
In practice, many of the costs of running a facility are fixed regardless of its location → we
Assume that the operating costs in nearby locations are the same → we only concentrate of
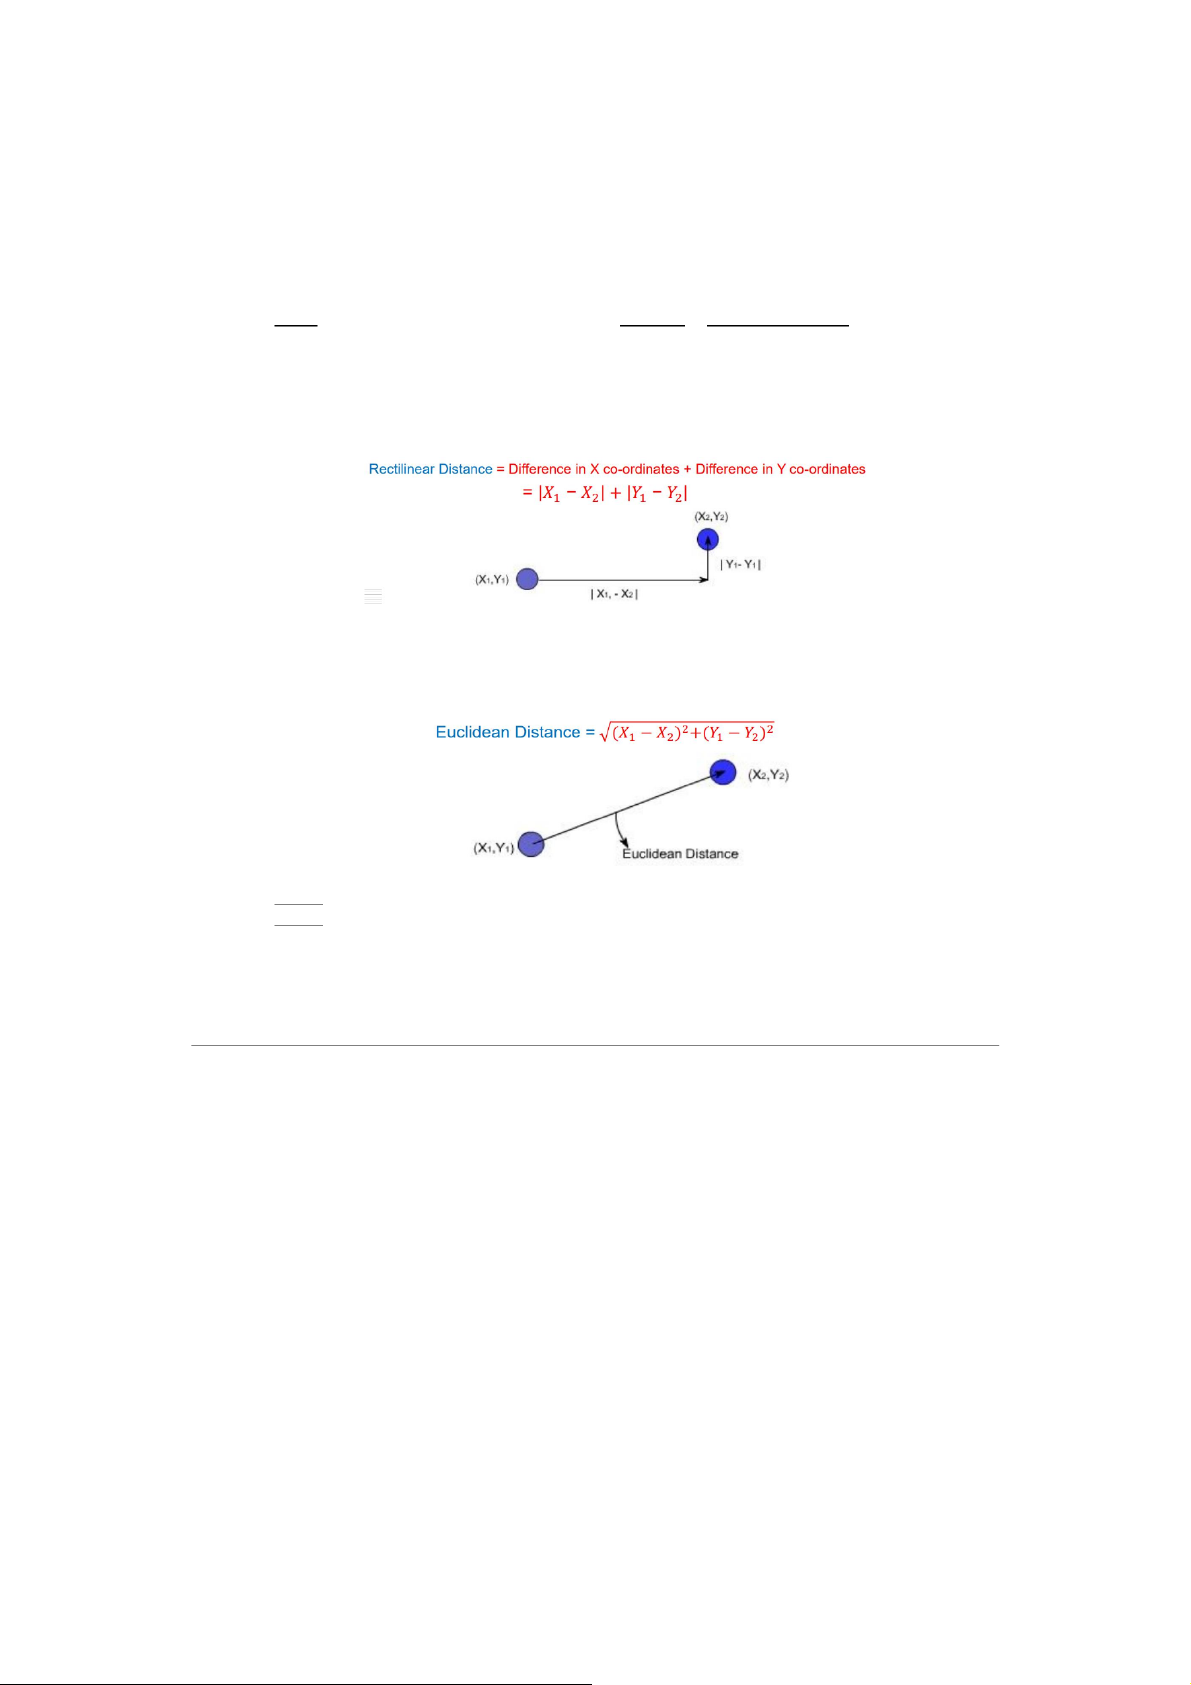
Assume that the transport cost is proportional to the distance moved → Rectilinear distance → the distance is ca 𝑋 𝑌 𝑋 𝑌 ) → the
th between the two facilities → the distance 𝑋 𝑌 𝑋 𝑌 ) → the 𝐿𝐷 𝒏
𝑳𝑫 =∑𝒍𝒊× 𝒅𝒊 𝒊=𝟏 𝑙𝑖 𝑖 𝑑𝑖 𝑖 𝑛
→ To avoid these problems, other method for comparison is used. – –
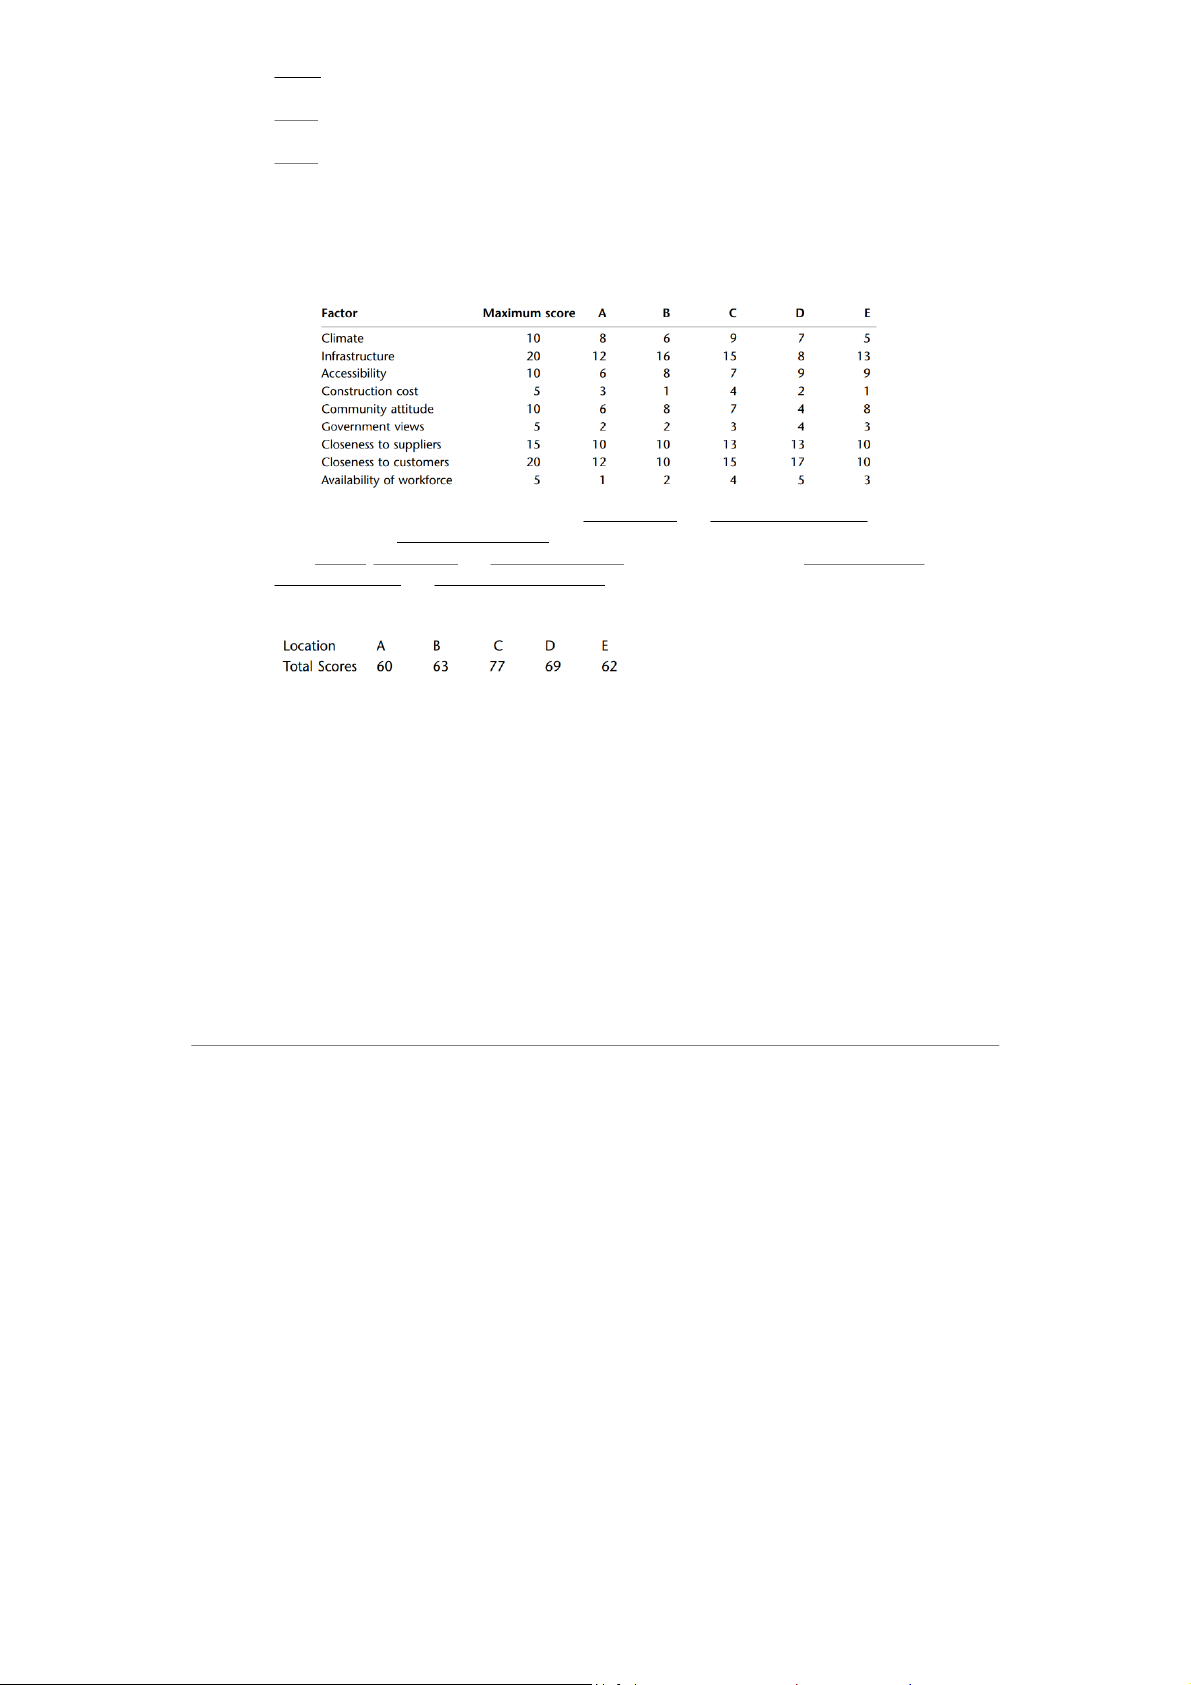
Although we cannot quantify these factors directly → giving each a score. The scoring model → Standard analysis
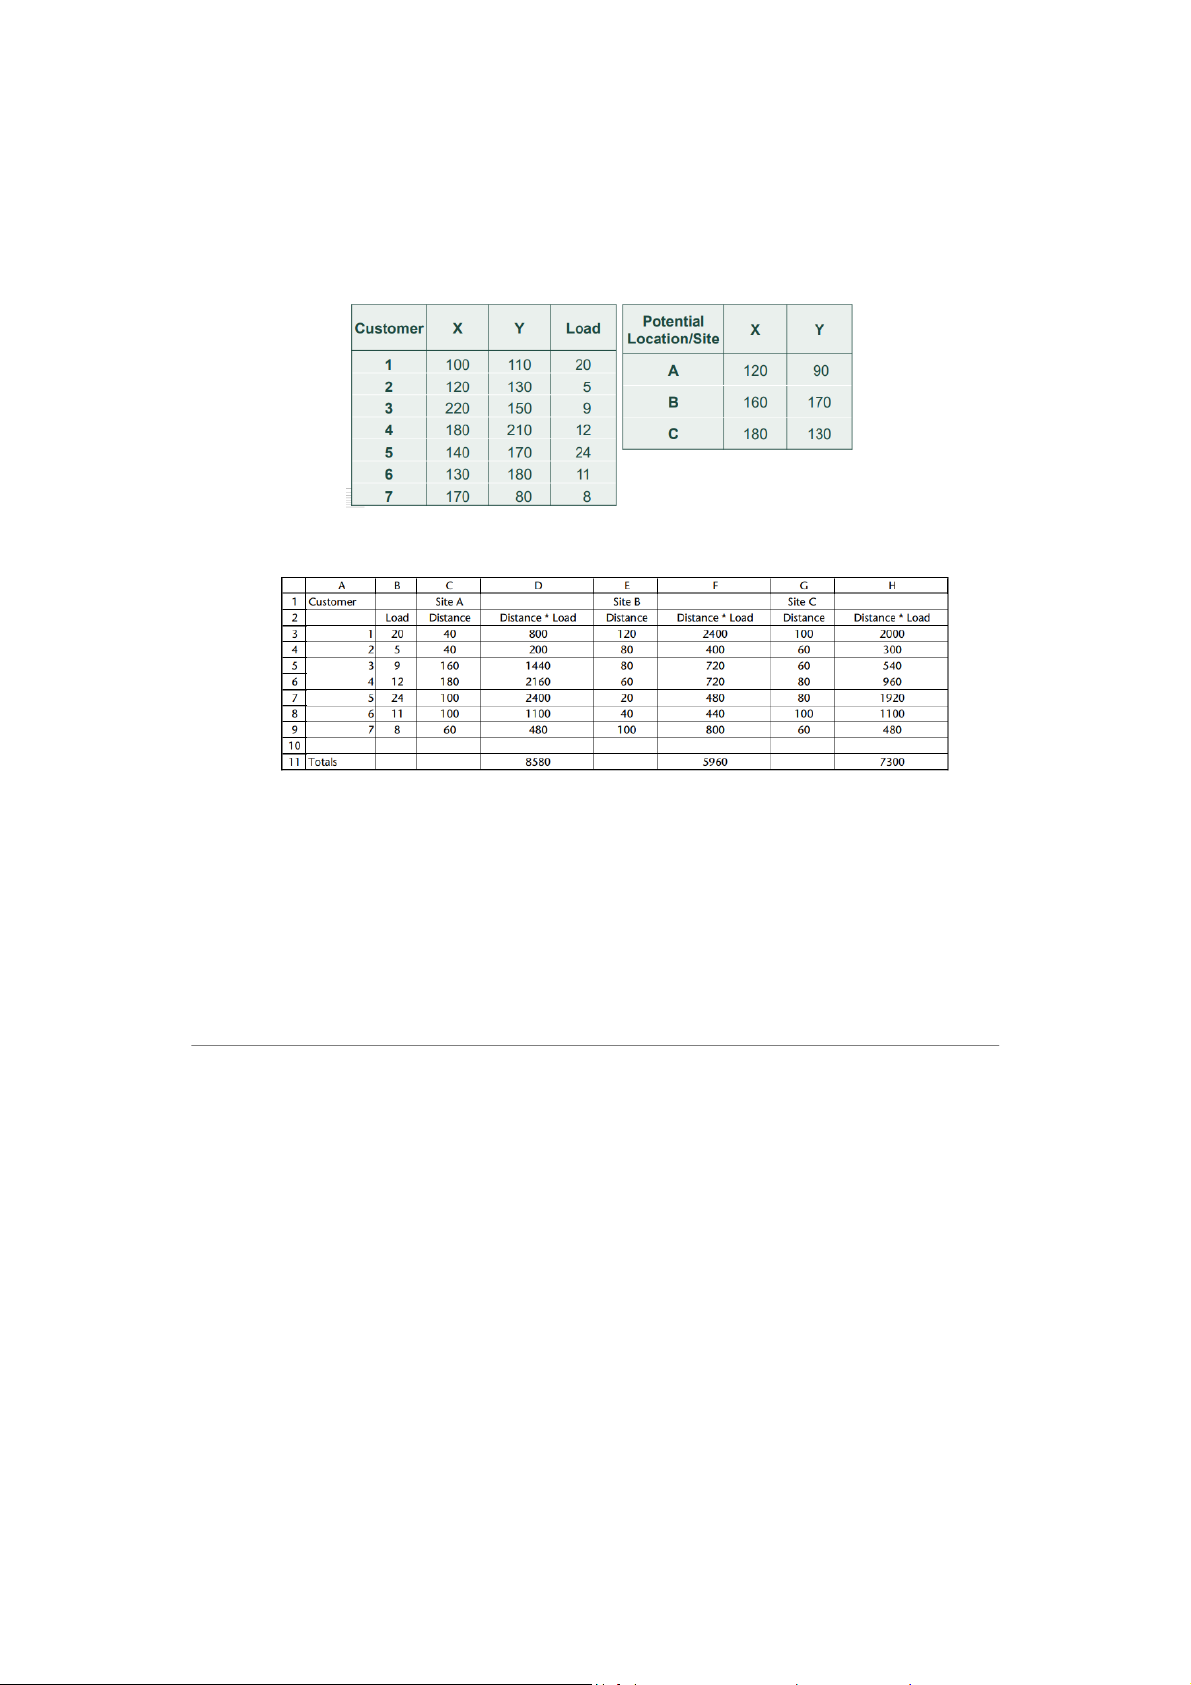
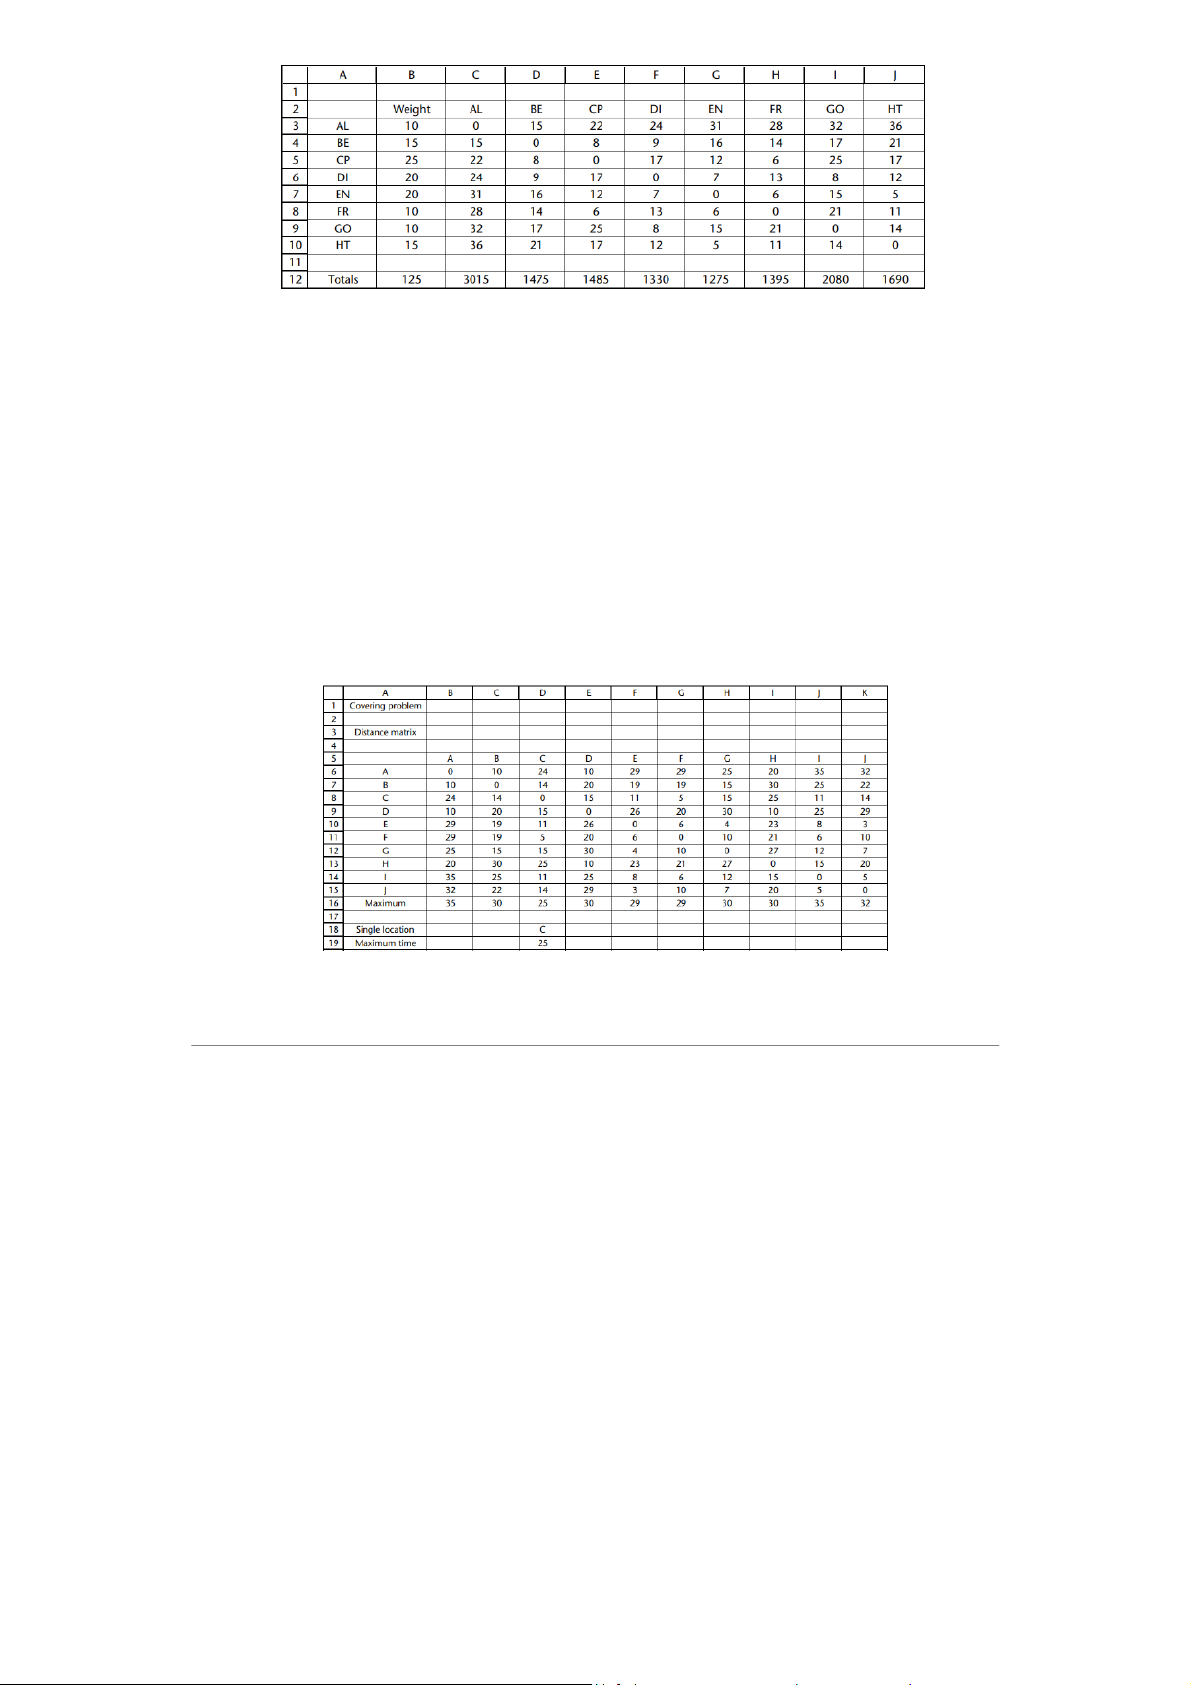
distance of a centre at AL = (10 × 0) + (15 × 15) + (25 × 22) + (20 × 24) + (20 × 31) +
(10 × 28) + (10 × 32) + (15 × 36) = 3015 → To solve this problem,
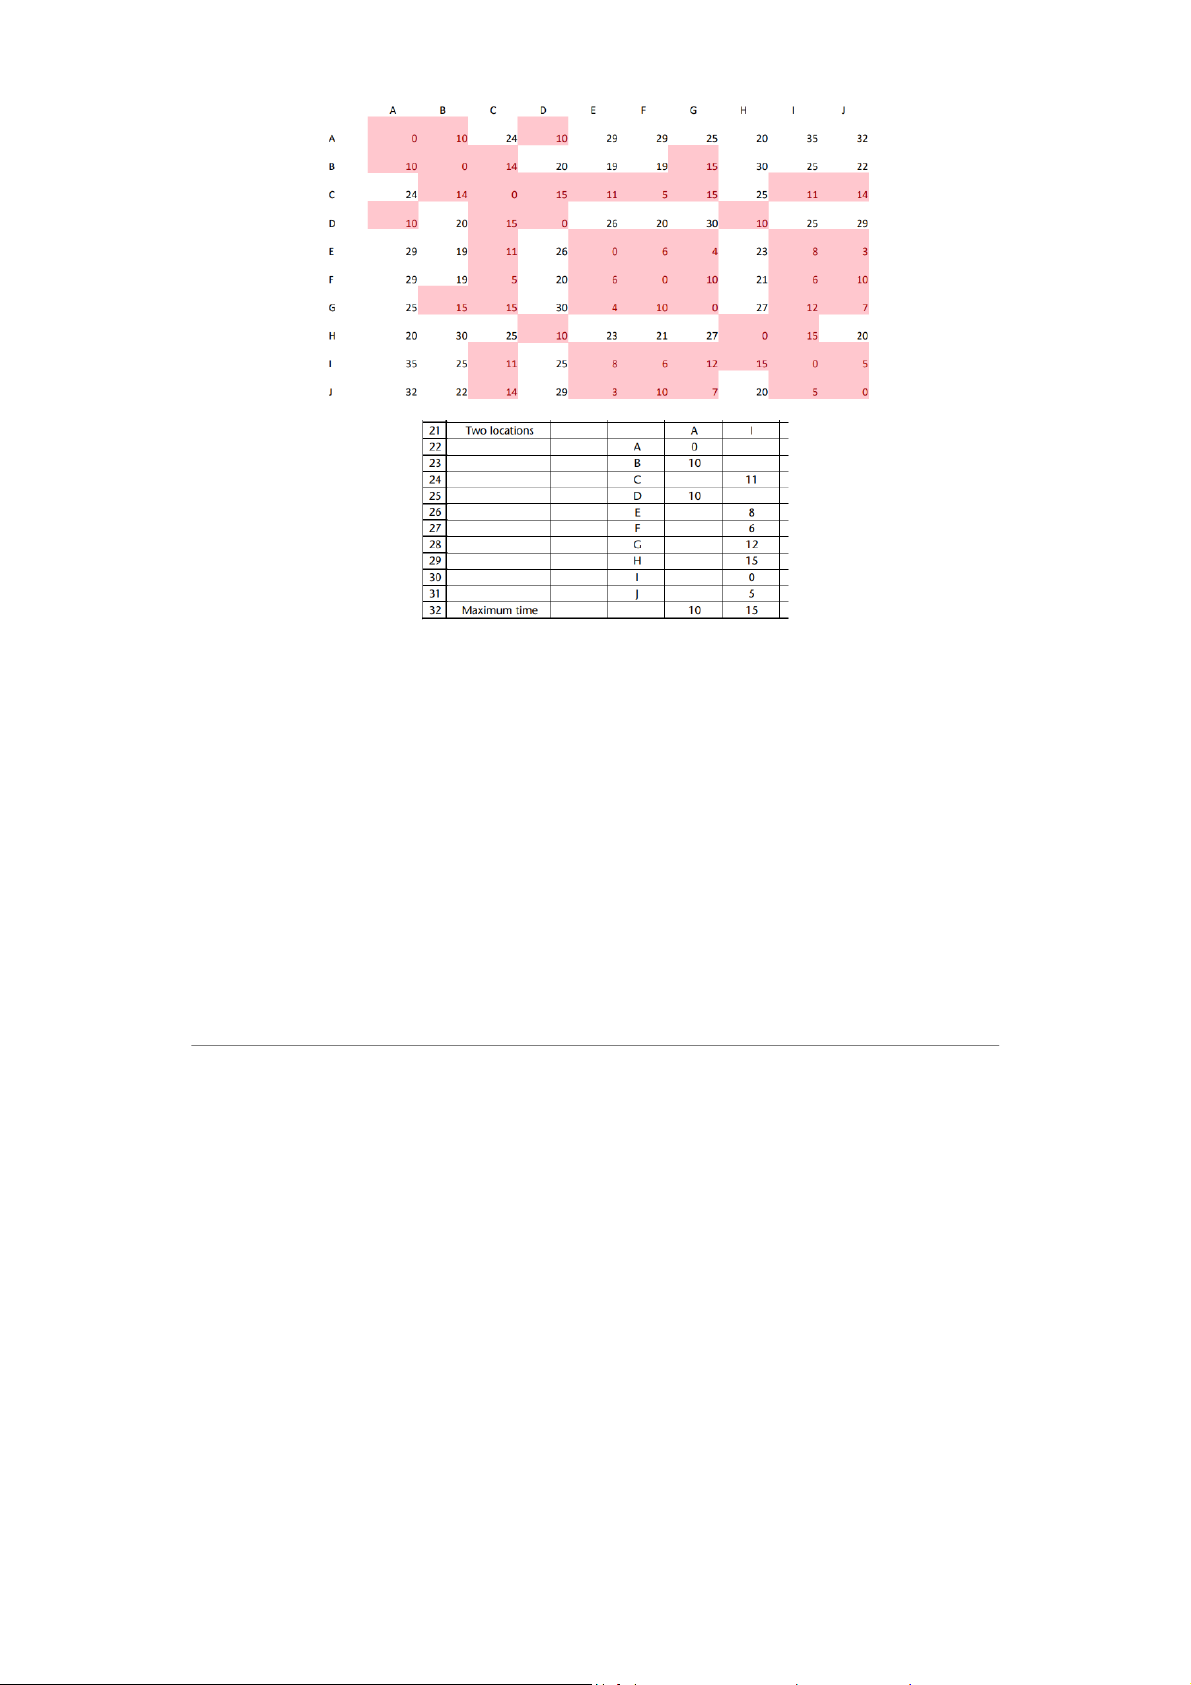
Specifies a level of service that must be achieved → Find the number of facilities needed to
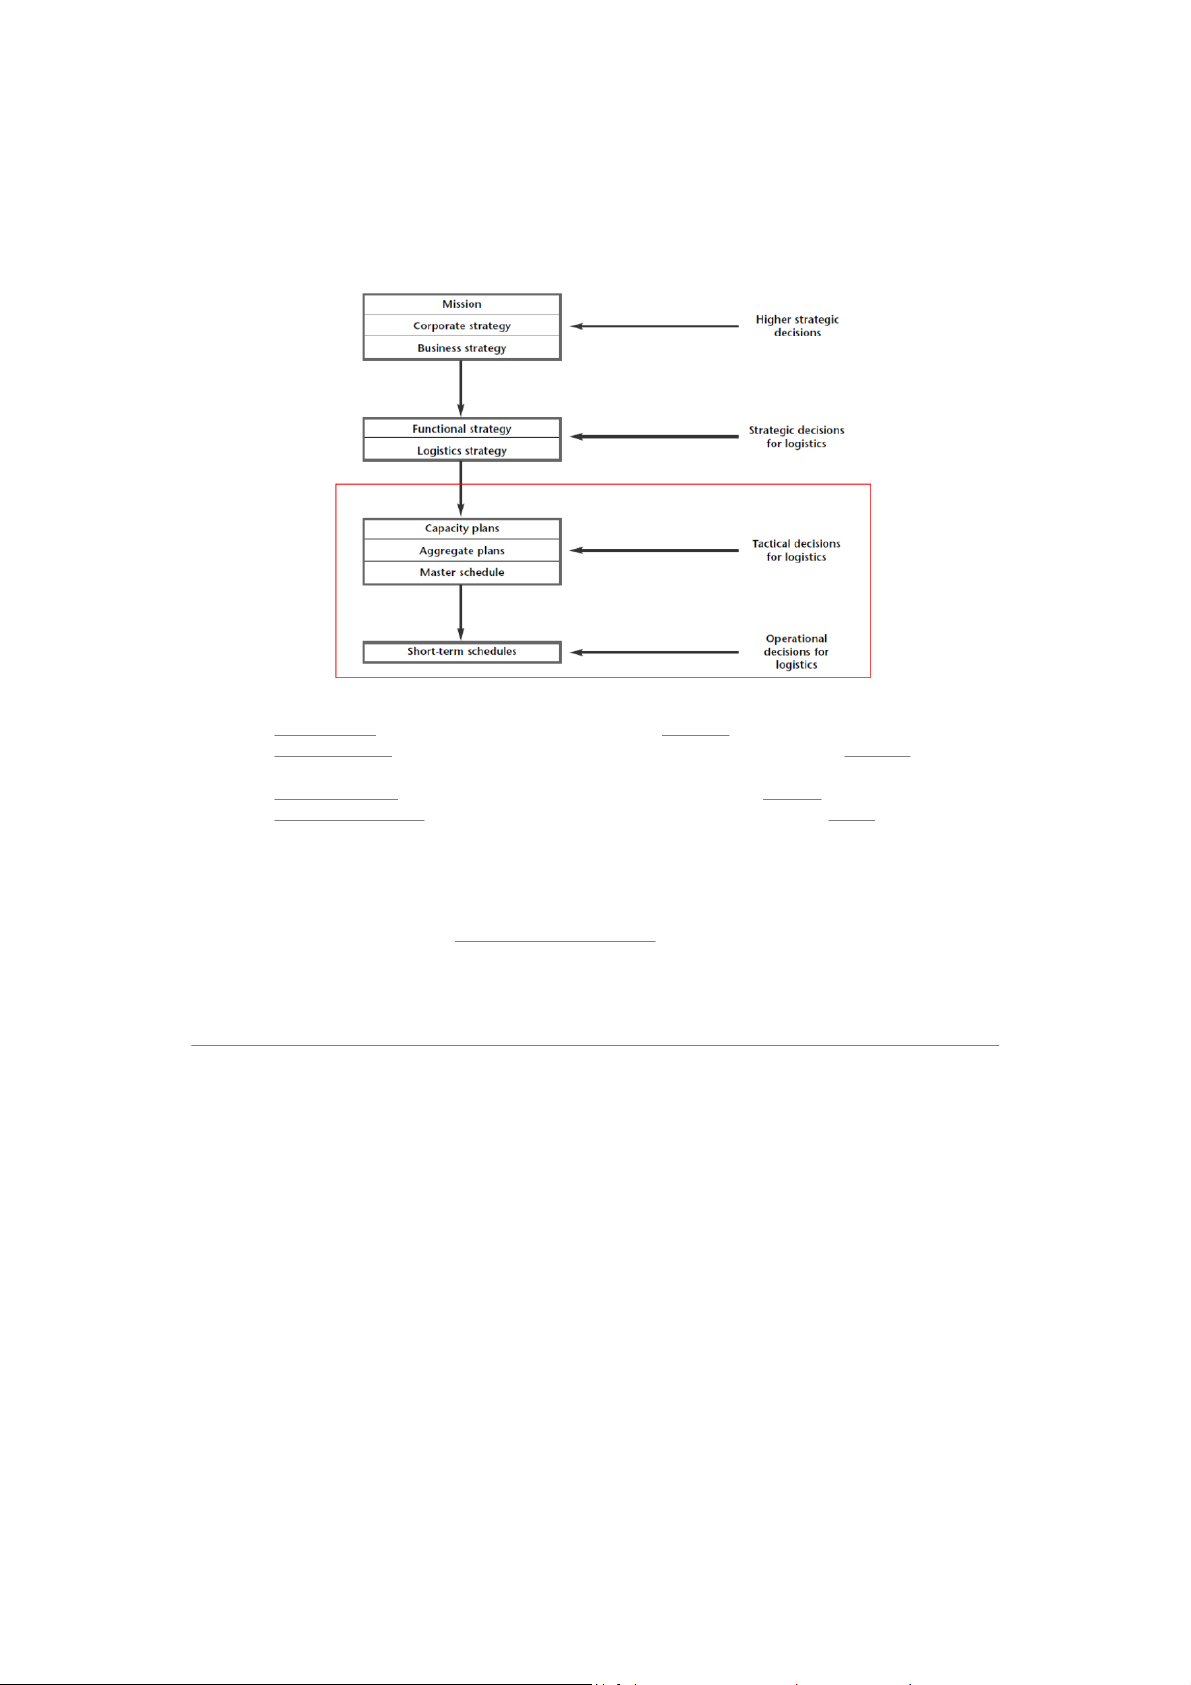
All activities along the supply chain have to be planned → It means that we design timetables
If an organization does not plan for the future → it can be in danger of ⇒
𝐸𝑓𝑓𝑒𝑐𝑡𝑖𝑣𝑒 𝑢𝑡𝑖𝑙𝑖𝑧𝑎𝑡𝑖𝑜𝑛 =
𝐴𝑐𝑡𝑢𝑎𝑙 𝑜𝑢𝑡𝑝𝑢𝑡
𝐸𝑓𝑓𝑒𝑐𝑡𝑖𝑣𝑒 𝑐𝑎𝑝𝑎𝑐𝑖𝑡𝑦 ×100%
𝐷𝑒𝑠𝑖𝑔𝑛 𝑢𝑡𝑖𝑙𝑖𝑧𝑎𝑡𝑖𝑜𝑛 = 𝐴𝑐𝑡𝑢𝑎𝑙 𝑜𝑢𝑡𝑝𝑢𝑡
𝐷𝑒𝑠𝑖𝑔𝑛 𝑐𝑎𝑝𝑎𝑐𝑖𝑡𝑦 ×100%
𝐸𝑓𝑓𝑒𝑐𝑡𝑖𝑣𝑒 𝑢𝑡𝑖𝑙𝑖𝑧𝑎𝑡𝑖𝑜𝑛 = 𝐸 𝐴 𝑓 𝑐 𝑓 𝑡 𝑒𝑢 𝑐 𝑎 𝑡 𝑙 𝑖 𝑣𝑜 𝑒𝑢 𝑡 𝑐 𝑝 𝑎 𝑢 𝑝 𝑡
𝑎𝑐𝑖𝑡𝑦 ×100% = 200 230 ×100% = 86.9%
𝐷𝑒𝑠𝑖𝑔𝑛 𝑢𝑡𝑖𝑙𝑖𝑧𝑎𝑡𝑖𝑜𝑛 = 𝐴 𝐷𝑐 𝑒𝑡𝑢 𝑠𝑖 𝑎 𝑔 𝑙 𝑛 𝑜 𝑐𝑢 𝑎𝑡𝑝 𝑝 𝑢 𝑎 𝑡 𝑐𝑖𝑡𝑦 ×100% = 200 300 ×100% = 66.7%
utilization shows that the company didn’t use its fully capacity
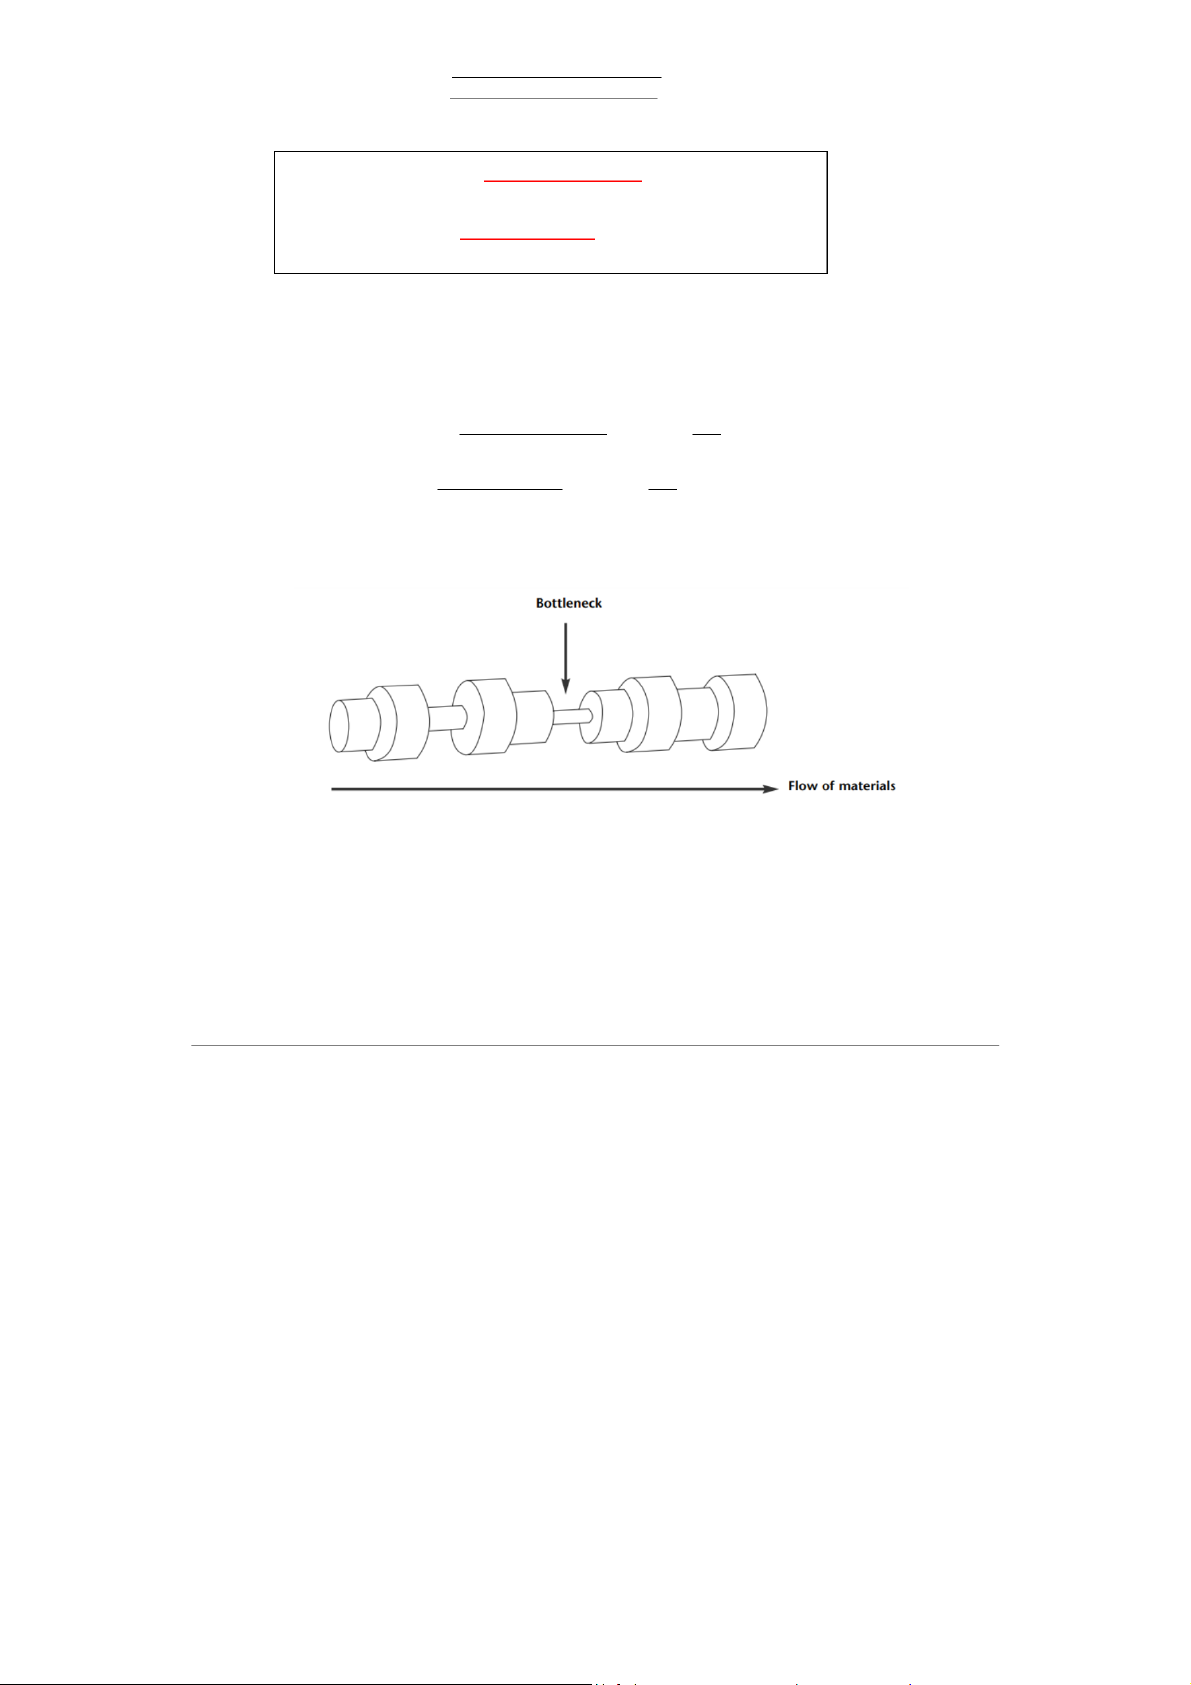
Not all parts of a supply chain have the same capacity → Some parts limit overall throughput,
→ The bottlenecks in a supply chain limit its overall
Tài liệu liên quan:
-
CHAP 1: Introduction to Management Concepts and Functions môn Principles of Management | Trường Đại học Quốc tế, Đại học Quốc gia Thành phố Hồ Chí Minh
1 1 -
Guidelines for group’s assignments: Analysing management issues of a FDI company based inVietnam môn Principles of Management | Trường Đại học Quốc tế, Đại học Quốc gia Thành phố Hồ Chí Minh
1 1 -
Financial Planning to Achieve 300m VND Goal in 3 Years môn Principles of Management | Trường Đại học Quốc tế, Đại học Quốc gia Thành phố Hồ Chí Minh
1 1 -
A Case Study in Fast Fashion Success môn Principles of Management | Trường Đại học Quốc tế, Đại học Quốc gia Thành phố Hồ Chí Minh
1 1 -
Chap 16 Hierarchy of Needs Theory and Applications môn Principles of Management | Trường Đại học Quốc tế, Đại học Quốc gia Thành phố Hồ Chí Minh
1 1