Lecture 10 - ENEE1006IU
Tài liệu học tập môn Applied statistics (ENEE1006IU) tại Trường Đại học Quốc tế, Đại học Quốc gia Thành phố Hồ Chí Minh. Tài liệu gồm 21 trang giúp bạn ôn tập hiệu quả và đạt điểm cao! Mời bạn đọc đón xem!
Môn: Applied statistics (ENEE1006IU) 47 tài liệu
Trường: Trường Đại học Quốc tế, Đại học Quốc gia Thành phố Hồ Chí Minh 1.9 K tài liệu
Tác giả:


Preview text:
lOMoARcPSD|364 906 32 APPLIED STATISTICS COURSE CODE: ENEE1006IU Lecture 10: Chapter 6: t-Test
(3 credits: 2 is for lecture, 1 is for lab-work)
Instructor: TRAN THANH TU Email: tttu@hcmiu.edu.vn tttu@hcmiu.edu.vn 1 lOMoARcPSD|364 906 32 T-TEST
• For example, two methods for making a chemical analysis are compared to see if the
new one is equivalent to the older standard method; algae are grown under different
conditions to study a factor that is thought to stimulate growth; etc.
“Do two different methods of doing A give different results?”
“Can we be highly confident that the difference is positive or negative?”
“How large might the difference be?”
• One experimental design is to make a series of tests using treatment A and then to
independently make a series of tests using method B. Independent t-test
• A second way of designing the experiment is to pair the samples according to time,
technician, batch of material, or other factors that might contribute to a difference
between the two measurements Paired t-test tttu@hcmiu.edu.vn 2 lOMoARcPSD|364 906 32
6.1. PAIRED T-TEST FOR ASSESSING THE AVERAGE OF DIFFERENCES
•Two samples are said to be paired when each data point in the first sample is
matched and related to a unique data point in the second sample.
•Paired experiments are used when it is difficult to control all factors that might influence the outcome.
•If these factors cannot be controlled, the experiment is arranged so they are
equally likely to influence both of the paired observations. Paired data are
evaluated using the paired t-test •The classical null hypothesis is:
“The difference between the two methods is zero.” tttu@hcmiu.edu.vn 3 lOMoARcPSD|364 906 32
6.1. PAIRED T-TEST FOR ASSESSING THE AVERAGE OF DIFFERENCES
•The paired t-test examines the average of the differences between paired observations
•Let (X11, X21), (X12, X22), … , (X1n, X2n) be a set of n paired observations where: -µ1 and
are the mean and variance of the population represented by X1 -µ2 and
are the mean and variance of the population represented by X2
Define the differences between each pair of observations as Dj=X1j - X2j, (j= 1, 2, …, n)
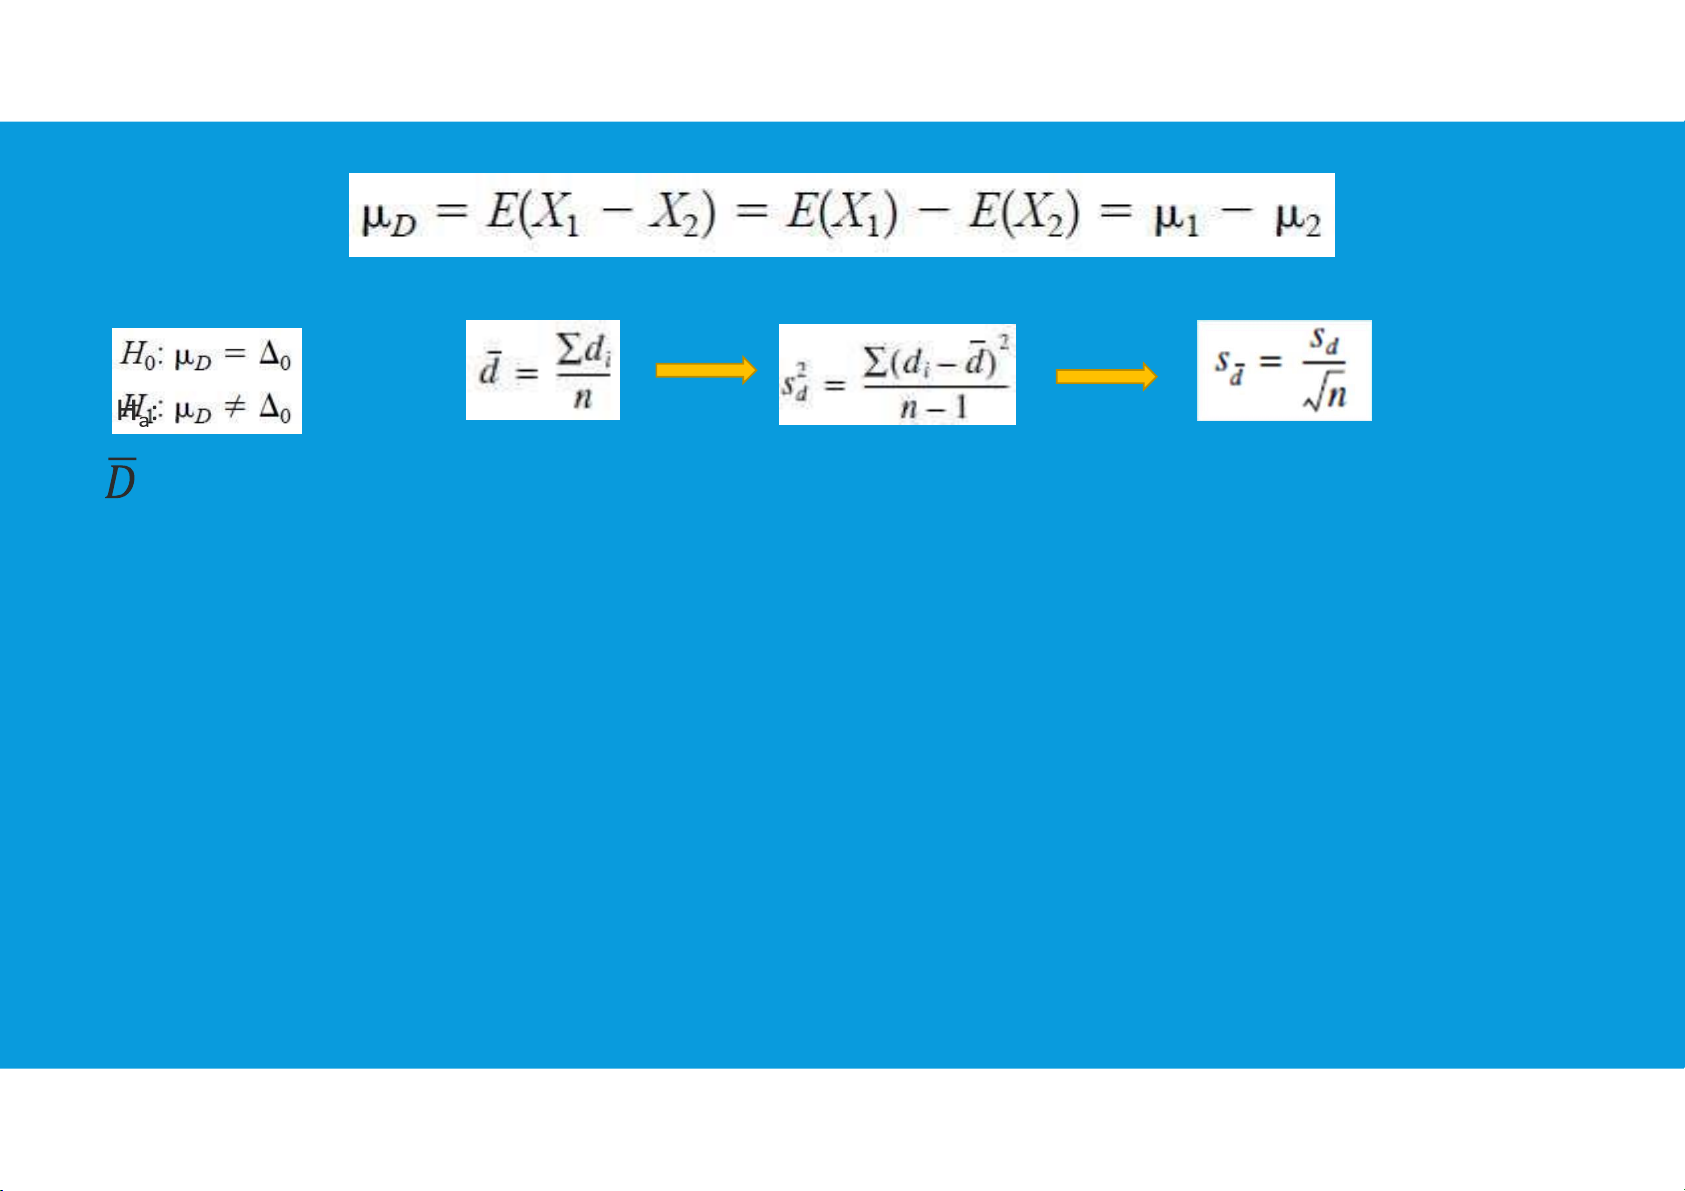
The Dj’s are assumed to be normally distributed with mean µD and variance tttu@hcmiu.edu.vn 4 lOMoARcPSD|364 906 32
6.1. PAIRED T-TEST FOR ASSESSING THE AVERAGE OF DIFFERENCES
: the sample average of the n differences D1, D2, … , Dn SD: the
sample standard deviation of these differences tttu@hcmiu.edu.vn 5 lOMoARcPSD|364 906 32 : : : tttu@hcmiu.edu.vn 6 lOMoARcPSD|364 906 32
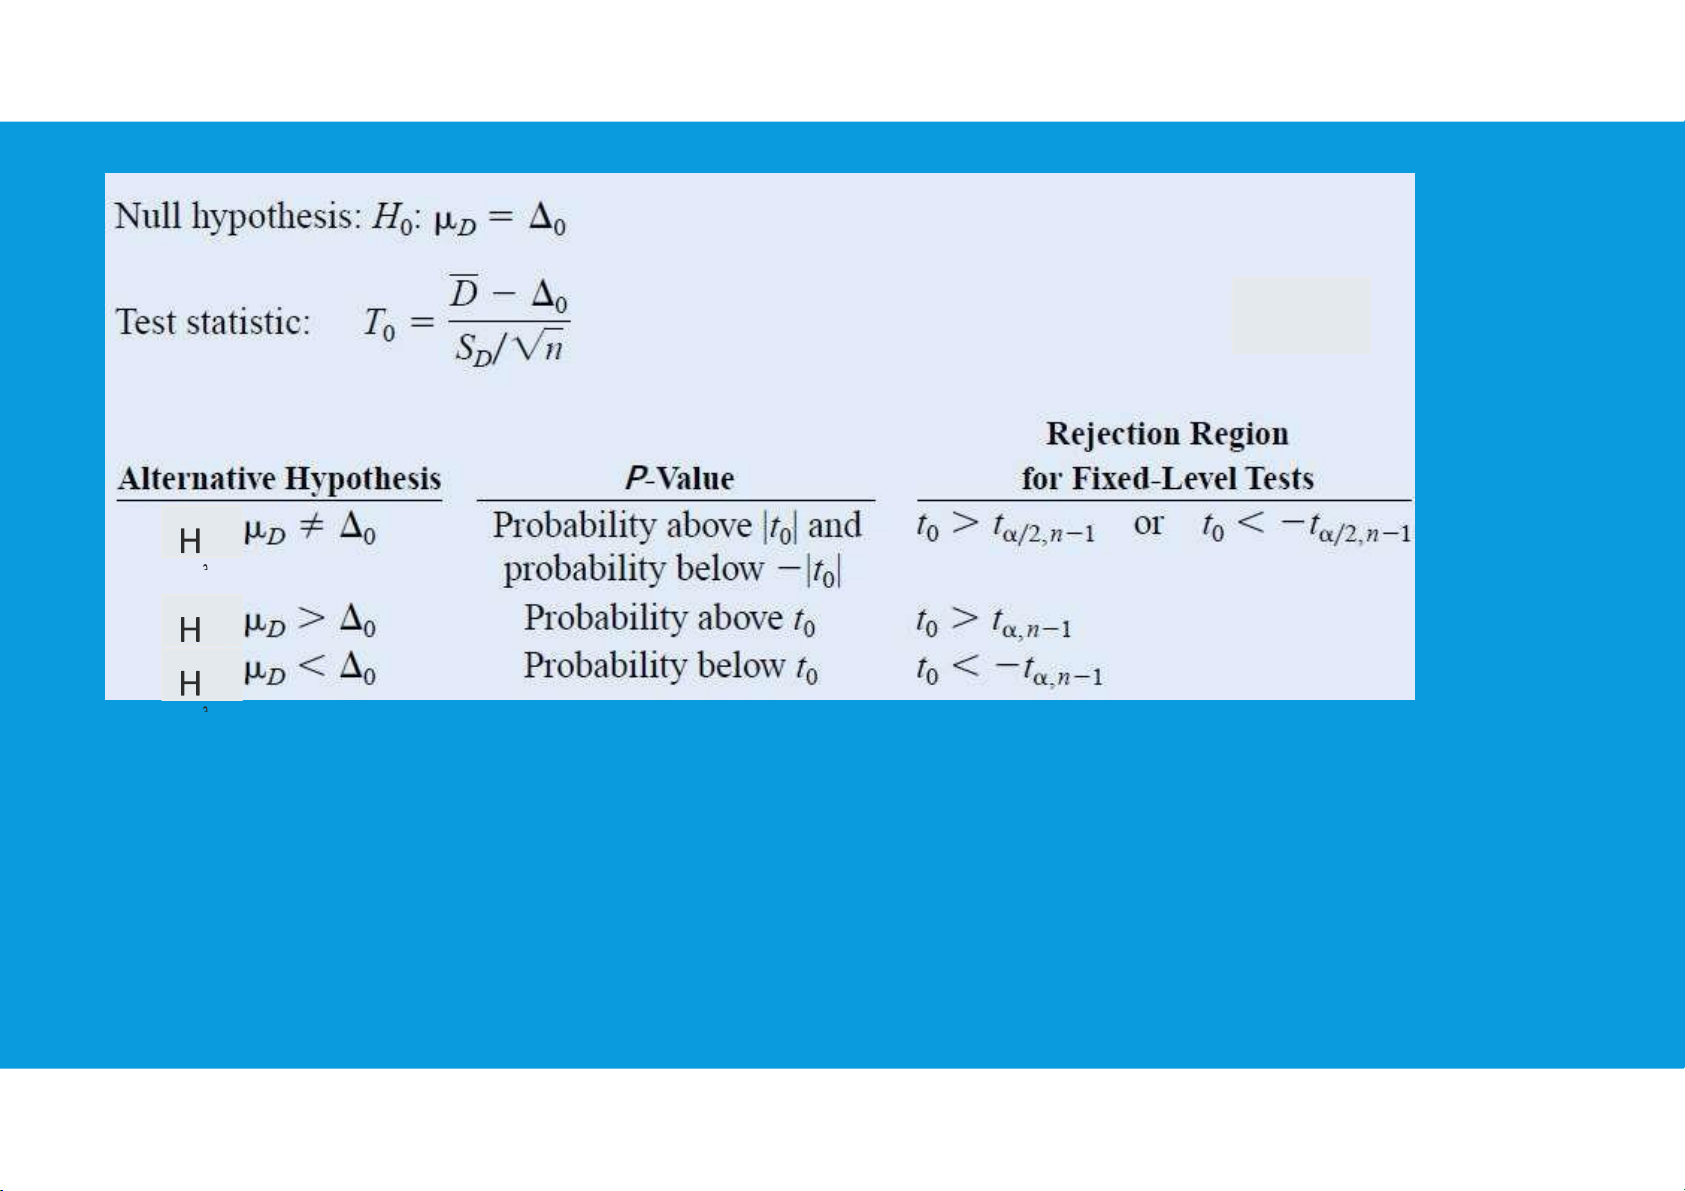
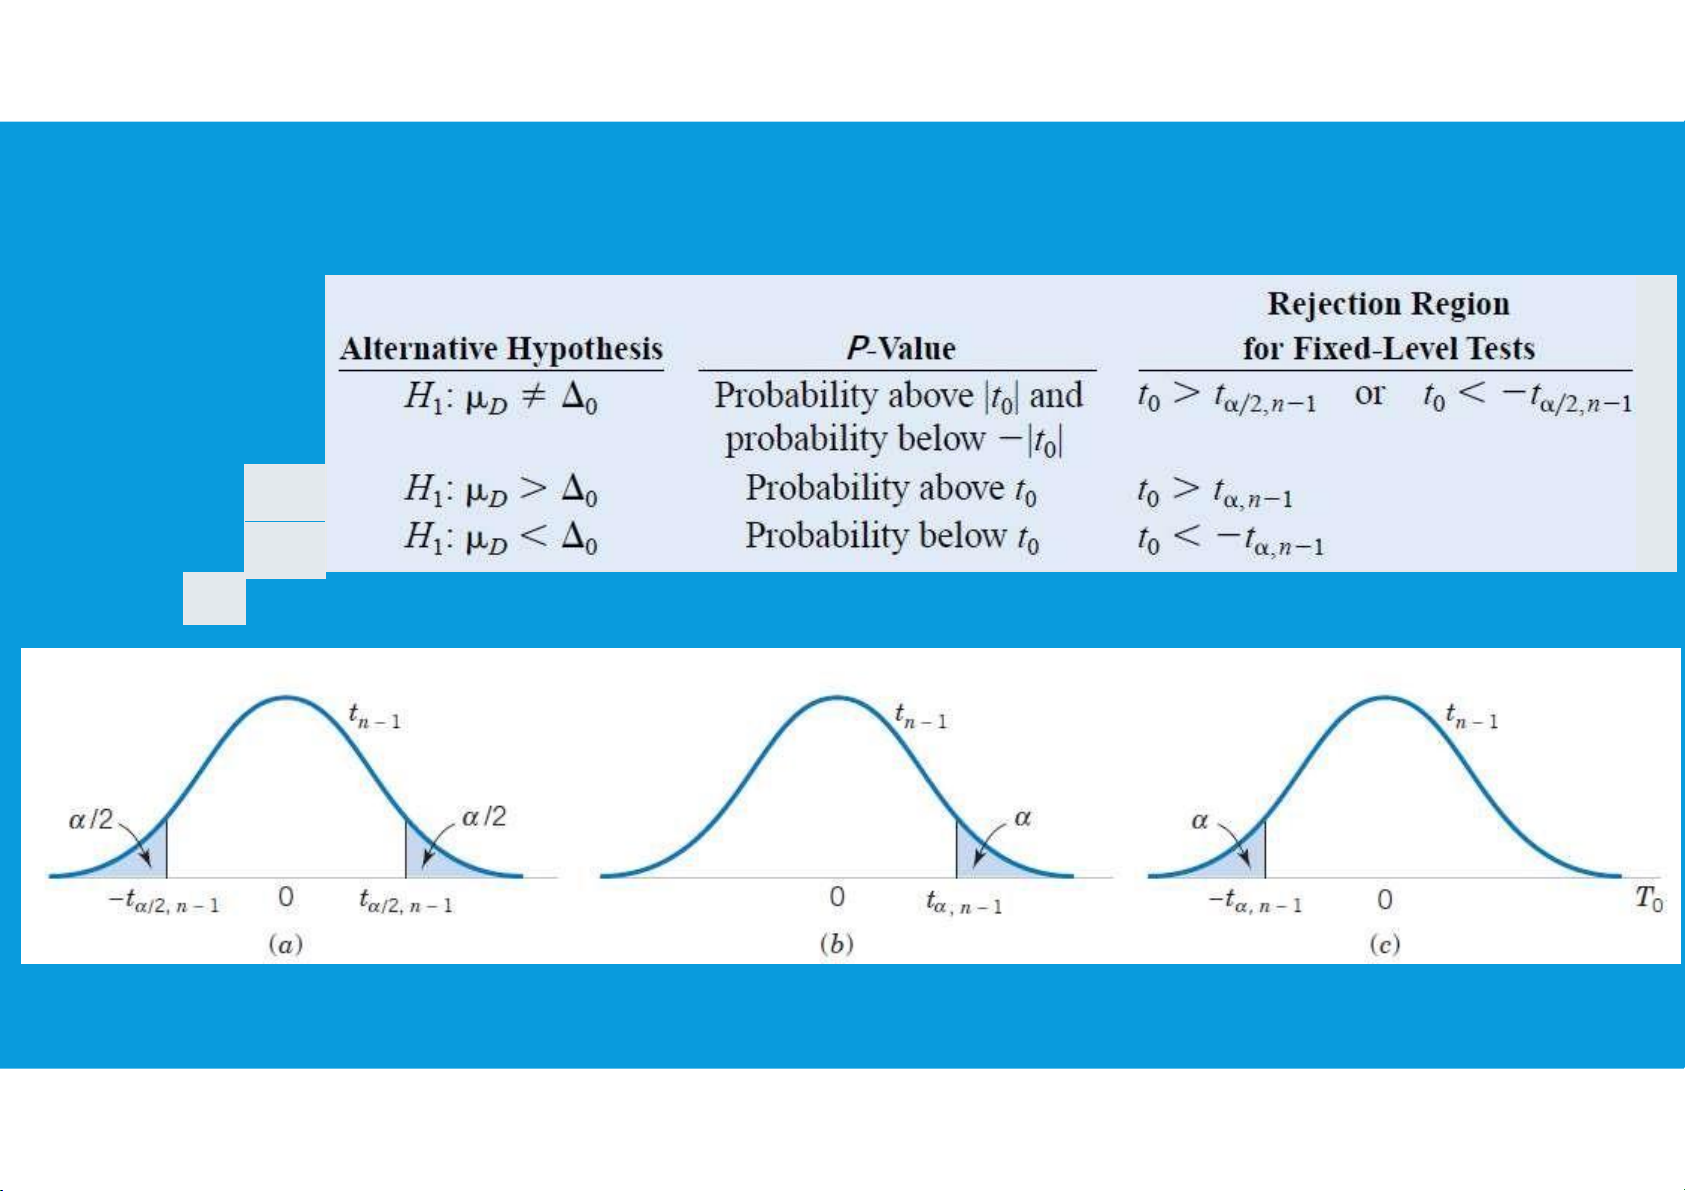
6.1. PAIRED T-TEST FOR ASSESSING THE AVERAGE OF DIFFERENCES Ha: Ha: Ha: tttu@hcmiu.edu.vn 7 lOMoARcPSD|364 906 32
6.1. PAIRED T-TEST FOR ASSESSING THE AVERAGE OF DIFFERENCES tttu@hcmiu.edu.vn 8 lOMoARcPSD|364 906 32 tttu@hcmiu.edu.vn 9 lOMoARcPSD|364 906 32 End of file 1. Any questions? tttu@hcmiu.edu.vn 8
6.2. INDEPENDENT T-TEST FOR ASSESSING THE DIFFERENCE OF TWO AVERAGES
•A t-test on the difference of the averages would conclude that A and B are not different.
•Sometimes it is not possible to pair the tests, and then the averages of the two
treatments must be compared using the independent t-test. lOMoARcPSD|364 906 32 Example:
•Even if water specimens were collected on the same day, there will be differences
in storage time, distribution time, water use patterns, and other factors.
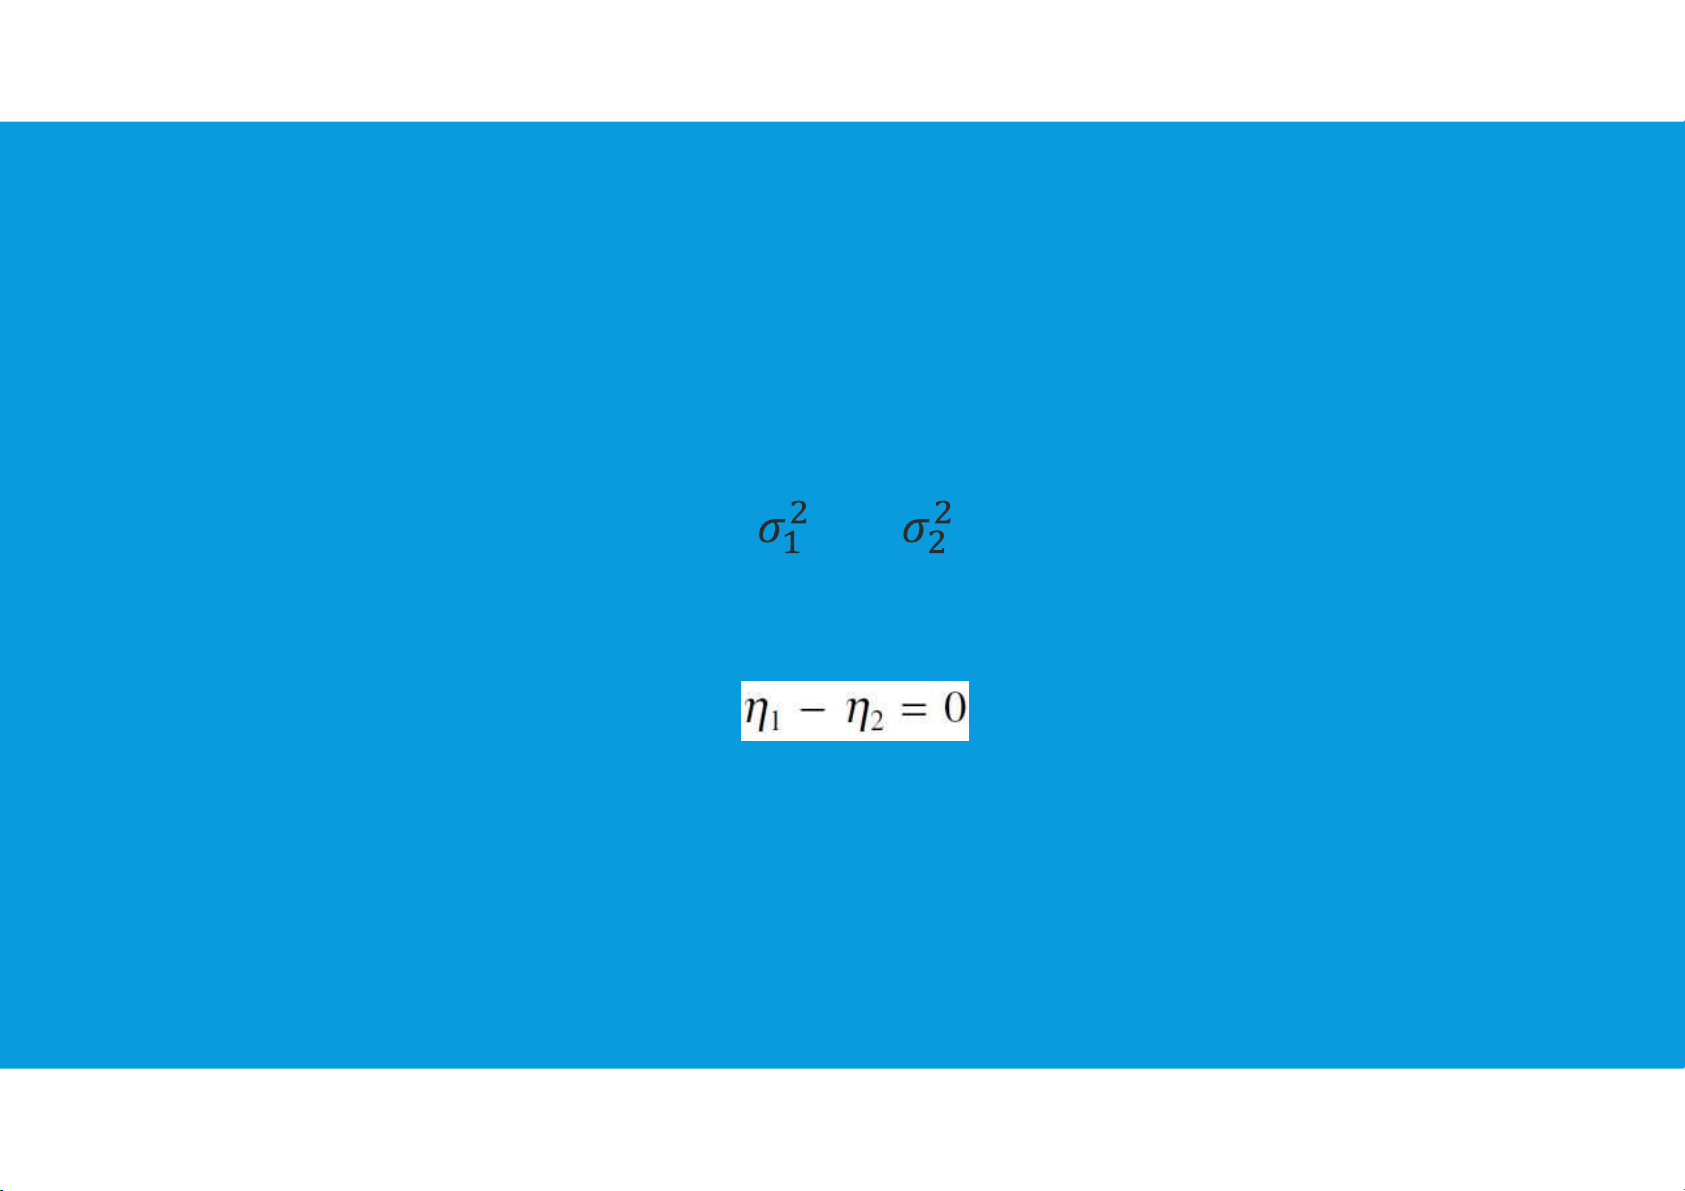
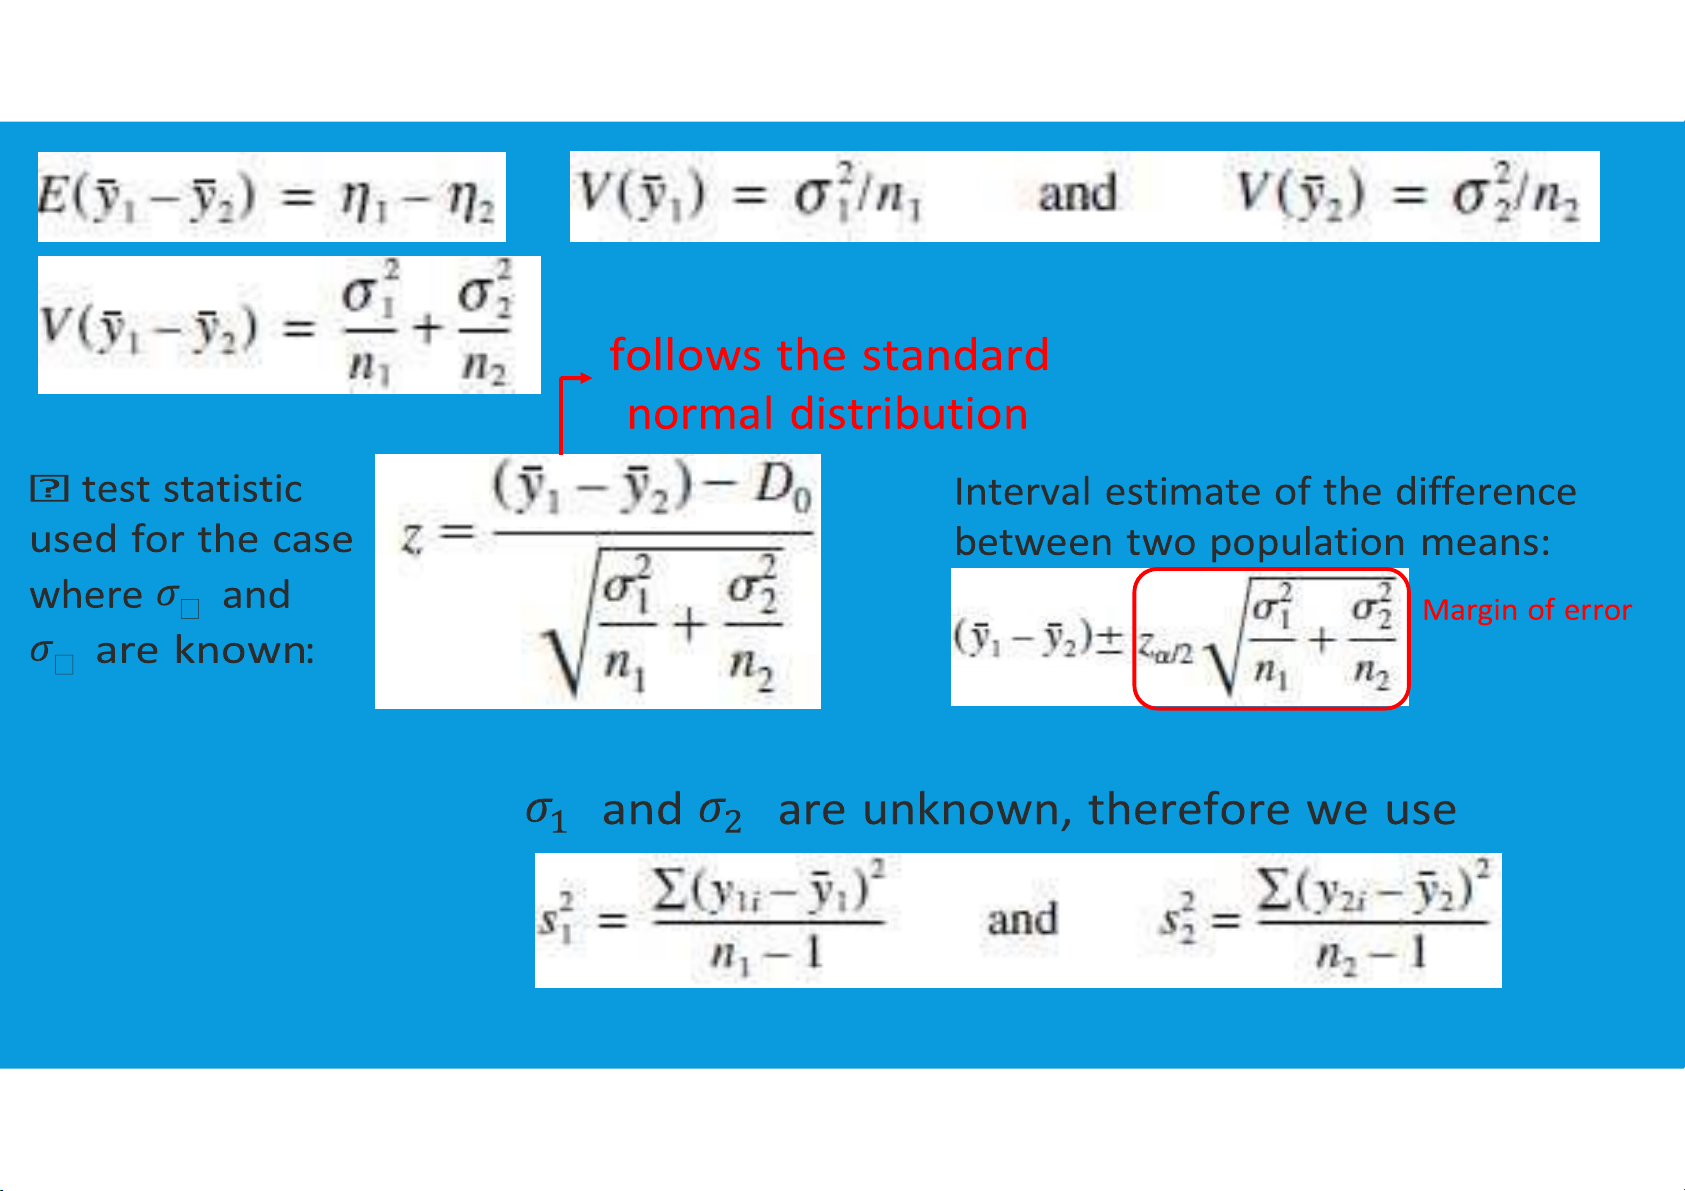
•Two independently distributed random variables y1 and y2 have, respectively,
mean values η1 and η2 and variances and
6.2. INDEPENDENT T-TEST FOR ASSESSING THE DIFFERENCE OF TWO AVERAGES
•The usual statement of the problem is in terms of testing the null hypothesis that
the difference in the means is zero:
•but we prefer viewing the problem in terms of the confidence interval of the difference tttu@hcmiu.edu.vn 11 lOMoARcPSD|364 906 32
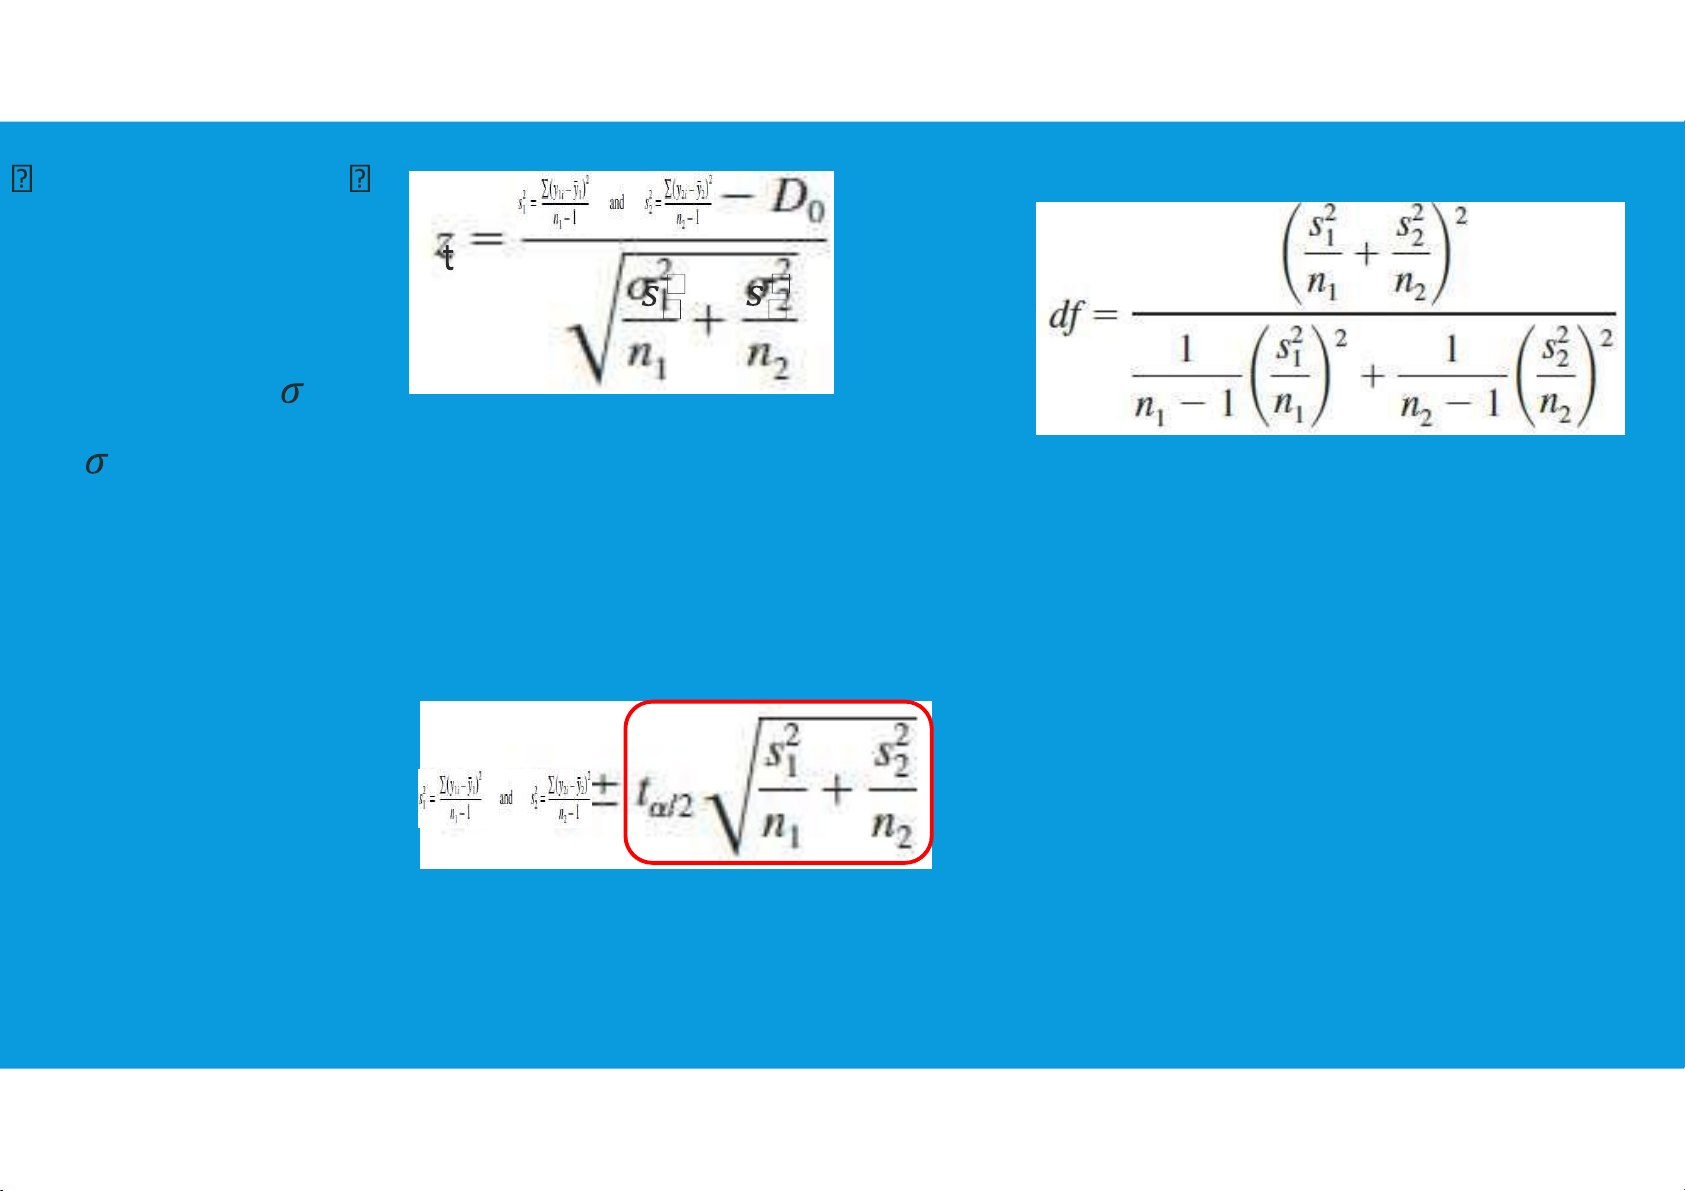
6.2. INDEPENDENT T-TEST FOR ASSESSING THE DIFFERENCE OF TWO AVERAGES Usually the variances estimator of variance: tttu@hcmiu.edu.vn 12 lOMoARcPSD|364 906 32 test statistic used Degree of freedom for t distribution: for the case where ଵ and ଵ are unknown:
Interval estimate of the difference between two population means: Margin of error
6.2. INDEPENDENT T-TEST FOR ASSESSING THE DIFFERENCE OF TWO AVERAGES
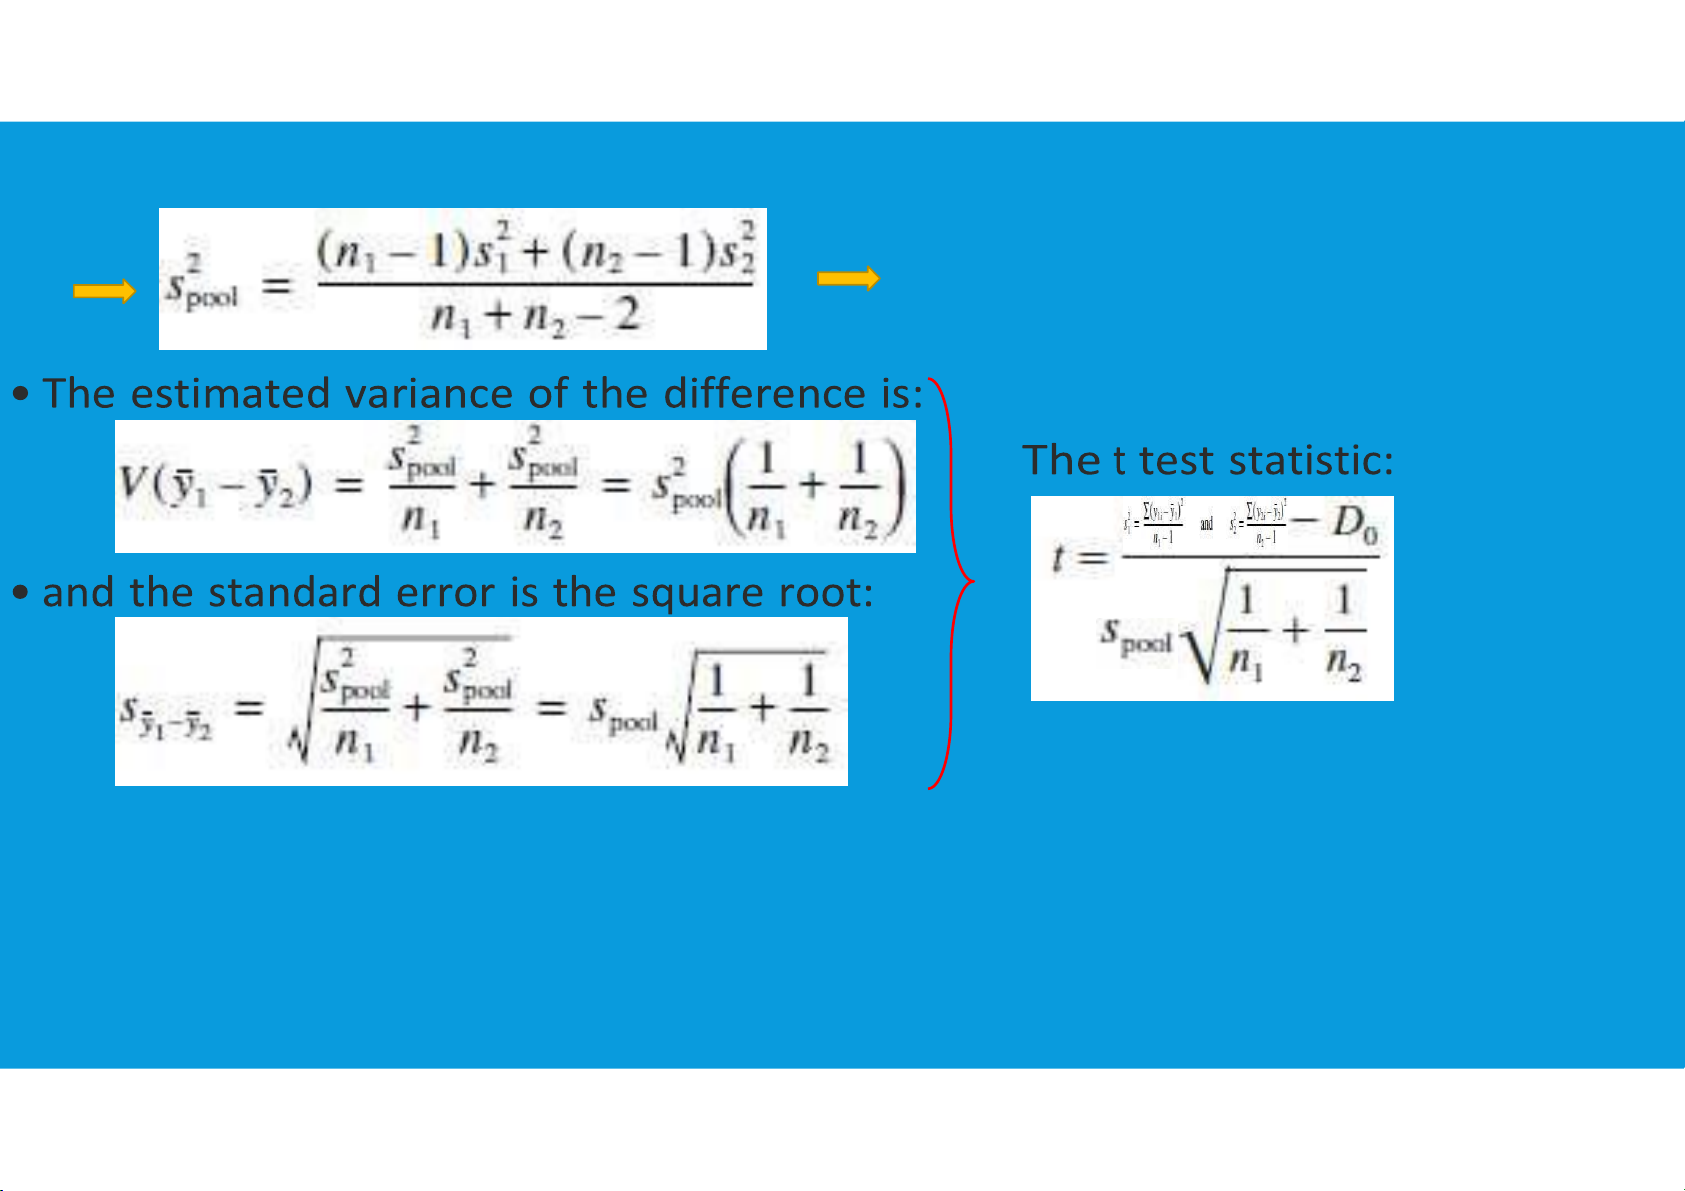
These can be pooled if they are of equal magnitude. tttu@hcmiu.edu.vn 13 lOMoARcPSD|364 906 32
Assuming this to be true, the pooled estimate of the variance is:
This is the weighted average of the variances,
where the weights are the degrees of freedom of each variance.
To construct the (1−α)100% percent confidence interval use the t statistic for α/2 and
ν=n1+n2−2 degrees of freedom tttu@hcmiu.edu.vn 14 lOMoARcPSD|364 906 32
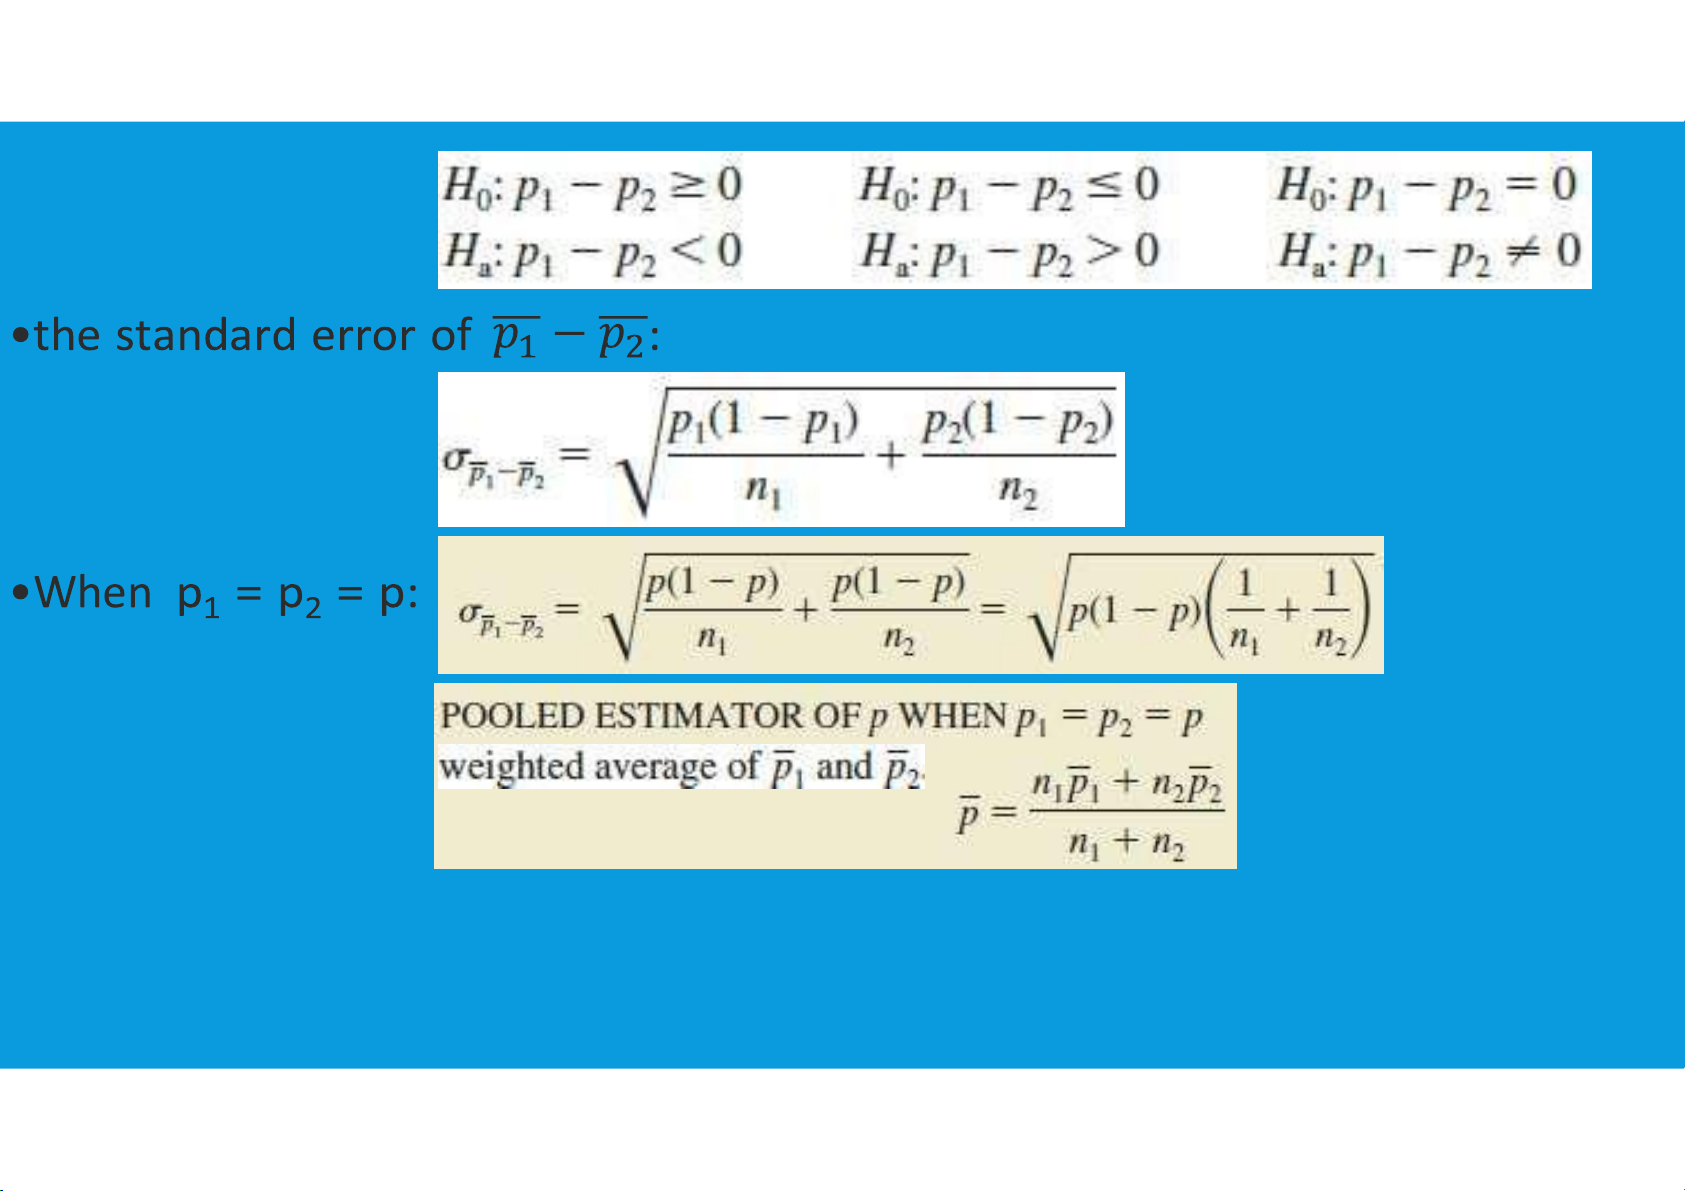
6.3. HYPOTHESIS TESTS ABOUT THE DIFFERENCE BETWEEN THE PROPORTIONS OF TWO POPULATIONS
•Similar application for the proportion: tttu@hcmiu.edu.vn 15 lOMoARcPSD|364 906 32 tttu@hcmiu.edu.vn 16 lOMoARcPSD|364 906 32
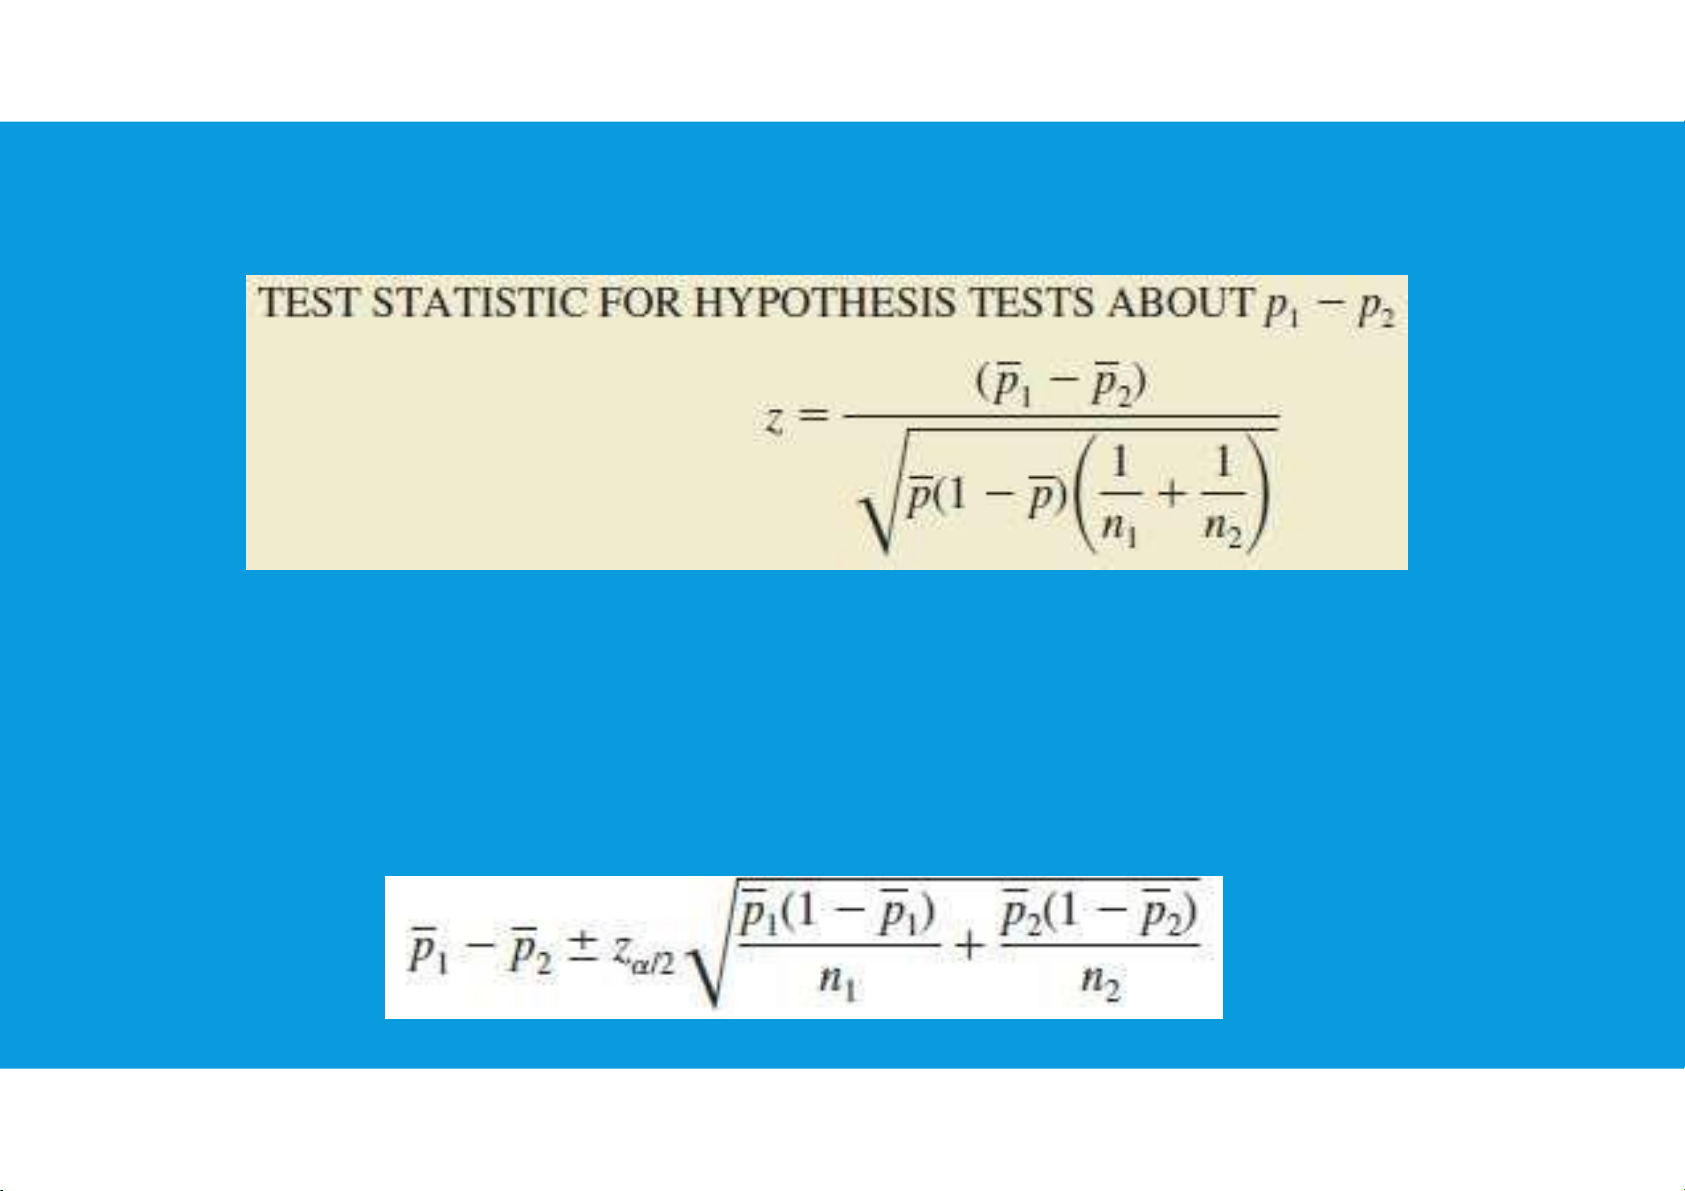
6.3. HYPOTHESIS TESTS ABOUT THE DIFFERENCE BETWEEN THE PROPORTIONS OF TWO POPULATIONS
•This test statistic applies to large sample situations where n1p1, n1(1 − p1), n2p2,
and n2(1 − p2) are all greater than or equal to 5.
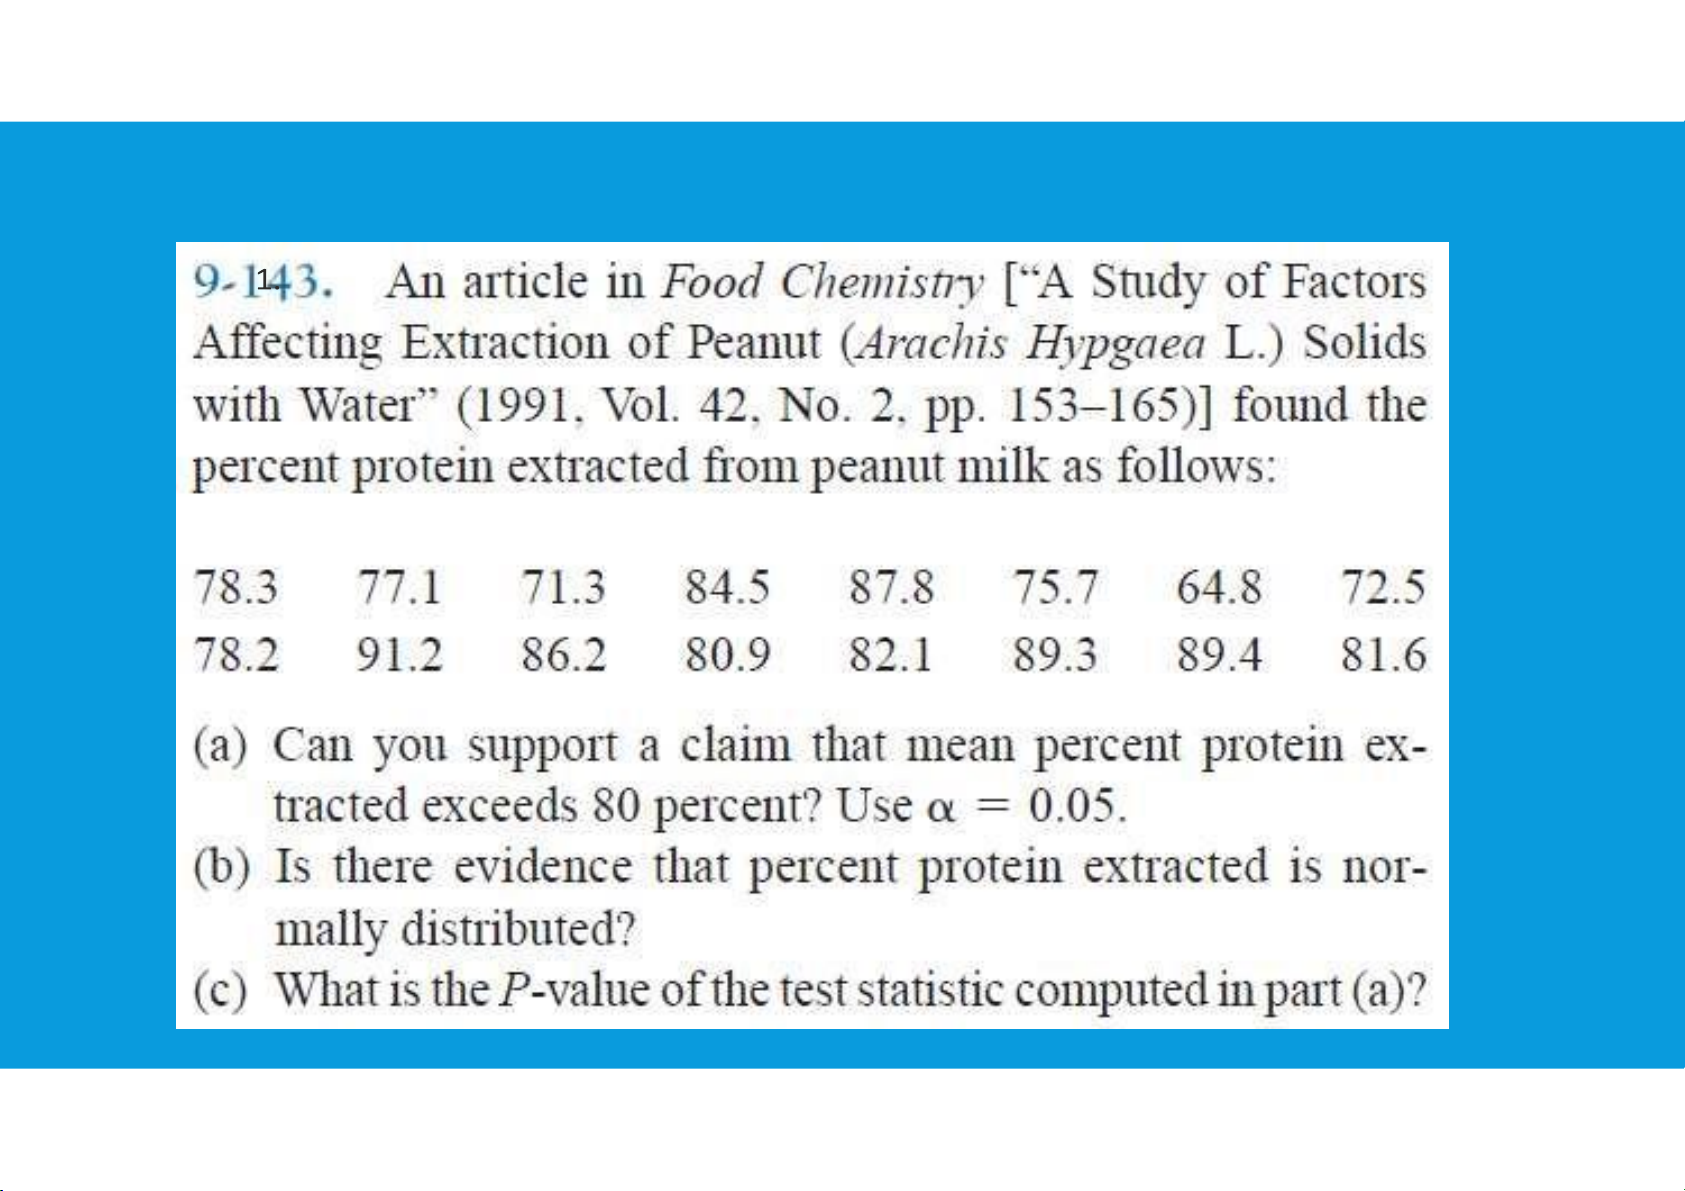
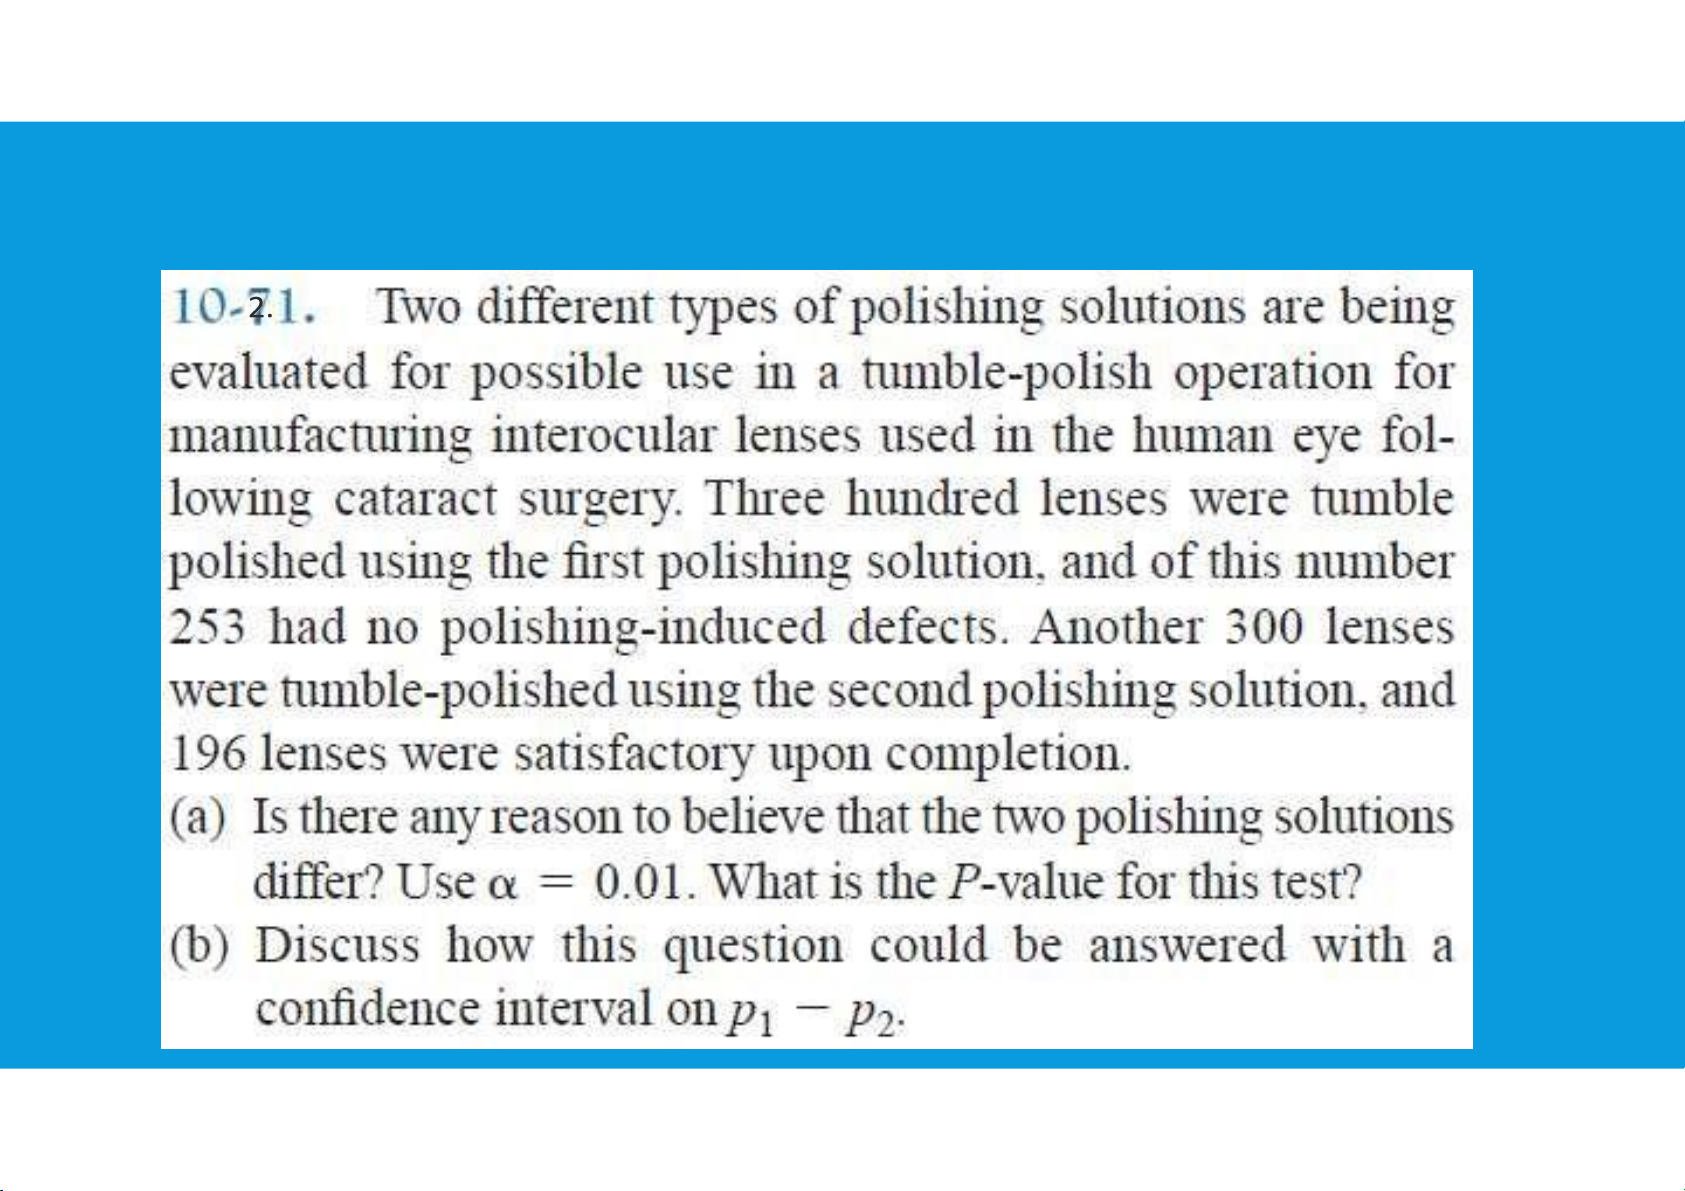
•Interval estimate of the difference between two population proportions: tttu@hcmiu.edu.vn 17 lOMoARcPSD|364 906 32 End of file 2. Any questions? tttu@hcmiu.edu.vn 15 lOMoARcPSD|364 906 32 EXERCISES lOMoARcPSD|364 906 32 tttu@hcmiu.edu.vn 16 EXERCISES lOMoARcPSD|364 906 32 tttu@hcmiu.edu.vn 17
Document Outline
- APPLIED STATISTICS
- Chapter 6: t-Test
- T-TEST
- 6.1. PAIRED T-TEST FOR ASSESSING THE AVERAGE OF DIFFERENCES
- 6.1. PAIRED T-TEST FOR ASSESSING THE AVERAGE OF DIFFERENCES (1)
- 6.1. PAIRED T-TEST FOR ASSESSING THE AVERAGE OF DIFFERENCES (2)
- 6.1. PAIRED T-TEST FOR ASSESSING THE AVERAGE OF DIFFERENCES (3)
- 6.1. PAIRED T-TEST FOR ASSESSING THE AVERAGE OF DIFFERENCES (4)
- 6.3. HYPOTHESIS TESTS ABOUT THE DIFFERENCE BETWEEN THE PROPORTIONS OF TWO POPULATIONS
- 6.3. HYPOTHESIS TESTS ABOUT THE DIFFERENCE BETWEEN THE PROPORTIONS OF TWO POPULATIONS (1)
- EXERCISES
- EXERCISES (1)
- T-TEST
- Chapter 6: t-Test
Tài liệu liên quan:
-
Data and Statistics | Bài giảng số 1 chương 1 học phần Applied statistics | Trường Đại học Quốc tế, Đại học Quốc gia Thành phố Hồ Chí Minh
266 133 -
Data and Statistics | Bài giảng số 2 chương 1 học phần Applied statistics | Trường Đại học Quốc tế, Đại học Quốc gia Thành phố Hồ Chí Minh
360 180 -
Plotting and Smoothing data | Bài giảng số 3 chương 2 học phần Applied statistics | Trường Đại học Quốc tế, Đại học Quốc gia Thành phố Hồ Chí Minh
203 102 -
Descriptive statistics | Bài giảng số 4 chương 3 học phần Applied statistics | Trường Đại học Quốc tế, Đại học Quốc gia Thành phố Hồ Chí Minh
207 104 -

Descriptive statistics | Bài giảng số 5 chương 3 học phần Applied statistics | Trường Đại học Quốc tế, Đại học Quốc gia Thành phố Hồ Chí Minh
241 121